INTRODUCTION
The Galapagos Islands are subject to environmental and oceanographic instability mainly due to the El Niño Southern Oscillation (ENSO), but despite this, they are home to two endemic otariid species: the Galapagos sea lion (Zalophus wollebaeki) and the Galapagos fur seal (Arctocephalus galapagoensis); species that require a lot of energy to meet their ecological and physiological needs (Costa et al., Reference Costa, Weise, Arnould, Esters, Demaster, Doak, Williams and Brownell2006).
Fluctuations in regional marine productivity and oceanographic disturbances such as the ENSO have resulted in a population decrease of more than 50% for both species over the last 30 yr (Trillmich & Ono, Reference Trillmich and Ono1991; Heath, Reference Heath, Perrin, Wursig and Thiewissen2002). This situation has led the International Union for Conservation of Nature (IUCN) to classify these species as endangered (Aurioles-Gamboa & Trillmich, Reference Aurioles-Gamboa and Trillmich2008).
The oceanographic variability of the archipelago causes changes in marine ecosystem dynamics that are reflected from the bottom to the top of the trophic web (Palacios et al., Reference Palacios, Bograd, Foley and Schwing2006; Schaeffer et al., Reference Schaeffer, Morrison, Kamykowski, Feldman, Xie, Liu, Sweet, McCulloch and Banks2008). These changes cause top predators to respond by diversifying their foraging strategies (Villegas-Amtmann et al., Reference Villegas-Amtmann, Costa, Tremblay, Aurioles-Gamboa and Salazar2008; Baque-Menoscal et al., Reference Baque-Menoscal, Páez-Rosas and Wolff2012; Páez-Rosas et al., Reference Páez-Rosas, Aurioles-Gamboa, Alava and Palacios2012).
The diversity in foraging habits of marine predators may be caused by both extrinsic and intrinsic factors, including habitat quality, seasonal changes of marine productivity, age, sex and reproductive conditions (Villegas-Amtmann et al., Reference Villegas-Amtmann, Simmons, Kuhn, Huckstadt and Costa2011). These changes are more evident in species inhabiting tropical zones,where productivity uncertainty is greater, which, in turn, cause changes in the abundance of prey species (Gentry & Kooyman, Reference Gentry and Kooyman1987).
Traditionally, the study of foraging habits in otariids has been based on analysis of stomach contents and scats. Both techniques are based on the recovery and identification of hard structures, such as fish otoliths and cephalopod beaks, which have a distinctive morphology, permitting prey species to be identified to the species level (García-Rodríguez & Aurioles-Gamboa, Reference García-Rodríguez and Aurioles-Gamboa2004; Tollit et al., Reference Tollit, Heaslip, Deagle, Iverson, Joy, Rosen, Trites, Trites, Atkinson, DeMaster, Fritz, Gelatt, Rea and Wynne2006). Of these techniques, scat analysis is very useful for studying an organism's diet, as a large quantity of samples can be collected quickly without hurting the organism.
This approach has been used to describe the feeding habits of Z. wollebaeki at different islands, indicating the consumption of both benthic and pelagic fish and, in smaller proportions, cephalopods (Salazar Reference Salazar2005). The diet consisted primarily of schooling epi-pelagic fishes such as sardines (Sardinops sagax) in the western region (Dellinger & Trillmich Reference Dellinger and Trillmich1999), and other benthic and pelagic species like the sand bass and the bigeye scad (Paralabrax spp. and Selar crumenophthalmus) at the other end of the archipelago (Páez-Rosas & Aurioles-Gamboa, Reference Páez-Rosas and Aurioles-Gamboa2010). Therefore the diet of Z. wollebaeki is composed of a wide variety of prey, from both benthic and pelagic environments, which may vary geographically (Salazar, Reference Salazar2005; Páez-Rosas, Reference Páez-Rosas2011). Villegas-Amtmann et al., (Reference Villegas-Amtmann, Costa, Tremblay, Aurioles-Gamboa and Salazar2008) using satellite telemetry studies and dive records, found different feeding strategies (epipelagic, mesopelagic and benthic) in the rookery of Caamaño located in the central region of the archipelago, suggesting that this species has the ability to diversify its feeding habits to an inter-population and intra-population level.
The isotopic variation analysis of carbon and nitrogen (δ13C and δ15N) has become an important tool for studying the foraging habits of marine predators. This technique allows the researcher to infer the habitat of a consumer (δ13C) (DeNiro & Epstein, Reference DeNiro and Epstein1978) and the trophic level at which it is feeding (δ15N) (DeNiro & Epstein, Reference DeNiro and Epstein1981). Regarding the δ15N, this bioaccumulates between a consumer and its prey (Post, Reference Post2002; Bearhop et al., Reference Bearhop, Colin, Adams, Fuller and Macleod2004), resulting in an average increase in isotopic enrichment in 15N from 3 to 5‰ between trophic levels (Minagawa & Wada, Reference Minagawa and Wada1984). A similar effect is produced for δ13C; however, the average enrichment varies from 0.5 to 1‰ between trophic levels (Hobson et al., Reference Hobson, Schell, Renouf and Noseworthy1996).
Physicochemical and biological factors determine the differences in baseline δ13C values between habitats (coastal/ocean or pelagic/benthic), including the isotopic composition and concentration of dissolved CO2 available to primary producers (Hobson et al., Reference Hobson, Schell, Renouf and Noseworthy1996; France, Reference France1995); the taxonomic composition and growth rate of phytoplankton (Fry & Wainwright, Reference Fry and Wainright1991; Pancost et al., Reference Pancost, Freeman, Wakeham and Robertson1997); and the influence of carbon derived from benthic macrophytes in coastal zones that are 13C-enriched compared to phytoplankton in open-ocean pelagic environments (France, Reference France1995).
The δ13C values of primary producers may also vary among ocean basins, where pelagic ecosystems in high latitudes typically have much lower δ13C values than pelagic ecosystems at lower latitudes. This difference is primarily because aqueous (CO2) is high in colder regions, due to seasonally low photosynthetic rates caused by light and trace metal limitation, vertical mixing of a weakly stratified water column, and the greater solubility of CO2 leads to lower δ13C values (Graham et al., Reference Graham, Koch, Newsome, McMahon, Aurioles-Gamboa, West, Bowen, Dawson and Tu2010). These factors are related to the enzymatic activity of Ribulose-1,5-bisphosphate carboxylase oxigenase (RuBisCO), which catalyzes the CO2 fixation process to an organic form, and the photorespiration on this substrate by the primary producers, generating a absorption of dioxide carbon into the cells and dissipating energy to the environment (Pancost et al., Reference Pancost, Freeman, Wakeham and Robertson1997).
Nitrogen isotope compositions of primary producers set the δ15N value at the base of the food web and are dependent upon the δ15N values of their nutrient source (e.g., nitrate, ammonium, N2). For instance, for offshore waters the δ15N value of dissolved N2 is near 0‰, and there is little isotopic fractionation associated with its biological uptake by phytoplankton; N2-fixation generates organic matter with low δ15N values (Montoya, Reference Montoya, Michener and Lajtha2010).
The latitudinal gradient and oceanographic activity produces changes in δ15N values at the base of the trophic webs that are reflected in different predators, independent of trophic level (Aurioles-Gamboa et al., Reference Aurioles-Gamboa, Newsome, Salazar-Pico and Koch2009); aspects which in turn are linked to the rate of N2 fixation and denitrification levels in the trophic web (Sigman et al., Reference Sigman, Granger, DiFiore, Lehmann, Ho, Cane and van Geen2005). This effect may be related to a decrease in the primary productivity of the environment, causing a cascading reduction in the general biomass resource and leading to changes in the importance of the main prey species of the predators to varying degrees, depending on the region (Bearhop et al., Reference Bearhop, Colin, Adams, Fuller and Macleod2004; Newsome et al., Reference Newsome, Clementz and Koch2010).
In this study, analysis of scats and stable isotopes in the fur of the Galapagos sea lion, Zalophus wollebaeki, were used to determine the degree of complexity in the foraging behaviour of this species at a spatial level.
MATERIALS AND METHODS
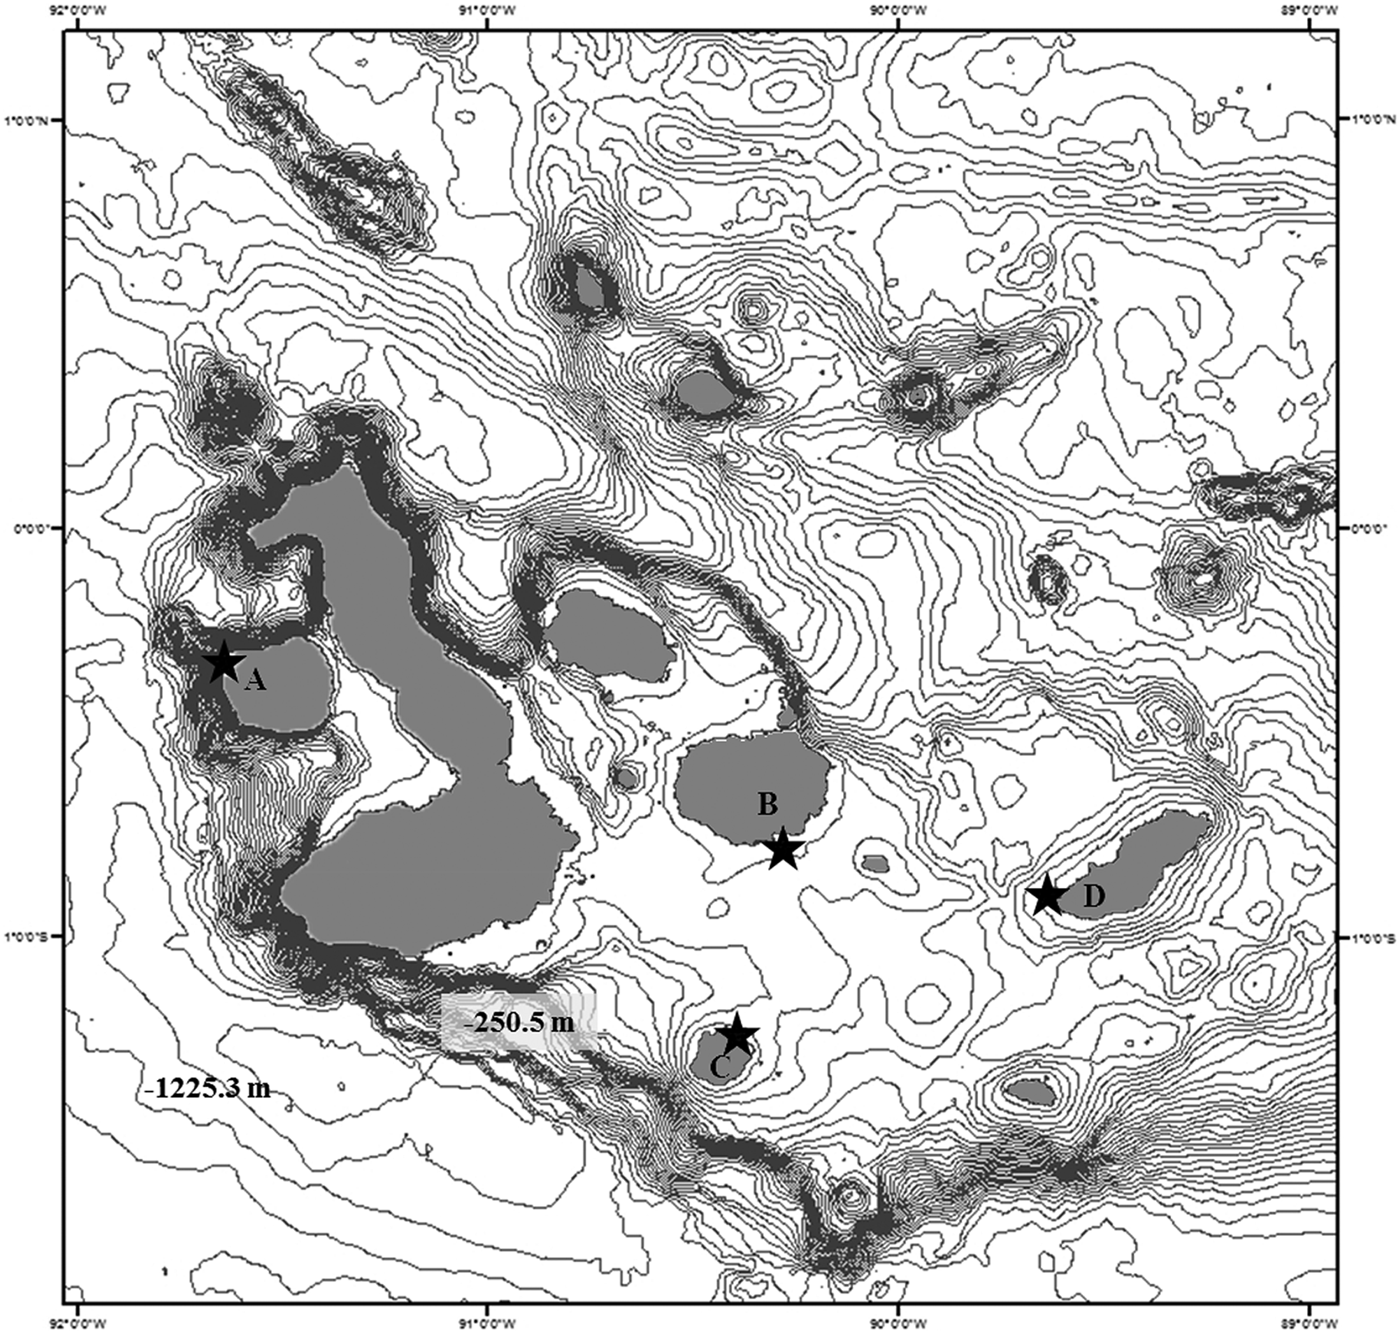
The regional biogeography of the Galapagos archipelago proposed by Harris, (Reference Harris1969) and Ruttenberg et al., (Reference Ruttenberg, Haupt, Chiriboga and Warner2005) was considered to identify a possible spatial pattern in the foraging habits of Zalophus wollebaeki. Four breeding rookeries, representing each region, were monitored: Cabo Douglas–Western (0°18′S 91°39′W), Caamaño–Central (0°45′S 90°16′W), Post Office–Southern (01°13′S 90°36′W), and Malecón–Eastern (0°54′S 89°36′W) (Figure 1).

Fig. 1. Collection sites for samples of Galapagos sea lion fur and scat in breeding rookeries: (A) Cabo Douglas (0°18′S 91°39′W) Fernandina Island; (B) Caamaño (0°45′ 90°16′W) Santa Cruz Island; (C) Post Office (01°13′S 90°36′W) Floreana Island; and (D) Malecón (0°54′ 89°36′W), San Cristóbal Island.
Scat analysis
In March 2009, 50 scat samples were collected in each rookery, with a preference for areas where the females were predominant (55.5%). Each sample was kept in a hermetically sealed plastic bag and labeled with the date and collection site. The samples were sifted with sieves of different mesh size (2.0, 1.2 and 0.7 mm). Structures, including fish otoliths and cephalopod beaks, were collected and used to identify prey species using a stereoscope and specialized literature (García-Godos, Reference García-Godos2001; Díaz-Murillo, Reference Díaz-Murillo2007).
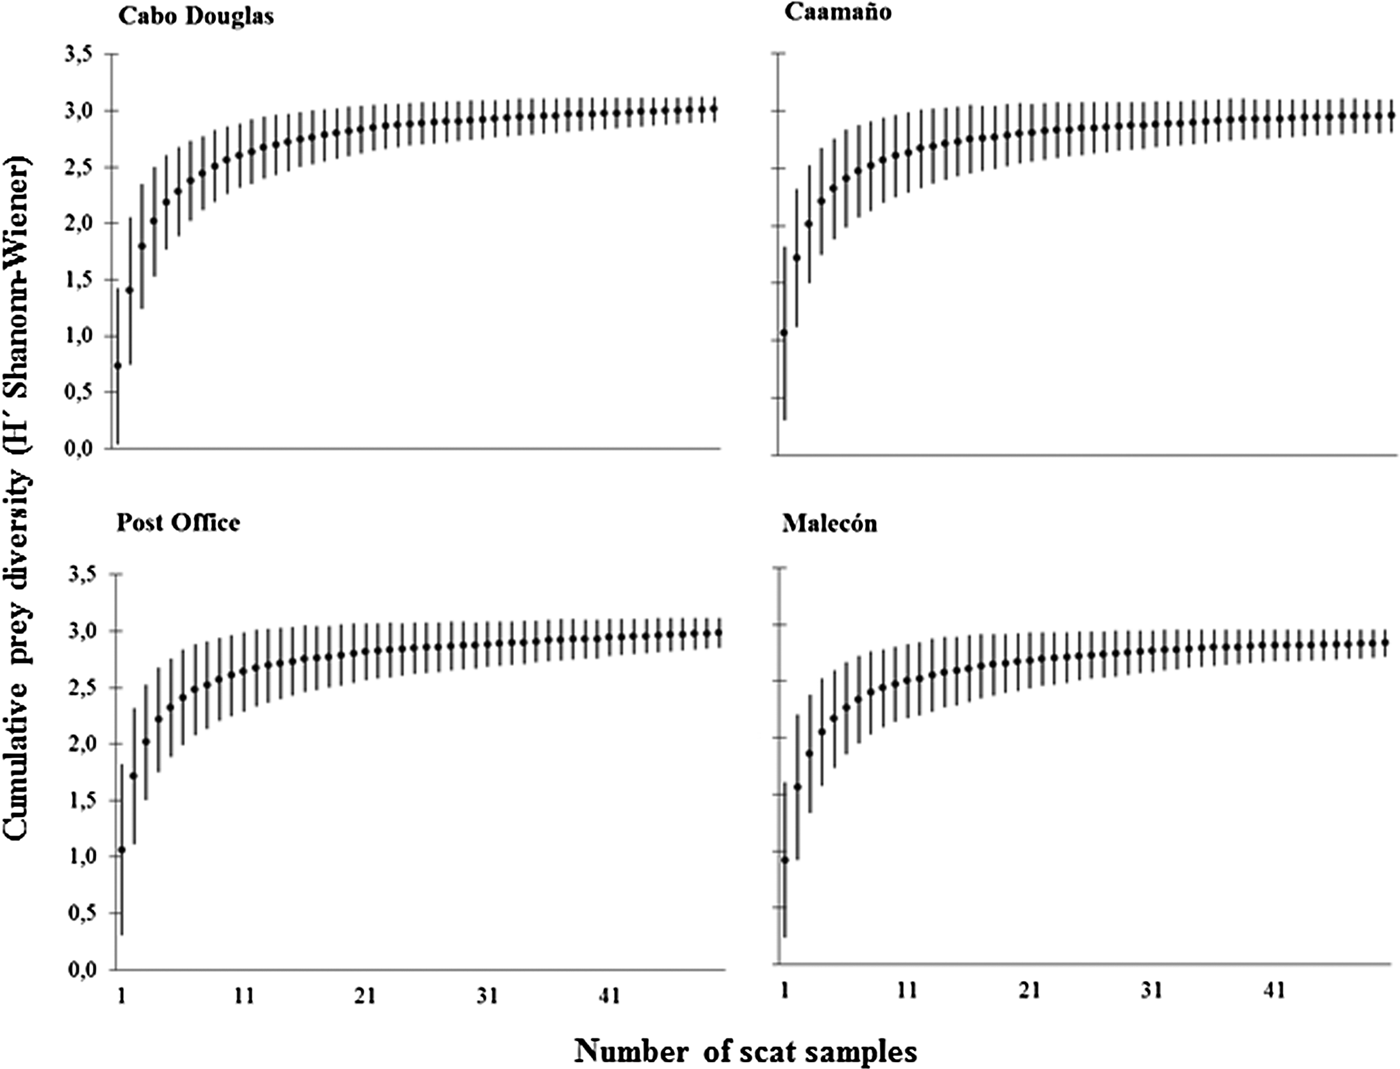
The function proposed by Ferry et al., (1997) and applied in previous studies for this species (Porras-Peters et al., Reference Porras-Peters, Aurioles-Gamboa, Koch and Cruz-Escalona2008; Páez-Rosas & Aurioles-Gamboa, Reference Páez-Rosas and Aurioles-Gamboa2010) was used for estimating the sample size representative of the potential spectrum of prey consumed in each area and season by sea lions. The method consists of calculating the accumulated average and standard deviation of a group of diversity curves generated from prey abundance data, through the Shannon–Wiener H' Index (Krebs, Reference Krebs1999). The diversity curves are derived from a function designed in the MATLAB program, which computes 500 permutations at random with all the original data and a 0.05 margin of error. This error is obtained from the data's coefficient of variation and is measured when the accumulated average reaches an asymptote that identifies the appropriate sample size needed to characterize the diet of each rookery.
We used the Index of Importance (IIMPi) to determine the composition of the diet (García-Rodríguez & Aurioles-Gamboa, Reference García-Rodríguez and Aurioles-Gamboa2004). The IIMPi measures the importance of prey in each sample unit of scat and includes the probability of finding that prey in a collection of scat. The index generates results from 0 to 1 that are converted into percentages (IIMPi × 100). The degree of trophic overlap between the rookeries was calculated through the Morisita–Horn Index (Cλ) (Krebs, Reference Krebs1999), which defines the shared use of food resources between two or more populations (Horn, Reference Horn1966).
Stable isotope analysis
In March 2009 a total of 80 fur samples were collected from pups of approximately two months of age in the four rookeries under study: Cabo Douglas (n = 20), Caamaño (n = 20), Post Office (n = 20), and Malecón (n = 20). The age of the pups was calculated based on the growth rate (108 g d−1) reported for this species (Trillmich & Wolf, Reference Trillmich and Wolf2008).
Each sample was rinsed with deionized water to remove residue that interferes with the isotopic signal. Subsequently, the samples were dried in an oven at 80°C for 12 h, and the lipids were extracted using the microwave assisted extraction (MAE) protocol (Microwave Oven Model 1000 MARS 5 × CEM) with 25 ml of chloroform/methanol (1:1) solution (Bligh & Dyer, Reference Bligh and Dyer1959). This process was applied because the lipids are enriched in 12Crelative to proteins, so in large quantities could negatively skew the isotopic signal of 13C (Tieszen et al., Reference Tieszen, Boutton, Tesdahl and Slade1983). The sample was homogenized to a fine powder in an agate mortar; then ~0.5 mg of sample was weighed and placed in tin capsules for δ15N and δ13C analysis.
The isotopic ratios were measured using a continuous flow mass spectrometer (20-20 PDZ Europa, Chester, UK) in the Stable Isotopes Laboratory at the University of California at Davis (Davis, USA). The results were expressed in parts per thousand (‰) using the following equation:
where Rsample and Rstandard are 13C/12C or 15N/14N ratios of the sample and standard, respectively. The standards were PDB (Pee Dee Belemnite) for δ13C and the atmospheric N2 for δ15N.
Significant differences in the δ15N and δ13C values between rookeries were evaluated using a nonparametric analysis of variance (Kruskal–Wallis test) along with the Fisher's LSD test for multiple comparisons. Significance was defined as P < 0.05 level. Statistica 8.0 software was used to perform the statistical analysis.
RESULTS
Scat analysis
The diversity curves derived from scat samplings in the sea lion rookeries reached the asymptote between 38 and 48 scats, revealing that the sample size established a priori in each rookery (50 scats) was sufficient to describe the composition of the diet of Zalophus wollebaeki at each site and for that period of time (Figure 2).

Fig. 2. Prey diversity curves (average ±SD) representing the diet of the Galapagos sea lion. Prey diversity is based on Shannon–Wiener (H′). The curves were generated from abundance data of the prey species identified in scat samples in each rookery.
Diet composition
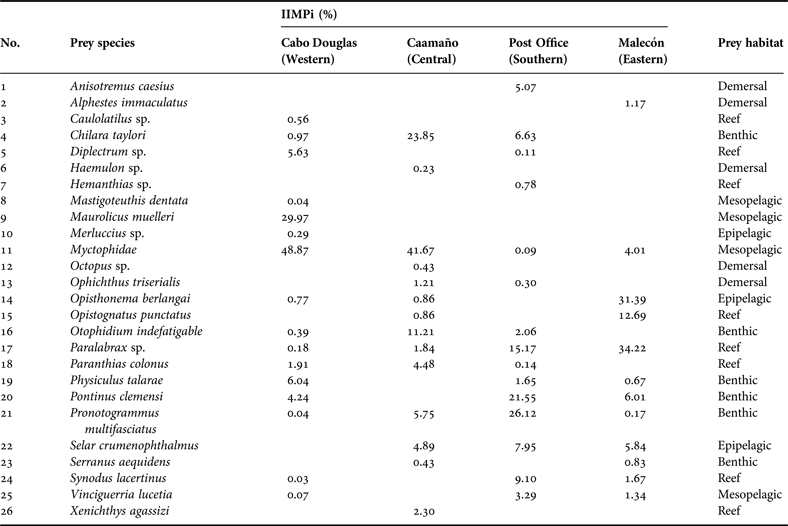
Out of the four rookeries sampled, Cabo Douglas (western region) showed the largest trophic spectrum with 16 prey species (15 fish and one cephalopod). The Post Office rookery (southern region) showed 15 prey species (fish only), Caamaño (central region) 14 prey species (13 fish and one cephalopod) and Malecón (eastern region) 12 prey species (fish only). Of these prey 69.3% were identified to the species level, 26.9% to the genus level, and 3.8% to the family level (Table 1).
Table 1. Index of Importance (IIMPi) values of prey identified in Galapagos sea lion scat samples collected in March 2009 in four rookeries of the archipelago.

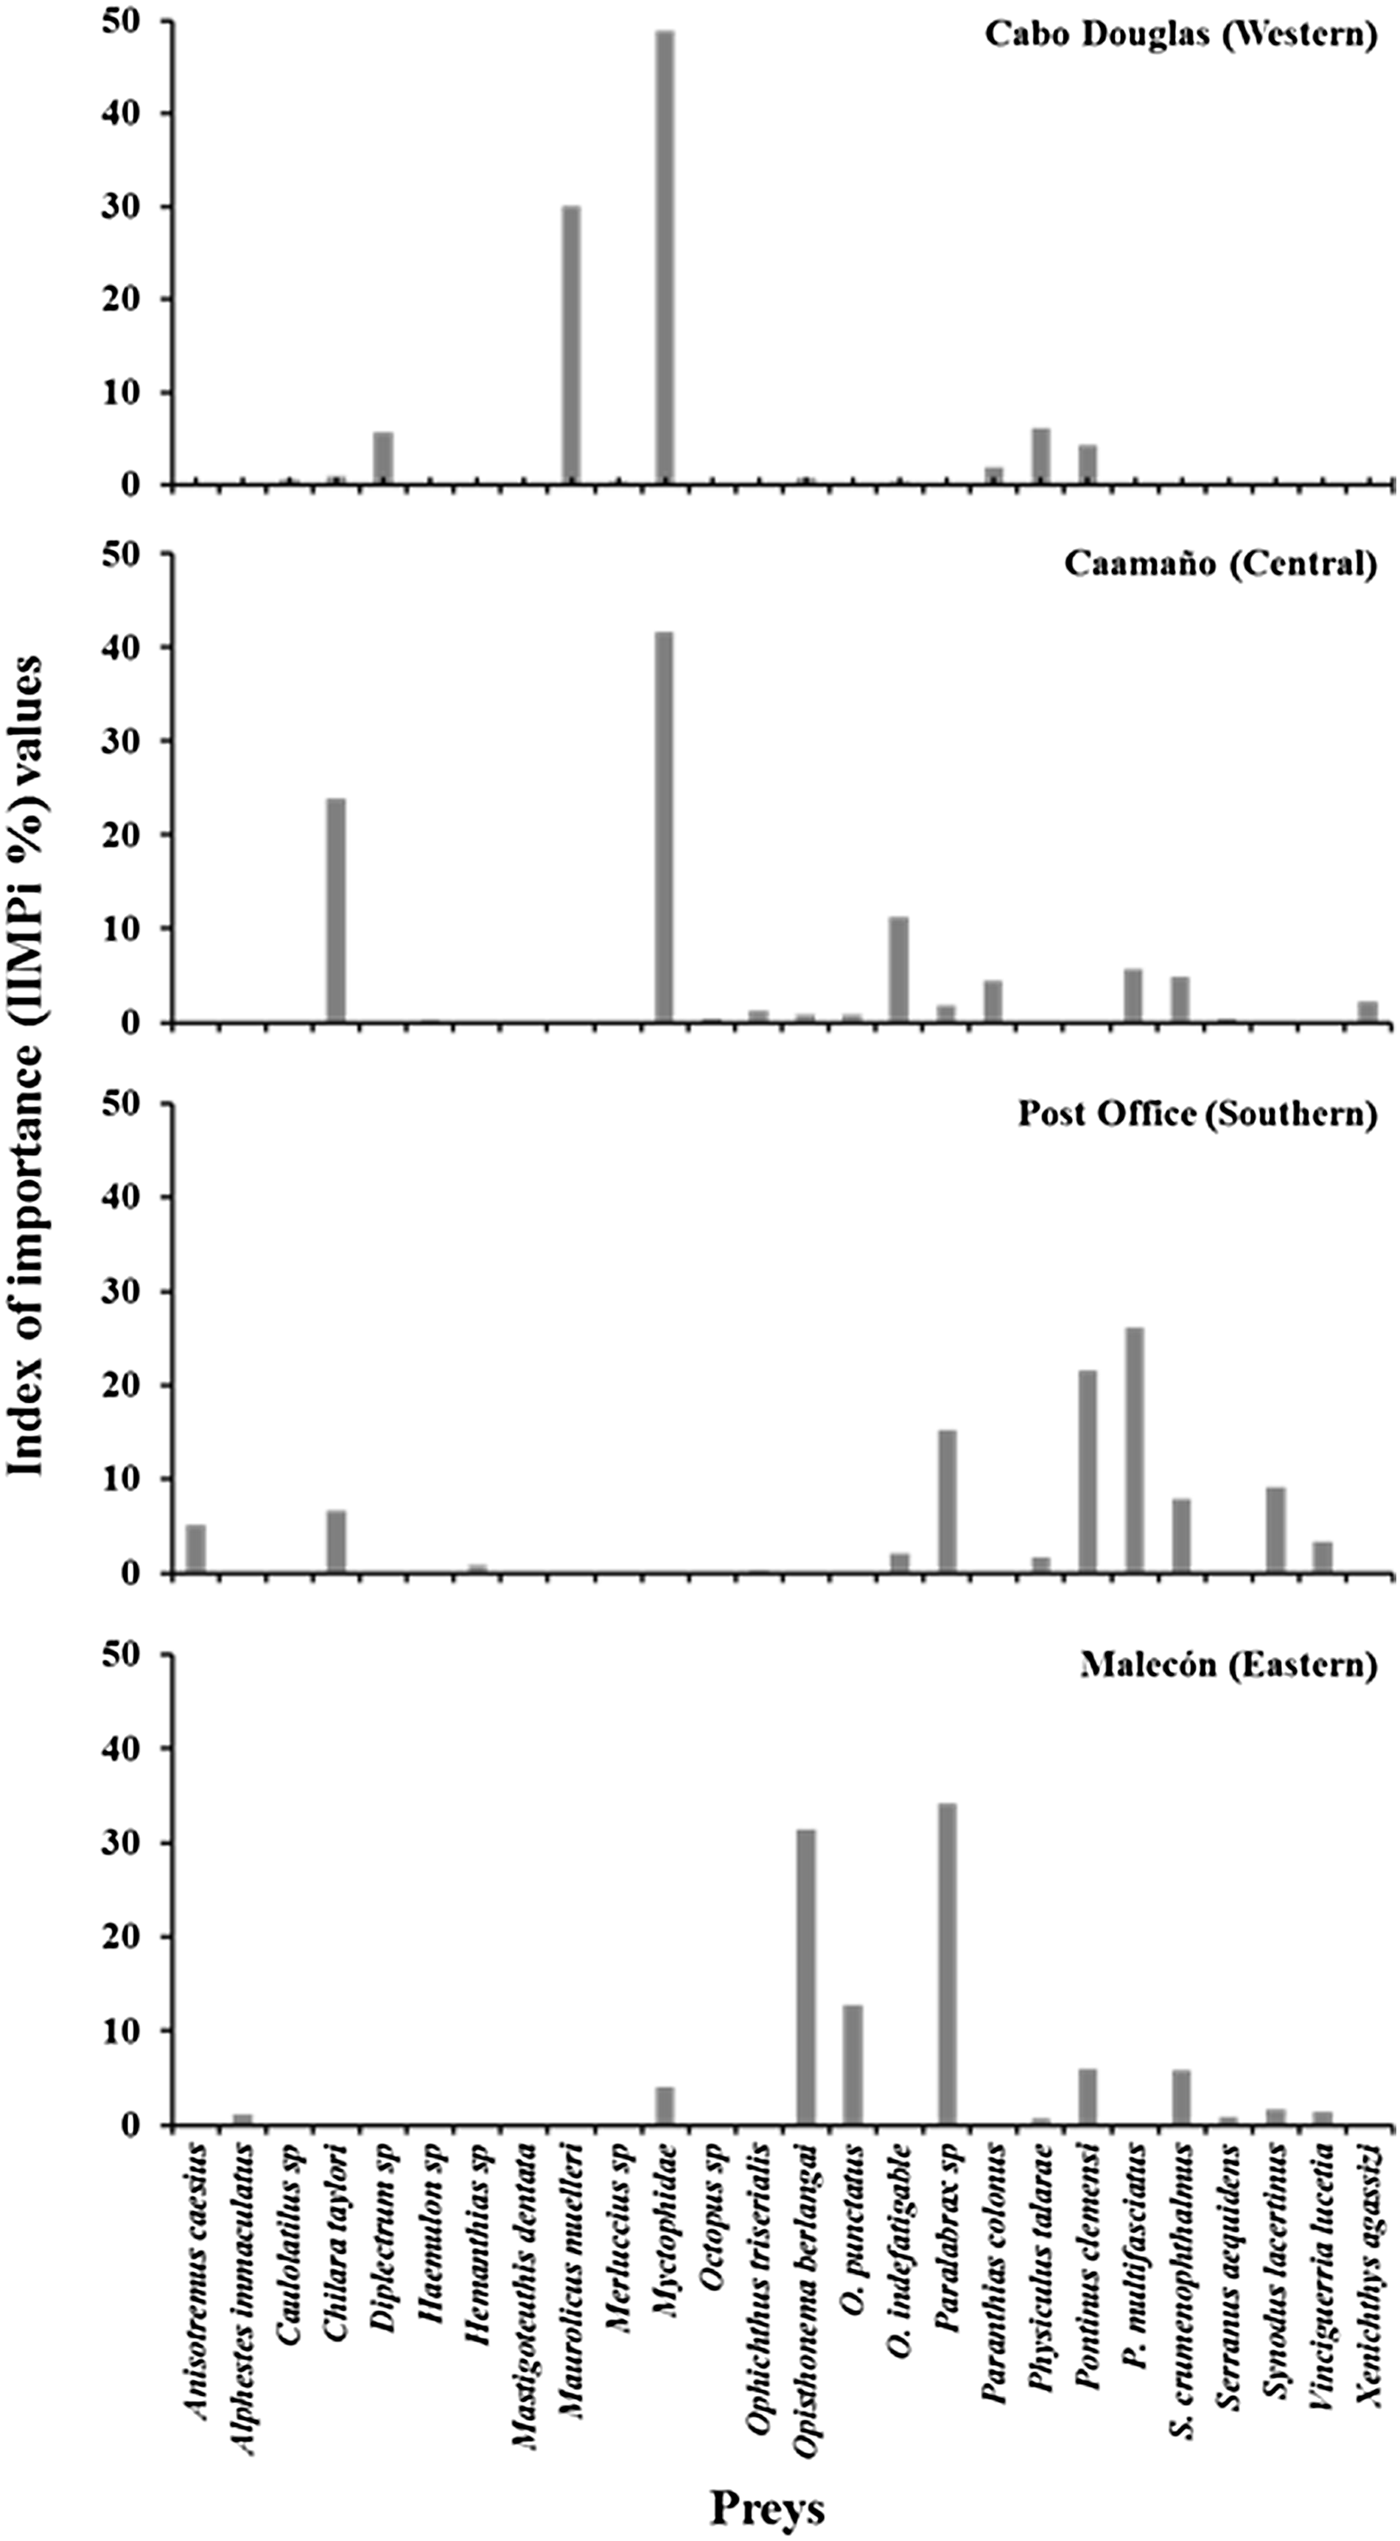
Several of the prey species were incidental as reflected by their low percentage of importance, therefore, only prey species that exceeded 2% in the IIMPi were considered as main prey. Based on this criterion, five main preys were identified in Cabo Douglas; the myctophid fish (Myctophidae) were the most important (48.8%), followed by Maurolicus muelleri (29.9%). At Caamaño, seven main prey species were identified, with myctophid fish (41.6%) and Chilara taylori (23.8%) as the dominating components in the diet. At Post Office nine main prey species were present, of which Pronotogrammus multifasciatus (26.1%) and Pontinus clemensi (21.5%) were the most important. The diet of sea lions at Malecón was dominated by Paralabrax spp. (34.2%) and Opisthonema berlangai (31.3%) (Figure 3).

Fig. 3. Index of Importance (IIMPi) values of the main prey (≥1%) identified in Galapagos sea lion scat samples collected in March 2009 in four rookeries representing different regions of Archipelago.
Spatial trophic overlap
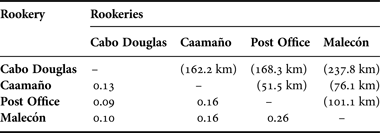
The Morisita–Horn Index (Cλ) (Krebs Reference Krebs1999) indicated that there was no significant trophic overlap between the four rookeries (Cλ = 0.10 to 0.26) (Table 2), suggesting that the selected Z. wollebaeki rookeries representing the distinct regions of the Archipielago had distinct feeding habits.
Table 2. Trophic overlap values among Galapagos sea lion rookeries corresponding to different regions of the archipelago. The trophic overlap is based on the Morisita–Horn (C λ) index. The distance (km) between the analysed pairs of rookeries is shown in parenthesis above the diagonal.

Stable isotope analysis
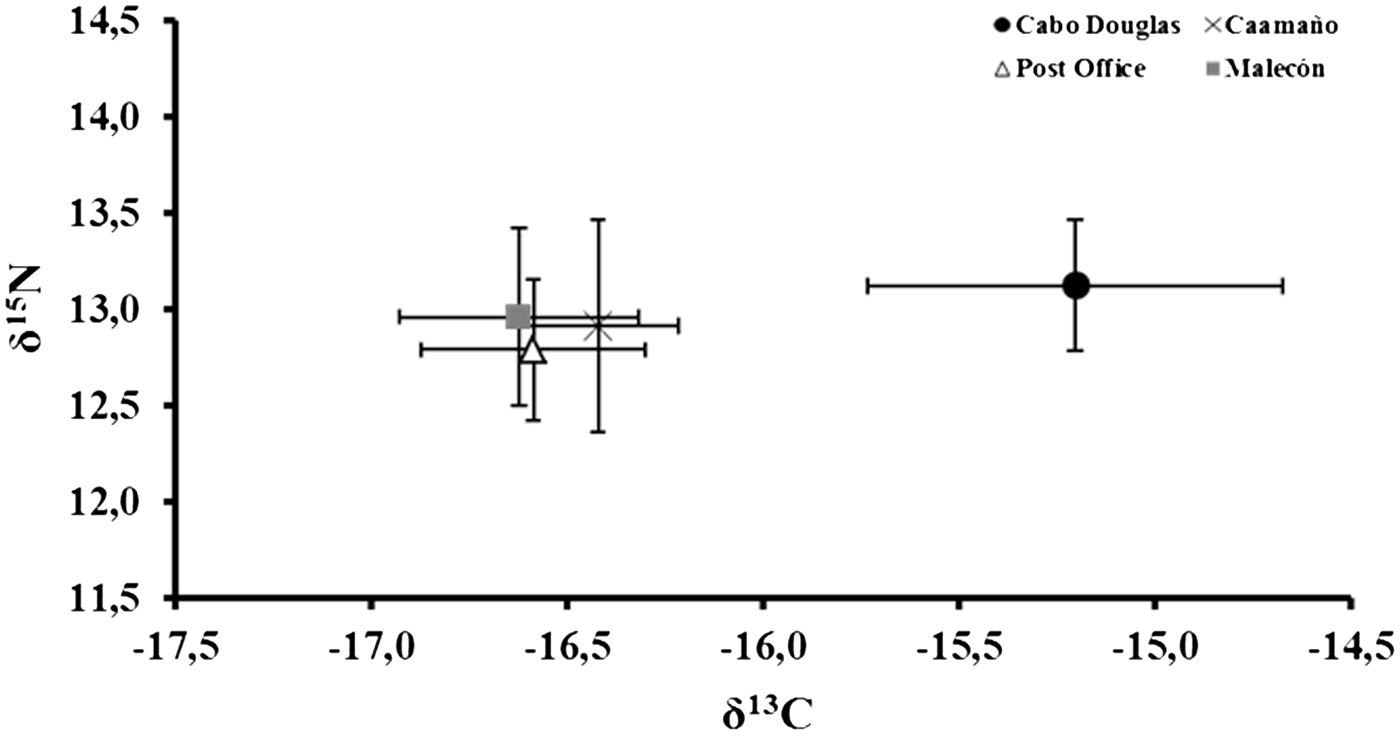
A comparison of δ13C values among the four sea lion rookeries showed significant differences (Kruskal–Wallis: H (3,4) = 46.81, P = 0.001). Cabo Douglas was significantly different from Caamaño, Post Office and Malecón (all Fisher's LSD: P < 0.05) (Figure 4 and Table 3). The δ15N signal showed a similar trend to the δ13C values, however the differences between the four rookeries were not significant (Kruskal–Wallis: H (3,4) = 6.64, P = 0.084) (Figure 4 and Table 3).

Fig. 4. δ13C and δ15N values (mean ±SD (‰)) from fur samples of Galapagos sea lion pups collected in different rookeries of the archipelago in March 2009.
Table 3. δ13C and δ15N values (mean ±SD (‰)) from fur samples of Galapagos sea lion pups collected in different rookeries of the Galapagos Islands during March 2009.

DISCUSSION
Spatial variation of the foraging habits of Zalophus wollebaeki
The observed spatial differences in the diet of the Galapagos sea lion suggests the presence of specific foraging areas with distinct prey components for each rookery where all trophic spectra were represented by a limited group of prey. Cabo Douglas, in the western region, had the greatest diversity of prey species (16), which may have been related to bathymetric conditions (deep waters >2000 m) and the prevalence of blooms in this region of the archipelago (Banks, Reference Banks, Danulat and Edgar2002; Palacios et al., Reference Palacios, Bograd, Foley and Schwing2006).
Myctophid fish were the main prey of the western and central rookeries of the archipelago (Cabo Douglas and Caamaño, respectively). Myctophids typically migrate from deep waters (300–1200 m), which inhabit during the day, to shallower waters (10–100 m) at night (Nelson, Reference Nelson2006). The broad distribution and abundance of these species makes them one of the main preys of various marine predators (Dellinger & Trillmich, Reference Dellinger and Trillmich1999; Osman et al., Reference Osman, Hucke-Gaete, Moreno and Torres2004). However, the complementary preys were different for each site. The second most important prey at Cabo Douglas was the Mueller's pearlside fish (Maurolicus muelleri), which is a member of the Sternoptychidae family show similar dial migration as the myctophids (Grove & Lavenberg, Reference Grove and Lavenberg1997). The spotted cusk-eel (Chilara taylori) was the most important prey at Caamaño; it is a benthic fish which makes burrows in the sand and requires soft bottom substrates (Grove & Lavenberg, Reference Grove and Lavenberg1997).
The ecological characteristics of the main prey from the southern and eastern rookeries (Post Office and Malecón, respectively) contrast with those of the two above-mentioned regions. The main prey at Post Office was the threadfin bass (Pronotogrammus multifaciatus), and at Malecón the sand bass (Paralabrax sp). Both species are demersal and tend to prefer rocky substrates near the coast (Grove & Lavenberg, Reference Grove and Lavenberg1997). Similar to the western and central rookeries, the complementary prey distinguished the diet from these sites. The second most important prey at Post Office was the mottled scorpionfish (Pontinus clemensi), a demersal species that forms dispersed diurnal and nocturnal shoals, mainly among rocks (Grove & Lavenberg, Reference Grove and Lavenberg1997); also the Galapagos thread herring (Ophistonema berlangai) was the second most important prey at Malecón, an epipelagic clupeid that tends to form both small and large shoals close to the coast (Canales et al., Reference Canales, Saavedra, Böhm and Martínez2003).
Our results concur with those of other authors, such as Dellinger & Trillmich, (Reference Dellinger and Trillmich1999) who stated that the diet of Z. wollebaeki in the western rookeries is comprised of sardines (epi-pelagic prey), complemented with some other species such as myctophids (meso-pelagic prey). Our results were also consistent with those of Salazar, (Reference Salazar2005), who identified the diet preferences of Galapagos sea lions at distinct rookeries, noting that the central rookeries consumed mainly fish of the families Myctophidae, Clupeidae and Ophidiidae (meso, epi-peleagic and benthic preys), while the southern and eastern rookeries feed on fish from the Serranidae and Clupeidae families, such as threadfin bass, sand bass and Galapagos thread herring (benthic and epi-pelagic prey).
Among other features, the topography of each region of the archipelago seems to influence the foraging preferences of sea lions. For example, the Cabo Douglas rookery (western region) on Fernandina Island, where the continental shelf is shortest and is surrounded by very deep waters (>2000 m) (Banks, Reference Banks, Danulat and Edgar2002), presented the greatest affinity for prey from mesopelagic environments. Conversely, in the rookeries of Post Office (southern region) and Malecón (eastern region) on Floreana and San Cristóbal islands respectively, there is a continental shelf that is shallower than in other parts of the archipelago (~600 m) (Banks, Reference Banks, Danulat and Edgar2002), which allows the sea lions to explore diverse environments and consume demersal and benthic fish.
Trophic overlap
The scat analysis revealed a low trophic overlap between the rookeries, which was expected between Cabo Douglas (western region) and Malecón (eastern region) due to the large distance separating them (237 km). However, these differences were maintained even among the closer rookeries, such as Caamaño (central region) and Post Office (southern region) separated by ca51 km.
Some studies suggest that the Galapagos sea lion may perform foraging trips of approximately 46 km (average) (Kooyman & Trillmich, Reference Kooyman, Trillmich, Gentry and Kooyman1986, Villegas-Amtmann et al., Reference Villegas-Amtmann, Costa, Tremblay, Aurioles-Gamboa and Salazar2008, Páez-Rosas, Reference Páez-Rosas2011), so it would be expected that individuals of Caamaño could forage in the same areas as the individuals from the rookeries of Post Office and Malecón, leading to a potential trophic overlap. Nonetheless, there is evidence of specialized trophic behaviour in Z. wollebaeki (Villegas-Amtmann et al., Reference Villegas-Amtmann, Costa, Tremblay, Aurioles-Gamboa and Salazar2008; Páez-Rosas & Aurioles-Gamboa, Reference Páez-Rosas and Aurioles-Gamboa2010), which may influence the trophic differences observed between Caamaño and the rookeries of Post Office and Malecón.
Spatial isotopic variation
Many factors, such as dietary composition, habitat and oceanographic conditions of the ecosystem, affect the isotopic signal of marine predators (Sigman et al., Reference Sigman, Granger, DiFiore, Lehmann, Ho, Cane and van Geen2005; Newsome et al., Reference Newsome, Clementz and Koch2010). The δ13C values from Galapagos sea lions in our study indicate the existence of spatial differences in the sea lion diet around the archipelago, mainly between the western region and the rest of the islands. These findings convey a spatial variation regarding the foraging habitats exploited by the individuals of each region (Hobson et al., Reference Hobson, Schell, Renouf and Noseworthy1996; Newsome et al., Reference Newsome, Martinez del Rio, Bearhop and Phillips2007).
According to the δ13C values determined for each rookery, we can infer that sea lions from Cabo Douglas (western region), direct their foraging trips toward coastal environments (13C enriched carbon isotope values), unlike sea lions of Caamaño, Post Office and Malecón which feed in oceanic areas (lower 13C values) (Hobson et al., Reference Hobson, Schell, Renouf and Noseworthy1996; Newsome et al., Reference Newsome, Martinez del Rio, Bearhop and Phillips2007). However, a discrepancy occurs upon relating these results with the composition of the diet. Although the main prey species that comprise the diet of Cabo Douglas (Myctophidae and Clupeidae families) are solely pelagic, the principal prey speciess observed in the rest of the rookeries were benthic species (Serranidae and Scorpenidae families). This finding suggests that the carbon isotopic differences between the rookeries do not result from the diet, but are related to the oceanographic characteristics of each region.
There is some divergence in the equatorial blooms, which are associated with the intensity of the wind and the equatorial sub-stream, causing differences from the equator to the west of the Galapagos Islands (Pak & Zaneveld, Reference Pak and Zanveld1973). Previous studies that monitored the concentrations of chlorophyll-a have suggested that the western region of the archipelago presents an elevated annual production (10–30 mg Chl-a m−3), while the rest of the archipelago has the lowest average production (1–5 mg Chl-a m−3) (Banks, Reference Banks, Danulat and Edgar2002; Palacios et al., Reference Palacios, Bograd, Foley and Schwing2006).
There is an isotopic enrichment in the δ13C values which is produced from the increase in frequency of blooms and the cellular growth rate of phytoplankton (Pancost et al., Reference Pancost, Freeman, Wakeham and Robertson1997; Cullen et al., Reference Cullen, Rosenthal and Falkowski2001). The elevation in the primary productivity levels generates an increase in phytoplankton biomass and, therefore, its respiration capacity, resulting in high CO2 absorption from the aqueous environment. Phytoplankton blooms tend to enrich the 13C signal, even though the high levels of photosynthesis cause a rapid use and decrease of CO2 (enriched in 12C). In this process, there is discrimination towards 13C, and subsequently the δ13C values are enriched in the primary producers and the higher trophic levels (Bidigare et al., Reference Bidigare, Fluegge, Freeman, Hanson, Hayes, Hollander, Jasper, King, Laws, Milder, Millero, Pancost, Popp, Steinbergand and Wakeham1997, Schell et al., Reference Schell, Barnett and Vinette1998).
Significant spatial differences were not observed in the δ15N values, which can be explained in three ways: (a) the sea lions of distinct regions consume the same variety of prey species, but in different proportions, resulting in similar δ15N average values (Bearhop et al., Reference Bearhop, Colin, Adams, Fuller and Macleod2004; Newsome et al., Reference Newsome, Clementz and Koch2010); (b) the sea lions of these rookeries feed on different prey, but of a similar trophic level (Vander-Zanden & Rasmussen, Reference Vander-Zanden and Rasmussen1999; Post, Reference Post2002); and (c) the sea lions of distinct regions feed in different trophic levels, but these differences are not apparent due to the variability in the isotopic baseline (due to different oceanographic conditions and productivity levels) present in each food web (Aurioles-Gamboa et al., Reference Aurioles-Gamboa, Newsome, Salazar-Pico and Koch2009).
Nonetheless, at least two different isotopic areas have been reported in the Galapagos Islands (Aurioles-Gamboa et al., Reference Aurioles-Gamboa, Newsome, Salazar-Pico and Koch2009). The first area is located to the west of the archipelago, and the second area is in the southern region. These differences can be associated with topographic characteristics and distinct productivity levels occurring in each area. Our results follow the trend proposed by Aurioles-Gamboa et al., (Reference Aurioles-Gamboa, Newsome, Salazar-Pico and Koch2009): the Cabo Douglas (western region) and Post Office (southern region) rookeries have higher and lower δ15N values, respectively.
Isotopic differences occur between zones with contrasting oceanographic and topographic characteristics. The majority of deep ocean areas (>2 km) are homogenous in terms of nitrogen sources (nitrates), where the δ15N values are relatively high (approximately 5‰) compared to the shallower areas, where the primary source is the atmospheric nitrogen (N2), which presents lower δ15N values (~−2–0‰) (Sigman et al., Reference Sigman, Granger, DiFiore, Lehmann, Ho, Cane and van Geen2005). These factors could be associated with the conditions in the archipelago, where there are spatial differences in levels of upwelling present in the deep zones and in the continental shelf. The western region has the highest productivity and the deepest waters (>2 km) (conditions which generate higher values 15N) compared to the rest of the archipelago (~700 m) (lower values 15N because the main contribution is atmospheric nitrogen), which could influence biological nitrogen fixation and the denitrification processes of these regions.
The results of this work contribute to our understanding of how a vulnerable species has facilitated its survival by developing foraging strategies that diminish competition in the face of an environment with strong fluctuations in productivity.
ACKNOWLEDGEMENTS
We acknowledge the logistical support of Project SIP-2013-0363. Thanks to the Dirección del Parque Nacional Galápagos (DPNG) for the research permits and for help provided during the sampling logistic.
FINANCIAL SUPPORT
We acknowledge the financial support received from the Prometeo Project of Secretaría Nacional de Ciencia, Tecnología e Innovación (SENESCYT, Ecuador); the Consejo Nacional de Ciencia y Tecnología (CONACyT, México); and the Instituto Politécnico Nacional of México.


