


1. Introduction
According to the 2019 Social Security Trustees Report, Social Security's Old-Age and Survivors Insurance (OASI) Trust Fund is projected to run out in 2034. The gap between the program's income and costs can be closed by decreasing benefits, increasing revenue, or some combination of both. By definition, the burden of decreased benefits falls on Social Security's beneficiaries. But, revenue increases could be structured in ways that fall only on program participants – through the payroll tax – or more broadly, e.g., through the income tax. Therefore, if policymakers want to consider raising program revenues as part of a package to improve Social Security's finances, then they face a choice as to how to do it – concentrated on program participants only or spread across the economy. Understanding why Social Security requires a higher payroll tax to provide a given level of benefits than a funded program is a crucial first step in informing this discussion.
This paper will show that the current ‘pay-as-you-go’ approach is the result of policy decisions made decades ago that led to benefits far in excess of total lifetime contributions for early cohorts of workers. Due to this decision, the nation essentially gave away the Trust Fund that would have accumulated and, importantly, the interest on those contributions. This paper addresses the size and implications of this ‘Missing Trust Fund’ to inform discussions around raising program revenue. Throughout the paper, the discussion is limited to the implications of the Missing Trust Fund on the funding of the Social Security program itself. This focus means that the paper ignores the effect on the real capital stock of having a pay-as-you-go retirement system, and more broadly on the macroeconomy.Footnote 1
The contribution of this paper is two-fold. The first contribution is to quantify the ‘Missing Trust Fund’ and break it down into two portions: (1) the portion due to early beneficiaries who contributed little to the program – the so-called ‘Legacy Debt’ – and (2) the portion due to those who contributed for their whole careers but received more in benefits. This paper is not the first to quantify the Legacy Debt. However, these papers are either dated (Leimer, Reference Leimer1994; Geanakoplos et al., Reference Geanakoplos, Mitchell, Zeldes, Arnold, Graetz and Munnell1998, Reference Geanakoplos, Mitchell, Zeldes, Mitchell, Myers and Young1999, Reference Geanakoplos, Mitchell and Zeldes2000; Diamond and Orszag, Reference Diamond and Orszag2005; Leimer, Reference Leimer2007), or rely on somewhat outdated data (Leimer, Reference Leimer2016). Because the Trustees Report does not contain estimates of the Legacy Debt, this update offers a valuable way to inform discussions of improving program finances. The second contribution of the paper is to discuss how various methods of putting the program on firm financial footing reflect the realities of the Missing Trust Fund and the Legacy Debt and to quantify the distributional effects.
The discussion proceeds as follows. The first section reviews the literature and history of the Missing Trust Fund and discusses how it relates to the concept of Legacy Debt. The second section provides estimates of both the Missing Trust Fund and the Legacy Debt that can be easily updated each time the Social Security Trustees Report comes out. The third section lays out alternative paths forward – namely, either putting Social Security on firm financial footing by increasing taxes permanently but maintaining a balanced pay-as-you-go system or increasing taxes by a higher amount temporarily to get to a fully funded system with lower long-term costs. This section also discusses three alternatives for raising taxes – increasing the payroll tax rate alone; increasing the payroll tax rate along with eliminating the payroll tax cap; or increasing the income tax. The fourth section explores the distributional and welfare implications of the various approaches. The final section concludes that the distributional impacts and political implications of using the income tax to cover the ‘missing interest’ merit society-wide discussion, since the need for future beneficiaries to contribute more to the program is the result of past decisions that benefitted the whole of society.
2. The origins and nature of the Missing Trust Fund
In general, Social Security has existed without a sizable Trust Fund. The primary reason goes back to decisions made early in the program's history. In particular, three decisions are worth noting.Footnote 2 The first decision relates to the benefit formula. Under the 1935 Social Security Act, benefits were based on cumulative covered earnings. Under such a design, early program participants would have been guaranteed only a very small payment from Social Security, since most of their earnings would have taken place before its existence. However, this benefit formula never became operational, because the 1939 Amendments made benefits based on average earnings before any actual payouts. This change meant that people working only a few years under the program could get much larger benefits, well in excess of what they paid in. Under a cumulative benefit formula, the Trust Fund likely would have been built up by the contributions from the first group of full-career participant, while early participants collected only small benefits.
The second decision that inhibited the buildup of the Trust Fund was that the 1939 Amendments also created dependent and survivor benefits. The original law only provided a benefit to the retired worker.
The third decision was a pushback of originally scheduled payroll tax increases. Under the original law, payroll taxes were supposed to be 6% of payroll by 1950 – instead, they were just 3% in that year. Indeed, even 6% would likely have not been high enough, since contemporaneous estimates in 1939 suggested that a payroll tax of 6.6% was required to keep the program in balance.Footnote 3 In any case, the combination of these three decisions prevented the buildup of a large Trust Fund. In fact, the prevention of such a buildup was one of the goals of these decisions. Some lawmakers feared that the government would not truly ‘save’ the money, and would instead use it to finance other government programs.Footnote 4
Whatever the motivation, the beneficiaries received more than they put into the program and this ‘excess’ amount (which includes interest) is often referred to as the Legacy Debt.Footnote 5 The size of the Legacy Debt varies based on the birth cohorts used in the calculation – for example, Leimer (Reference Leimer2016) estimates a Legacy Debt of $24.4 trillion as of 2014 for birth cohorts born through 1931 and $20.9 trillion for those born through 1949. The lower number through 1949 reflects the fact that cohorts born between 1932 and 1949 are expected to make positive net transfers to the program under current law. Estimates of the Legacy Debt also change with time as the interest that would have accrued on the early cohorts' contributions to the Trust Fund grows. For example, Leimer (Reference Leimer2007) found lower Legacy Debt estimates of $13.0 and $11.2 trillion through the 1931 and 1949 birth cohorts respectively, as of 2001; and the only difference between his 2007 and 2016 estimates is the accumulated interest.Footnote 6
However, a Trust Fund has existed in the more recent history of the program, in the decades since the passage of the Social Security Amendments of 1983. At the time of their passage, these amendments were designed to address an immediate shortfall in the program – they were passed in April 1983 and revenue would have been unable to cover benefits as soon as July 1983. Among other changes, the amendments accelerated a scheduled increase in the Social Security payroll tax and reduced future benefits through increases in the Full Retirement Age.
In the decades following these changes, income from payroll taxes exceeded the costs of the program – including for the 1932–1949 birth cohorts mentioned above – and a modest Trust Fund was accumulated. This reserve is available if income (including interest from the growing Trust Fund) falls short of costs. According to the 2019 Trustees Report, this point was expected to be reached in 2020, which means that the accumulated Trust Fund will begin to be drawn down to allow the payment of full benefits. In 2034, the Trust Fund is estimated to be depleted and the pay-as-you-go nature of the program will take over. Given the current payroll tax, the money coming into the program will not be enough to pay out full benefits, requiring an across-the-board reduction in benefits absent any policy changes. In any case, the Trust Fund that built up in the wake of the 1983 amendments was still much smaller than would have existed without early program decisions – a large portion of it was still missing.
So, how to measure the Missing Trust Fund? One implication of the above discussion is that the Legacy Debt is not identical to the Missing Trust Fund, because later birth cohorts can replace some of that missing fund if they contribute more into the program than they are projected to receive (as did those born between 1932 and 1949). Or, they can add to the deficit. A concept that reflects these later additions or subtractions is the ‘Closed Group Unfunded Obligation,’ calculated each year by Social Security's Office of the Chief Actuary.Footnote 7
The Closed Group Unfunded Obligation equals the difference between the present value of projected program costs and the present value of projected contributions for all current participants minus the size of the existing Trust Fund. In other words, the Closed Group Unfunded Obligation is calculated in the same way as the Legacy Debt, but simply includes any birth cohort with individuals still under age 116 (the maximum age of life Social Security assumes) and over age 15.Footnote 8 The Closed Group Unfunded Obligation is our measure of the Missing Trust Fund, since it reflects the money that would need to be transferred to the Trust Fund to offset the entirety of the Legacy Debt plus (or minus) the amounts for any subsequent birth cohorts where the present value of benefits paid exceeded (or fell short of) that cohort's contributions.Footnote 9
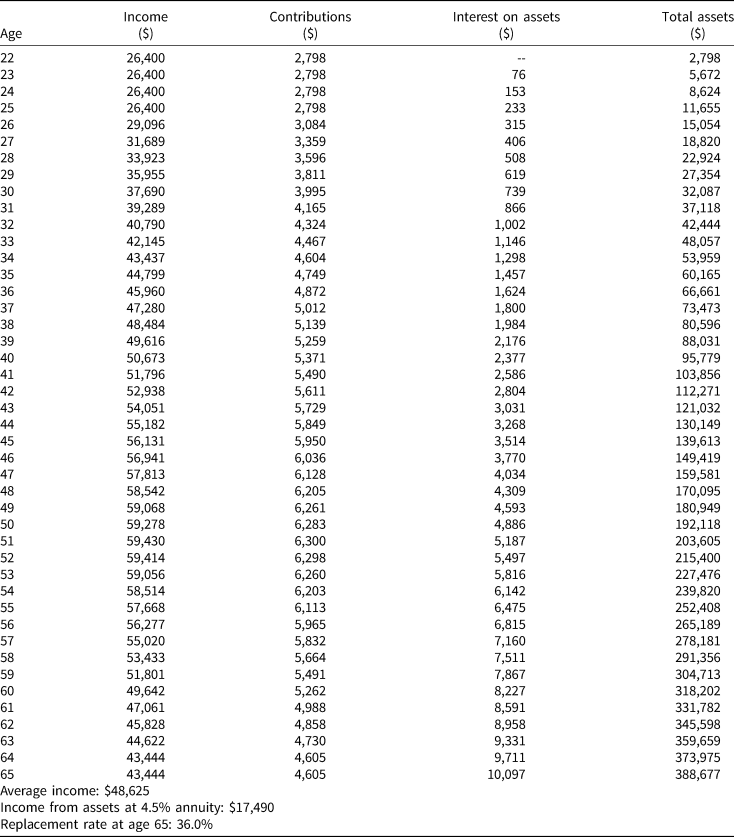
The simplest way to see the implications of Social Security's Missing Trust Fund is to consider the contribution rate required to finance Social Security retirement benefits under a funded retirement plan compared to a pay-as-you-go system (this paper excludes discussion of Disability Insurance (DI)). Under a stylized model of a funded retirement system, with the Social Security Trustees' intermediate assumptions on mortality and on the real interest rate (2.5%), to achieve a replacement rate of approximately 36% (the projected Social Security replacement rate for the average earner claiming at age 65 once the Full Retirement Age equals age 67), the typical worker would have to contribute about 10.6% of earnings.Footnote 10 Under a pay-as-you go system with a projected ratio of about two workers for each retiree and annual real wage growth of 1.2%, a 36% replacement rate would require a contribution rate of roughly 14%.Footnote 11 The resulting difference in the required payroll tax in these two stylized models is due to the presence of assets that can pay interest in a fully funded system, but that is ‘missing’ in the current system.
3. Creating an easily updated tool for the Legacy Debt and the Missing Trust Fund
The two components of the Missing Trust Fund – the Legacy Debt and the net transfers by more recent cohorts – can be linked through a ‘tool’ to illustrate the role that the Legacy Debt plays in today's Missing Trust Fund. The output of this tool can be easily updated each time a Social Security Trustees Report is released and can serve as the basis for a discussion of various approaches for improving Social Security's finances with a clear view of the financial shortfall's origin.
For each birth cohort, the tool requires two values: (1) the net present value of the cohort's contributions to Social Security through the payroll tax; and (2) the net present value of the cohort's Social Security benefits. Social Security provides projections of both contributions and benefits paid, but it does not provide these data by birth cohort. Cohort data could be calculated with individual data on earnings and benefits paid, but that information is difficult to access and thus hard to use to update calculations regularly. Furthermore, even if the actual individual-level data were available, estimates of any Missing Trust Fund will change each year as the projected contributions and benefits of today's participants are updated. Given these difficulties, the sections below discuss how these quantities can be calculated from readily available data and projections.
3.1 Net present value of contributions
To calculate the net present value of a birth cohort's contributions, the starting point is Social Security's historical data and projections for payroll contributions.Footnote 12 The next step is to divide these contributions up among the relevant birth cohorts. This task is accomplished by using data on annual taxable earnings from the Current Population Survey (CPS) and calculating the share of total earnings in the sample due to individuals from each birth cohort. For example, in 1980, taxable payroll contributions to OASI were just over $103 billion. If in the 1980 CPS, 25-year-olds represented 2% of taxable payroll, then the 1955 birth cohort (1980 – 25) would be assigned contributions of $2.1 billion ($103.0 × 0.02). In this way, each birth cohort is assigned its estimated share of total contributions. For future contributions, the share of payroll coming from each age is held constant at the 2019 level with the level of payroll based on Social Security's projections. Figure 1 shows the estimated present value of payroll contributions by birth cohort.Footnote 13 Lifetime contributions were low for early program participants before ramping up for birth cohorts that spent the entirety of their working lives contributing.

Figure 1. Present value of payroll tax contributions by birth cohort under current law, 2019 dollars.
Source: 2019 Social Security Trustees Report; and authors' calculations.
3.2 Net present value of benefits
Calculating the net present value of benefits for a given cohort is slightly more complicated. Once again, the starting point is Social Security's historical data on benefits and its projections. The benefits of any one birth cohort are based on the aggregate difference in benefits paid from 1 year to the next.Footnote 14 If no new cohort entered the program, then the benefits paid would grow (or shrink) based on the original cohorts' cost-of-living adjustments and rate of mortality.Footnote 15 Any upward departure from this calculated trend would reflect the new benefits being paid to the entering birth cohort.Footnote 16 The next year, this process can be repeated for the next entering cohort. This iterative process requires a starting point where the contributions of a given birth cohort are known with certainty. For this starting point, we use the 1901 birth cohort for which Leimer (Reference Leimer2007) had individual-level data. Figure 2 shows the estimated present value of benefits received by birth cohort.Footnote 17

Figure 2. Present value of benefits by birth cohorts under current law, 2019 dollars.
Source: 2019 Social Security Trustees Report; and authors' calculations.
3.3 The current size and composition of the Missing Trust Fund
The discussion above makes clear that the data contained in Figures 1 and 2 can be differenced to calculate the net transfer for any given birth cohort. For example, the 1910 birth cohort made lifetime contributions with a net present value of about $196 billion (in 2019 dollars) but received benefits of about $1,200 billion. The result is a net transfer of about $1,004 billion.
In turn, these net transfers can be added together to get estimates of the Legacy Debt Component of the Missing Trust Fund or of the Missing Trust Fund in its totality.Footnote 18 Figure 3 shows the net transfer (benefits minus contributions) for each birth cohort between 1901 and 2004 (the last birth cohort included in the closed group), as well as the cumulative sum of all of these net transfers.Footnote 19 The figure clearly illustrates that early birth cohorts received large positive transfers and that birth cohorts affected most by the 1983 Amendments are projected to receive negative net transfers, even under current law. For more recent birth cohorts, it is hard to read too much into the net transfers, since current revenues are inadequate to pay promised benefits over the next 75 years.

Figure 3. Net transfer and cumulative net transfer under current law by birth cohort, 2019 dollars.
Note: ‘Cumulative net transfer’ includes $9.8 trillion to pre-1901 birth cohorts.
Source: 2019 Social Security Trustees Report; and authors' calculations.
The major point is that, under current law, although more recent birth cohorts have tended to have negative or zero net transfers, these transfers have only offset a small portion of the Legacy Debt. By this paper's estimates, the Legacy Debt through 1934 for the OASI program stands at $32.4 trillion.Footnote 20 The net negative transfer experienced by the 1935–2004 birth cohorts under current law was just $2.9 trillion, leading to a Closed Group Unfunded Obligation of $29.5 trillion for the OASI program ($32.4 trillion−2.9 trillion). In other words, more than the entirety of the Missing Trust Fund is due to the ‘Legacy Debt.’Footnote 21
Before continuing, it is worth tying the concepts of Legacy Debt and the Missing Trust Fund reported here to the $43.2 trillion infinite-horizon financing gap reported in the 2019 Trustees Report. This $43.2 trillion differs from the $29.5 trillion Missing Trust Fund in two ways. First, it includes the DI portion of Social Security, whereas our estimates include only OASI. Second, and more importantly, it represents the infinite-horizon open-group unfunded obligation, which includes the balance of past and future net transfers. Unlike the closed-group, the open-group unfunded obligation includes birth cohorts yet to enter the program. Adding the future cohorts of participants increases the unfunded obligation, as these participants are projected to receive more in benefits than they contribute to the program, mostly because they are scheduled to live longer than current workers. Thus, the $43.2 trillion is higher than the closed-group unfunded liability, or as we label it, the Missing Trust Fund of $29.5 trillion.
In any case, this Missing Trust Fund makes the program more costly than it otherwise would be, as current participants are forced to contribute towards both benefits and the missing interest. How much it would cost to deal with this Missing Trust Fund is the subject of the next section.
4. Dealing with the Missing Trust Fund
Broadly, two ways exist to increase revenues to deal with Social Security's financial shortfall.Footnote 22 The first is simply to replace the missing interest, roughly holding constant the present value of the Missing Trust Fund going forward. To implement this approach, the revenue coming into the program would need to be increased permanently. Under a missing interest approach, future cohorts of participants would receive negative net transfers from the program due to the lack of interest in their own contributions accrue. However, some might argue that a negative transfer is fair because of the various forms of insurance Social Security provides (e.g., wage and longevity), which are not available from other assets people can buy on their own.
An alternative approach would be to increase taxes by a higher amount but only temporarily until a Trust Fund consistent with a fully-funded program is built up. This buildup could be accomplished over a short time horizon with a larger tax increase or over a longer period with a smaller tax increase. In any case, once this Trust Fund is built up, the accrued interest will allow a return to roughly today's level of the payroll tax, which – as discussed earlier – is consistent with a fully funded system given the current level of benefits. Birth cohorts who face the tax increase will receive negative net transfers from the program, but future cohorts will experience a lower-cost program due to the existence of a Trust Fund that generates interest on contributions.
Within these two broad approaches, alternatives exist for implementing the required tax increases. The most obvious way is simply to increase the payroll tax by the required amount, maintaining the 2019 cap of $132,900 (adjusted annually for wage growth). A second approach is to combine a payroll tax increase with an expansion of the tax base by eliminating the payroll tax cap completely. (The calculations below assume that contributions made over the current cap do not generate benefits.) A third approach is to shift some reliance from the payroll tax to the income tax to reflect the fact that the Missing Trust Fund is a function of the policy decision to pay early beneficiaries more than they contributed. One could argue that these additional costs should not be borne solely by program beneficiaries, and could be borne both by individuals who earn their income from their labor as well those who earn it from other sources.
Table 1 shows how large these tax increases would have to be to pay for the missing interest or replace the Missing Trust Fund entirely over a time horizon of 75–150 years. The table makes clear that replacing the Missing Trust Fund requires a larger tax increase than does simply paying the missing interest and that expanding the tax base – either by taxing earnings over the cap or by using the income tax requires a smaller rate increase. For example, the required increase in the capped payroll tax is 3.4 percentage points to pay the missing interest indefinitely and 6.6 percentage points to replace the Missing Trust Fund in 75 years, compared to 2.8 and 5.5 percentage points, respectively, if the cap is eliminated. Expanding the tax base even further and using the income tax lowers these amounts to 2.2 percentage points and 4.3 percentage points, respectively.
Table 1. Required percentage-point increases in taxes to finance Missing Trust Fund

Source: 2019 Social Security Trustees Report; and authors' calculations.
An expansion of the income tax could be viewed as appropriate given that the lack of a sizable Trust Fund today is not due to the failure of today's beneficiaries to pay an appropriate amount for their own benefits. Instead, it results from society's decision in the 1930s. And, aside from the smaller level of taxation required under an income tax approach, the various approaches would affect individuals across the income distribution differently. The next section turns to this issue.
5. The distributional effect of dealing with the Missing Trust Fund
To analyze the distributional effect of various policies to deal with the Missing Trust Fund, this paper uses NBER's TaxSim program in conjunction with the Survey of Consumer Finances (SCF). The TaxSim program calculates tax liabilities from US Federal and State income tax laws.Footnote 23 Researchers can either enter the characteristics (e.g., age, marital status) and income sources (e.g., W-2 wages, interest, dividends) of an individual into an online portal to obtain their estimated tax liability and marginal tax rate, or upload data appropriately formatted from a survey dataset (as this paper does). The TaxSim program is updated each year and attempts to incorporate changes to tax law. Currently, the federal tax law is up to date through 2019 and is updated through 2017 for state tax law. Using TaxSim allows this paper to determine various strategies to pay for the Missing Trust Fund – including raising the income tax in response to the observation of the Missing Trust Fund's origin in the Legacy Debt – are distributed across the population.
For purposes of the analysis, households are divided into quartiles based on their current income and their taxes calculated under the scenarios described above.Footnote 24 Table 2 shows how the incremental taxes paid are distributed by income quartile under the three approaches. The capped payroll tax increase tends to be the most evenly distributed, the uncapped payroll tax next, and the income tax brings in the highest share from the top quartile.
Table 2. Share of tax increases paid, by income quartile under policy alternatives

Source: 2019 Social Security Trustees Report; and authors' calculations using the 2016 SCF and Feenberg and Coutts (‘TaxSim’).
But while the share of taxes paid is uniformly higher for the highest income quartile, the actual burden of the taxes on households' budgets tends to fall more heavily on households further down the economic ladder for the two types of payroll tax increases (see Table 3).Footnote 25 An increase in the payroll tax falls hardest on the working households in the two middle quartiles because most of their income comes from earnings and all of their earnings falls under the payroll tax cap. For workers in the top quartile, the effect of the payroll tax increase is roughly half as large, since much of their income from work lies above the cap and many have sources of income beyond work. The pattern is similar both for paying missing interest and for replacing the Missing Trust Fund.
Table 3. Share of household income used to pay tax increases, by income quartile

Source: 2019 Social Security Trustees Report; and authors' calculations using the 2016 SCF and Feenberg and Coutts (‘TaxSim’).
Expanding the payroll tax by eliminating the cap spreads the burden more equally for working households. The highest quartile is the only group to see an increased share of their household income devoted to the tax increase under this policy compared to the alternative of simply raising the capped payroll tax. By comparison, the income tax shifts more of the burden to the highest quartile. Under an increase in the income tax that would pay for the missing interest, the median household (including those households with and without wage and salary workers) in the top quartile would pay about 1.8% of their income to the payroll tax, the second quartile 0.8%, the third quartile just 0.3%, and the median household in the lowest quartile would pay nothing. Again, the results are proportionately higher for tax increases that would replace the Missing Trust Fund but they follow a similar pattern.
Of course, looking at the reduction in household income is only one way to consider the distributional effects of this kind of policy. Economists generally assume that households are risk averse, with one consequence being that reductions in income are more costly when income is low. A commonly used utility function that captures the notion of risk aversion is:

where c h indicates a household's consumption and γ is the coefficient of relative risk aversion. The higher γ, the more extreme is the lost utility relative to the gain for similar-sized reductions or increases in income.
Tables 4 and 5 show the reduction in household utility across the three tax increases for the commonly used values of γ = 2 and γ = 3, respectively. In either case, the results show the disproportionate effect of a payroll tax increase on the middle two quartiles. Put simply, a payroll tax increase disproportionately burdens households with at least one worker in the bottom three quartiles, particularly when the utility is considered instead of simply income. With an income tax, the effect is moderated greatly for the bottom three quartiles, with the highest quartile paying a larger share of its income than under any of the other tax schemes.
Table 4. Median reduction in utility for tax increases, by income quartile (γ = 2)

Source: 2019 Social Security Trustees Report; and authors' calculations using the 2016 SCF and Feenberg and Coutts (‘TaxSim’).
Table 5. Median reduction in utility for tax increases, by income quartile (γ = 3)

Source: 2019 Social Security Trustees Report; and authors' calculations using the 2016 SCF and Feenberg and Coutts (‘TaxSim’).
5.1 Cohort effects
The analysis above examined a single point in time and showed that replacing the Missing Trust Fund has a higher impact on household budgets than simply paying for the missing interest. Two points that relate to the cost of these tax increases over time also merit consideration. Paying the missing interest requires a smaller increase today but that increase lasts forever while replacing the Missing Trust Fund requires a larger increase today but for a limited period of time. Using the example of a capped payroll tax increase, Figure 4 shows how these two approaches affect the net transfer received by birth cohorts going forward. Paying off the missing interest (see ‘Interest only’ plot) starting today means birth cohorts currently working receive a reduction in their net lifetime transfer related to their remaining time in the workforce (e.g., a 25-year-old gets a bigger reduction than a 55-year-old), with birth cohorts after 2004 experiencing the largest impact because they spend their entire career under the higher payroll tax.Footnote 26

Figure 4. Net transfer under current law and alternative revenue scenarios by birth cohort, 2019 dollars.
Source: 2019 Social Security Trustees Report; and authors' calculations using the Survey of Consumer Finances (SCF), 2016 and Reference Feenberg and CouttsFeenberg and Coutts (‘TaxSim’).
On the other hand, replacing the Missing Trust Fund in 75 years has an immediately larger effect on current workers, with the most substantial effect on birth cohorts born between 2005 and 2030 who spend their entire careers in the higher payroll tax regime. The birth cohort born in 2031 would be working in 2095 at age 64, when taxes can be reduced to 10.6%, with every birth cohort after that spending an increasingly smaller share of their careers in the higher tax regime. Eventually, future cohorts exist in a ‘fully funded’ system where net contributions and transfers are essentially equal.
Another issue worth considering is the cost of waiting until the Trust Fund runs out in 2034. At that time, the Missing Trust Fund is estimated to equal $53.8 trillion, mostly due to the accumulation of interest between now and then, which will require a payroll tax increase of 3.9 percentage points to pay for the missing interest (compared to 3.4 percentage points if enacted today). Figure 4 clearly illustrates that the actual cost of increasing taxes is nuanced – many current cohorts end up paying a reduced amount, but future cohorts have to pay a little bit more. While Tables 2–5 show that the type of tax used has different distributional impacts across different income groups today, Figure 4 shows that the timing and the approach of paying for the Missing Trust Fund also have distributional implications across birth cohorts.
6. Conclusion
This paper shows that the so-called ‘Missing Trust Fund’ is the result of ‘Legacy Debt’ built up during the early years of the Social Security program. These origins suggest that – if the goal were to maintain benefits at current-law levels – policymakers might want to consider a variety of ways to structure a revenue increase, ranging from an increase in the payroll tax without an expansion of its base to a smaller increase in the payroll tax with an expansion of its base, to an increase in the income tax. Taxing the society more widely – through an income tax increase – could make sense given that society as a whole benefited from having a generation of people receive benefits who did not fully contribute to the system. Any of these taxes could be raised permanently by a moderate amount, effectively paying the missing interest from the Missing Trust Fund, or by a larger amount, ultimately replacing the Missing Trust Fund before returning taxes to their current level.
The distributional effect of each policy is clear. Increasing the payroll tax tends to place a disproportionate burden on middle-class working households, whether that burden is measured by reduced household income or by the reduced utility. Getting rid of the payroll tax cap distributes some of that burden onto the top quartile, but the effect on middle-class workers is still fairly substantial. Increasing the income tax, on the other hand, places more of the burden on the top quartile. The distributional impacts of replacing the Missing Trust Fund versus simply paying for its interest also raise the question of intergenerational equity – burdening today's workers for a lower-cost program tomorrow.
But although the distributional effect of each policy is clear, deciding on the ‘right’ approach is well outside the scope of this paper. The political challenges of raising program revenue through either of the sources mentioned – a payroll tax increase or an income tax increase – are obviously very real. Instead, the point of this paper is simply to make clear which types of tax increases and approaches are available and what the distributional effects could be.
Appendix A: Contributions required in fully funded system
Table A1. Income, contributions, and total assets for median worker contributing 10.6% of assets to a funded system
Appendix B: Comparing results from approximation to Leimer (Reference Leimer2007)
One of the primary goals of the calibration method described in the body of this paper is to update estimates of the Missing Trust Fund to reflect the situation today. But the estimates obtained from that method are just that, estimates. Showing that the estimation method presented above results in numbers that closely fit those in Leimer (Reference Leimer2007) – which are based on actual data and then projections – would build confidence in the method. To make this comparison, we use the actual numbers reported in Leimer (Reference Leimer2007) and put the numbers presented in Figures 1 and 2 into 2001 dollars and 2001 present value to be consistent with the time period used in Leimer (Reference Leimer2007). Figures B1 and B2 show the results of this comparison and reveal stark differences. The difference is small for earlier years but becomes larger for birth cohorts that either had not begun making payments into the program when Leimer's data ended (roughly the 1980 birth cohort) or had not begun receiving payments (roughly the 1940 birth cohort).

Figure B1. Present value of payroll tax contributions by birth cohort, 2001 dollars.
Sources: 2019 Social Security Trustees Report; Leimer (Reference Leimer2007); and authors' calculations.

Figure B2. Present value of benefits by birth cohort, 2001 dollars.
Sources: 2019 Social Security Trustees Report; Leimer (Reference Leimer2007); and authors' calculations.
This result suggests the issue may simply be in the projections used in the two approaches – Leimer (Reference Leimer2007) used projections from the 2000 Social Security Trustees Report, and we use projections from the 2019 Social Security Trustees Report. Indeed, Figure B3 suggests this is likely the case, as, after 2000, both the long-run forecasted payroll contributions Social Security was anticipating as well as the benefits it assumed it would have to pay out dropped significantly. If the 2000 Social Security Trustees Report numbers are used and our methodology applied, the Leimer (Reference Leimer2007) estimates and our estimates come into line, as is shown in Figures B4 and B5.

Figure B3. Evolution of projected payroll-tax receipts and benefit payouts by 2075, by trustees report.
Source: 2000–2019 Social Security Trustees Reports.

Figure B4. Present value of payroll tax contributions by birth cohort, 2001 dollars.
Sources: 2000 Social Security Trustees Report; Leimer (Reference Leimer2007); and authors' calculations.

Figure B5. Present value of benefits by birth cohort, 2001 dollars.
Sources: 2000 Social Security Trustees Report; Leimer (Reference Leimer2007); and authors' calculations.
In short, the approximation method used seems to reflect fairly well what one would get using actual data.


