Introduction
The survival of any clade is dependent on the ability of taxa included within it to gather resources necessary for survival. Previous studies on crinoids (Kammer et al. Reference Kammer, Baumiller and Ausich1997, Reference Kammer, Baumiller and Ausich1998), gastropods (Gili and Marinell Reference Gili and Marinell1994), bivalves (Stanley Reference Stanley1986; Jablonski and Hunt Reference Jablonski and Hunt2006), modern fish (Wilson et al. Reference Wilson, Burgess, Cheal, Emslie, Fisher, Miller, Polunin and Sweatman2007), and carnivores (Gray et al. Reference Gray, Burwell and Baker2016) have shown that a more generalist lifestyle can promote greater taxon longevity (Raia et al. Reference Raia, Carotenuto, Mondanaro, Castiglione, Passaro, Saggese, Melchionna, Serio, Alessio, Silvestro and Fortelius2016). Therefore, it is prudent for taxa to expand into new niches to take advantage of multiple resources, and often this requires the adaptation of novel or expanded morphological features (Hellberg et al. Reference Hellberg, Balch and Roy2001; McCormack and Smith Reference McCormack and Smith2008; Bellwood et al. Reference Bellwood, Goatley, Brandl and Bellwood2014). This can be observed in the fossil record as taxa expanding their distribution within morphospace due to an adaptive radiation, often when presented with sufficient ecological opportunity (Losos Reference Losos2010). Morphospace is the mathematical and/or graphical depiction of the morphology of an organism and can be used as a proxy for exploring the occupancy of niches by extinct organisms (Mitteroecker and Huttegger Reference Mitteroecker and Huttegger2009).
Organisms tend to occupy far less morphospace than what is theoretically available (Raup Reference Raup1966). However, the distribution and location of taxa within morphospace can be informative of the evolutionary history and paleoecology of an organism (Ritterbush and Bottjer Reference Ritterbush and Bottjer2012; Huang et al. Reference Huang, Roy and Jablonski2014). For example, morphospace studies of Cambrian organisms have suggested that disparity was similar to modern organisms (Briggs et al. Reference Briggs, Fortey and Willis1992), but may have shifted through time (Willis Reference Willis1998; Löfgren et al. Reference Löfgren, Plotnick and Wagner2003). Furthermore, this pattern of early maximum disparity may have also occurred before the Cambrian radiation during the Ediacaran (Shen et al. Reference Shen, Dong, Xiao and Kowalewski2008). However, these trends are not consistent across all groups of organisms, with blastoids (Foote Reference Foote1992), stylophorans (Lefebvre et al. Reference Lefebvre, Eble, Navarro and David2006), and onychophorans (Yang et al. Reference Yang, Ortega-Hernández, Gerber, Butterfield, Hou, Lan and Zhang2015) as notable exceptions. This body of research is often framed as determining whether organisms reached an early maximum of morphological disparity, and subsequent decimation, or disparity was proportional to taxonomic diversity (Gould Reference Gould1991; Erwin Reference Erwin2007). Here, we investigate the morphological disparity within a different group of taxa, archaeocyathan sponges, to quantify the morphospace occupancy of a common early Cambrian reef builder.
Previous Work
Research on the morphology of sponges can be challenging due to the lack of easily definable characters (i.e., landmarks) and the plastic nature of their modular morphology. For instance, sponges are known to increase spicule density and constrict their central cavity in high-energy environments (Palumbi Reference Palumbi1984, Reference Palumbi1986). Gross morphology of sponges is also influenced by environment, with more fragile branching forms common in lower-energy environments (Bell and Barnes Reference Bell and Barnes2000; Bell et al. Reference Bell, Barnes and Turner2002). But, looking at the fossil record of ancient sponges and their morphological disparity can inform us of the variety of environments in which those organisms existed. Archaeocyathan morphological disparity is particularly important, because archaeocyaths were framework builders, which could have disproportionally affected their surroundings and local biodiversity (Erwin Reference Erwin2008; also see Watkins [Reference Watkins2000] and Hageman and McKinney [Reference Hageman and McKinney2010] for morphological studies on other reef builders). A more restricted or expanded morphological disparity can give us more information about the filling of ecospace during the early (Terreneuvian–Series 2) Cambrian.
Archaeocyaths are preserved as three-dimensional calcitic cups within a rock matrix. Cut or naturally weathered faces expose a two-dimensional cross section of the cup within the matrix. Archaeocyaths within the order Monocyathida have a single wall; however, the vast majority of archaeocyaths have a unique double-walled structure separated by an open cavity, the intervallum. During life, the intervallum was potentially the location of the bulk of soft tissue, but postmortem this cavity appears open. The two walls may be connected by up to several hundred radial-longitudinal septa and transverse tabulae, though either feature may be absent. Where they present, these skeletal elements together form chambers known as loculi. The inner wall encloses a central cavity with a distal osculum. Prior research on archaeocyaths has used a functional morphology approach to show that pore (ostia) density is important in creating strong water channelization and flow direction, much as in other poriferans (Balsam and Vogel Reference Balsam and Vogel1973; Savarese Reference Savarese1992). Additional morphological studies of archaeocyaths related the central cavity size to their paleoenvironments (Savarese Reference Savarese1995) and categorized their cup integration (Wood et al. Reference Wood, Zhuravlev and Debrenne1992). However, little work on archaeocyathan morphology has been performed since, and no extensive studies of archaeocyathan morphology from museum collections have been performed to date. Therefore, we collected measurements from several museum collections and discrete gross morphological characters from databases to amass a large (>1000 specimens) data set of archaeocyathan morphology. We find that archaeocyaths, the primary metazoan reef builders of the early Cambrian, were restricted in their morphological disparity and, therefore, in the paleoenvironments they inhabited.
Materials and Methods
Archaeocyaths are, often, the most common metazoan framework builder in early Cambrian reefs. Additional enigmatic metazoans also occur in some localities. For example, coralomorphs (Hicks Reference Hicks2006), radiocyaths (Kruse et al. Reference Kruse, Gandin, Debrenne and Wood1996), or other sparse calcareous sponges do occur (Reitner et al. Reference Reitner, Langsford and Kruse2017). However, we focus here on archaeocyaths, as few specimens of these other reef builders were available and were comparatively minor in diversity.
Two comparative data sets were assembled to assess the differences between archaeocyathan morphology and other reef-building organisms, the modern demosponges and lithistid sponges. First, modern demosponges contain several examples of calcareous organisms, for example, Vaceletia and Calcifibrospongia, as well as several orders with aspiculate micromorphology, for example, Dictyoceratida, Verongiida, and Dendroceratida, which instead are composed of spongin fibers. Taxonomically, archaeocyaths are suggested to either be closely related to or members of Demospongiae (Debrenne and Zhuravlev Reference Debrenne, Zhuravlev, van Soest, van Kempen and Braekman1994; Rowland Reference Rowland2001). However, demosponges occur in more environments than archaeocyaths, for example, deep marine, which allows for greater innovation of novel morphologies. Thus, a second data set consisting of polyphyletic lithistid demosponges sponges was also assembled. Samples used in this study ranged in age from the Paleozoic (N = 42), Mesozoic (N = 8), Paleogene (N = 5), to modern (N = 38). Lithistid sponges form robust calcifying reefs in both ancient and modern ecosystems. They possess spicules called desmas and typically inhabit tropical to temperate environments alongside demosponges (Schuster et al. Reference Schuster, Erpenbeck, Pisera, Hooper, Bryce, Fromont and Wörteide2015). Therefore, we include data on modern demosponges (here referring to extant non-lithistid varieties), as they are a single taxonomic group that may include Archaeocyatha, and a second data set of lithistid sponges (here referring to fossil and modern heavily calcified demosponges within the polyphyletic group “Lithistida”), as they are the closet ecologically analogous organism to archaeocyaths. Two separate methods of analysis were used as part of this study, one using continuous variables and a second with discrete variables.
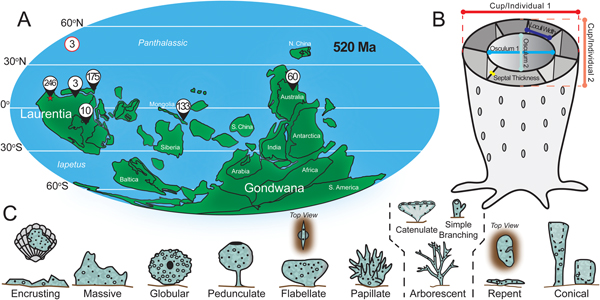
Continuous variables for archaeocyaths were measured on cross sections preserved in rock slabs (N = 1108) from museum collections at the University of California Museum of Paleontology (UCMP), the University of Alaska Museum of the North (UAMES), and the University of Wisconsin–Milwaukee (IESAG) and field samples from the Poleta and Harkless Formations near Lida, Nevada, USA. Museum-based specimens (N = 630) are the primary focus of all analysis except when indicated otherwise and contain samples from three paleocontinents: Laurentia, Gondwana (Australia), and Mongolia (Zhavkhan Terrane) (Fig. 1A). Our data set is heavily biased toward samples from Laurentia (>82%), thus the trends discussed below may be more indicative of archaeocyaths from Laurentia, rather than a global phenomenon. Regardless, our data still represent a major paleocontinent with substantial biodiversity.

Figure 1. Overview of materials and methods. A, Paleogeography of early Cambrian with locality information of museum samples measured for continuous variables (N = 630). Upper left-hand value denotes unknown locality. Field sample locality denoted by star. B, Diagram of archaeocyath annotated with measurements taken for continuous variables. C, Nine morphological categories used in discrete character analysis (based on Bell and Barnes Reference Bell and Barnes2001). Arborescent category includes catenulate and simple branching morphologies. See Boury-Esnault and Rützler (Reference Boury-Esnault and Rützler1997) for definitions of categories and Supplementary Material for synonymized categories.
Measurements of cup/individual diameter (hereafter referred to as body size), osculum diameter (hereafter referred to as osculum size), loculus width, and septal thickness were collected for all museum specimens (Fig. 1B). Only body- and osculum-size measurements were collected for field samples. For all body- and osculum-size measurements, two diameters were measured, one at the point of maximum width and a second perpendicular to the first measurement (Fig. 1B). These two values were averaged to reduce bias due to oblique cross sections. Samples that appeared to be extremely obliquely crosscut or fragmented were excluded. Personal observations of three-dimensionally preserved archaeocyaths suggest that they are not always perfectly circular in cross section, but rather more elliptical. Therefore, we prefer this two-diameter method to simply using either minimum or maximum diameters to characterize body size. Multiple loculus width measurements (average 1.9 per specimen) were collected from the inner wall side when available and averaged. Loculus measurements were taken at various positions around the cup to capture variability of width. Septal thickness was measured at the midpoint between the inner and outer wall. Intervallum area percentage was determined by using equation (1).
 $$\eqalign{{\rm I\% = }&\big[ {\left( {{\rm area \,of \,body - \,area \,of \,osculum}} \right)\, \right}\right \! / \cr & \qquad \hskip 6pt{\rm area \,of \,body} \big]{\rm \times 100}}$$
Data from modern demosponges (N = 71) were collected on museum specimens housed at the Milwaukee Public Museum (MPM) for body size, osculum size, and maximum height following the method used for the archaeocyath data set. Measurements were made using a digital caliper accurate to within 0.01 mm. Lithistid sponge data were collected from the primary literature either from dimensions specified in the text or directly from figures (N = 93; see Supplementary Materials for reference list). Both modern and fossil examples of lithistid sponges were included.
Discrete morphological variables were compiled from database entries. Archaeocyathan gross morphology, cup shape, and elaboration (ridges, spines, troughs, etc.) for all valid genera of archaeocyaths (N = 309) were gathered from the online database Archaeocyatha—A knowledge base (Kerner et al. Reference Kerner, Debrenne, Vignes-Lebbe, Smith and Penev2011). For comparison, all extant, marine taxa of ‘Demospongiae Sollas, 1885’, using the ‘only accepted names’ and ‘all records’ filters, were compiled from the World Porifera Database (N = 6274). Using a random number generator, a random subset of 300 taxa were selected from this list and assessed for gross morphology based on their descriptions in Systema Porifera (Hooper and Van Soest Reference Hooper and Van Soest2002). Lithistid sponge gross morphology was assessed from the same literature survey as the continuous variables. For all data, binary presence or absence coding was performed to determine the percentage of organisms that can display each morphological category as seen in Bell and Barnes (Reference Bell and Barnes2001: Fig. 2; Fig. 1C in the present study).
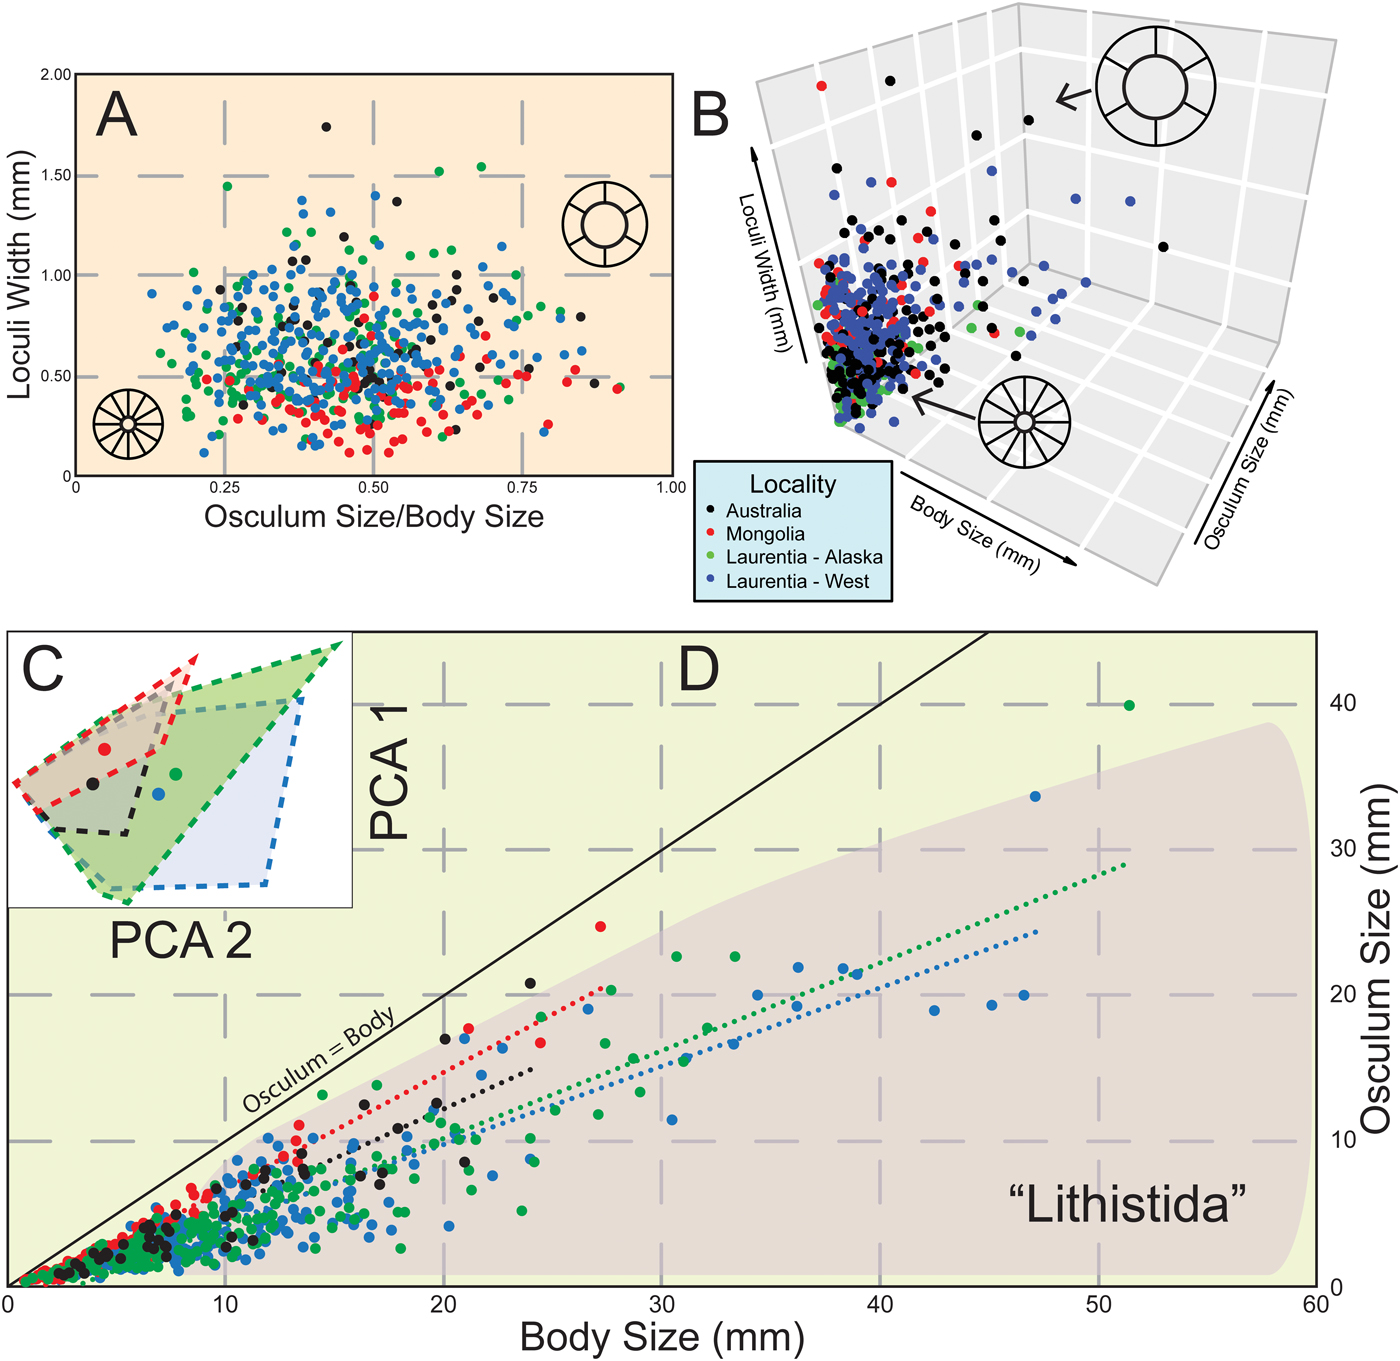
Figure 2. Continuous variable measurements for museum specimens of archaeocyaths. A, Two-dimensional morphospace with colors showing general locality. Color scheme same throughout figure. Readers are directed to the online version of this article for color figures. B, Three-dimensional morphospace with colors showing general locality. C, Principal component analysis of five continuous variables. Convex hulls with centroid centers shown. First axis accounts for 96.3% of variance. D, Body- and osculum-size relationship with linear trend lines for locality. Approximate morphospace distribution of lithistid sponges shown in shaded region. N = 544 for A and B; N = 630 for C and D. Raw data available in the Supplementary Material.
Within the continuous data set, a permutational multivariate analysis of variance (PERMANOVA; 10,000 replicates, Mahalanobis distance) analysis of archaeocyath measurements was performed across locality, taxonomic order, and geologic formation groups. Mann-Whitney U and Levene's tests were performed on logarithmically transformed body size and osculum size for archaeocyaths versus modern demosponges and lithistid sponges to determine differences in size and variance. To quantify the magnitude of difference between our test groups, we used Cohen's d to calculate effect size of two independent means based on equation (2).
 $$\eqalign{d = & \left( {{\rm \,mean \,of \,group \,A - \,mean \,of \,group \,B}} \right) /\cr & \qquad {\rm S}{\rm D}_{{\rm pooled}}}$$
In our analysis, an effect size larger than 0.80 is considered large (Cohen Reference Cohen1992). Coupled with hypothesis testing, Cohen's d provides information not just about the occurrence of a statistical difference, but also about the size of the difference in means. For the discrete data set, a χ2 test was performed on archaeocyathan versus modern demosponge and lithistid sponge gross morphologies. All statistical tests were performed in Past v. 3.14.
Results
Archaeocyathan Morphology
Archaeocyathan body size averaged 10.6 mm and had a right skew with a maximum diameter of 74.0 mm. Osculum size averaged 5.0 mm and had a right skew with a maximum size of 59.5 mm. Loculus width averaged 0.60 mm and septal thickness averaged 0.24 mm. Archaeocyathan cross sections were on average 21.8% intervallum compared with osculum area (Table 1). Nearly all samples were two-dimensional cross sections that did not allow for height measurements, but one three-dimensionally preserved specimen had a height of 22.9 mm, and a second fragmented sample measured more than 110 mm.
Table 1. Size measurements (mm) for all archaeocyaths (museum and field), lithistid sponges, and modern demosponges. The 95% confidence intervals are given in parentheses. *Based on one specimen (UCMP 220889).

In both two-dimensional and three-dimensional morphospace, archaeocyaths tend to cluster near smaller body, osculum, and loculus sizes (Fig. 2A,B). Archaeocyaths from Mongolia appear to have narrower loculi compared with all other localities. However, principal component analysis (PCA) shows there is a substantial amount of overlap (Fig. 2C). Different taxonomic orders do have significantly different body sizes, with the largest being Capsulocyathida (28.8 mm, N = 7), followed by Ajacicyathida (12.8 mm, N = 240), and Archaeocyathida (11.5 mm, N = 383). However, taxonomic groups also appear to have large amounts of morphospace overlap (Supplementary Fig. 1). Osculum size is highly correlated with body size (r = 0.91). Osculum sizes from localities within Laurentia appear to be more similar to one another than to those of specimens from more distant localities (Fig. 2D). Continuous variables measurements failed multivariable tests of normality, therefore, nonparametric permutation tests were required. Archaeocyaths did display differences in centroid means based on locality (PERMANOVA p-value < 0.001), taxonomic order (PERMANOVA p-value < 0.001), and geologic formation (PERMANOVA p-value < 0.001). See Supplementary Figs.1 and 2 and Supplementary Tables 1–3 for pairwise comparisons.
Contrasting Archaeocyaths to Other Sponges
Continuous Variables
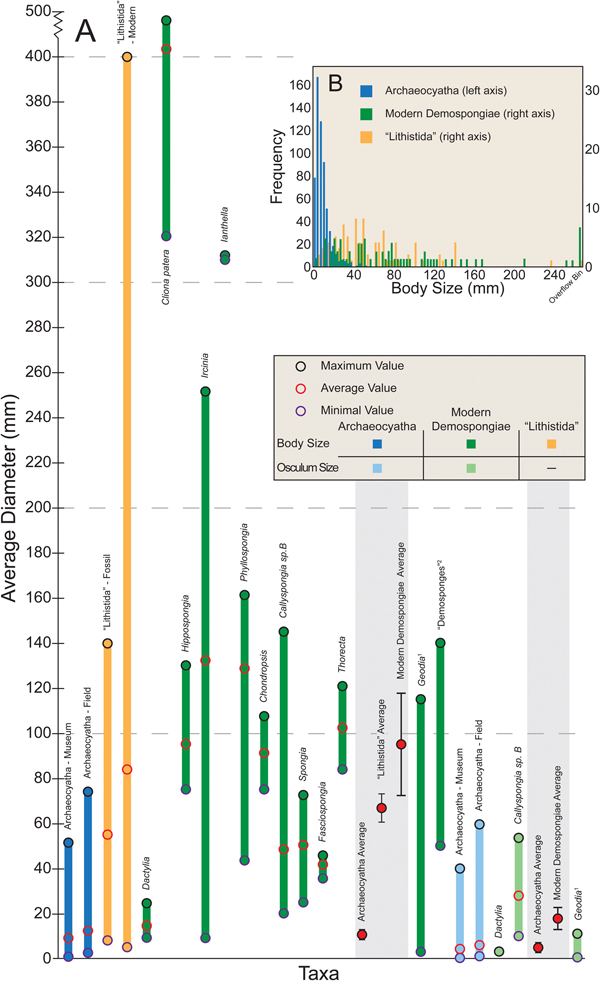
Modern demosponge body sizes measured in this study average 94.1 mm and have a substantially higher maximum value of 490.0 mm, while osculum size averaged 17.8 mm and a maximum value of 53.5 mm. Average height of these organisms is 188.4 mm (Table 1). Some modern demosponges are entirely within the range of archaeocyathan body size (e.g., Dactylia, Spongia, and Fasciospongia), and minimal sizes for many others are also within this range (Fig. 3A). However, the average sizes for most demosponges and nearly all maximum values are above the maximum size for archaeocyaths. Approximately 45% of modern demosponges are larger than the largest archaeocyath (Fig. 3B). On the other hand, osculum sizes are more similar (Fig. 3A). Modern demosponge body size is significantly different (Cohen's d = 2.4, Mann-Whitney U p-value < 0.001) from archaeocyathan body size. Osculum size is also significantly different (Cohen's d = 1.4, Mann-Whitney U p-value < 0.001). Variance between body size (Levene's p-value < 0.001), but not osculum size (Levene's p-value = 0.53), is also significantly different.

Figure 3. Size comparison of archaeocyaths, lithistid sponges, and modern demosponges. A, Range and average diameter sizes for archaeocyaths, lithistid sponges, and modern demosponges. Note break in y-axis. N = 1108 for Archaeocyatha average; N = 93 for “Lithistida” average; N = 71 for modern Demospongiae average. Error bars on averages represent 95% confidence intervals. See Supplementary Material for specimens and measurements. Readers are directed to the online version of this article for color figures. Notes: 1, Barthel and Brandt Reference Barthel and Brandt1995; 2, Ghiold et al. Reference Ghiold, Rountree, Smith, Brunt and Davies1994. B, Histogram of sponge body sizes. Right side truncated. Raw data available in the Supplementary Material.
Lithistid sponge body size averaged 66.8 mm with a maximum value of 400.0 mm. Average height of these organisms was 75.7 mm. Similar to modern demosponges, minimum body size was within the range of variability of archaeocyaths, but 94.6% of lithistid sponges were larger than the average archaeocyath, and 26.8% were larger than the largest archaeocyath. Both body size (Cohen's d = 2.3, Mann-Whitney U p-value << 0.001) and body variance (Levene's p-value = 0.022) were significantly different between archaeocyaths and lithistid sponges.
As a check on our methodology, all comparisons were repeated using only minimum diameter measurements for body size and osculum sizes. All comparisons of mean body and osculum sizes using Mann-Whitney U-tests show significantly smaller sizes of archaeocyathan minimum diameters in comparison to either modern demosponges or lithistid sponges. Variances in minimum body and osculum sizes were also significantly smaller in archaeocyaths compared with either group based on Levene's test. In summation, all results presented above were reproduced using only minimum diameters with the exception of osculum variance, which was found to be significantly smaller in archaeocyaths compared with modern demosponges at α = 0.05, but not at α = 0.01 (see Supplementary Table 4).
Discrete Variables
Our random sampling of demosponge gross morphologies has a similar distribution to those observed directly in field studies, with the most common morphology being encrusting (Fig. 4A). By comparison, most archaeocyaths display simple branching morphology. Lithistid sponges, on the other hand, most commonly display a conical or globular gross morphology, but still occupy many of the other categories in comparison with archaeocyaths. The distribution of morphologies between archaeocyaths and either modern demosponges or lithistids is significantly different (effect size = 0.7 and 1.4, respectively, χ2 p-value < 0.001 for both comparisons). Furthermore, archaeocyaths are extremely uniform beyond gross morphology, as 95% have simple cylindrical-conical cup shapes (Fig. 4B) and 92% have no external elaboration (Fig. 4C).

Figure 4. Discrete character distribution for archaeocyaths, lithistid sponges, and modern demosponges. A, Percent of taxa that display each morphological category. Some species display more than one morphology, hence values will not add to 100%. Numbers above bars indicate absolute number of taxa in each category, while height of bars indicates percentage. Atypical archaeocyath gross morphology shown in dashed boxes. Readers are directed to the online version of this article for color figures. Note1, Demosponges from field measured in Bell and Barnes (Reference Bell and Barnes2001). B, Circle graph of archaeocyath cup shape. C, Circle graph of archaeocyath elaboration. Raw data available in the Supplementary Material.
Discussion
Morphological Disparity within Archaeocyatha
Archaeocyaths displayed a narrow range of continuous character variation, but there were differences between localities (Fig. 2). For example, archaeocyaths from Laurentia tend to have larger loculi and smaller oscula compared with archaeocyaths from Mongolia (Fig. 5A–E). Archaeocyaths from different parts of Laurentia were more similar to one another than to archaeocyaths from more distant locations, especially in terms of osculum size (Fig. 2C,D). PCA plots also show similar results, with the center of convex hulls shifted right for Laurentian archaeocyaths compared with archaeocyaths from Mongolia and Australia (Fig. 2C). PERMANOVA results support these visual assessments by finding significant differences in centroid means across the different localities. However, it would be difficult to assign a specific morphotype to any particular locality. There is a large amount of overlap in occupied morphospace in both two-dimensional and ordination-based morphospaces (Fig. 2A,C). Archaeocyaths with small body sizes appear to be restricted in the amount of variability they possess. Small organisms can only have small oscula and loculi as a result. Therefore, smaller archaeocyaths converge on one section of morphospace. It is possible that only larger, and most likely older, organisms had adapted to local environmental conditions. Even with larger specimens, there is no definitive separation between morphospace occupancy of different localities.
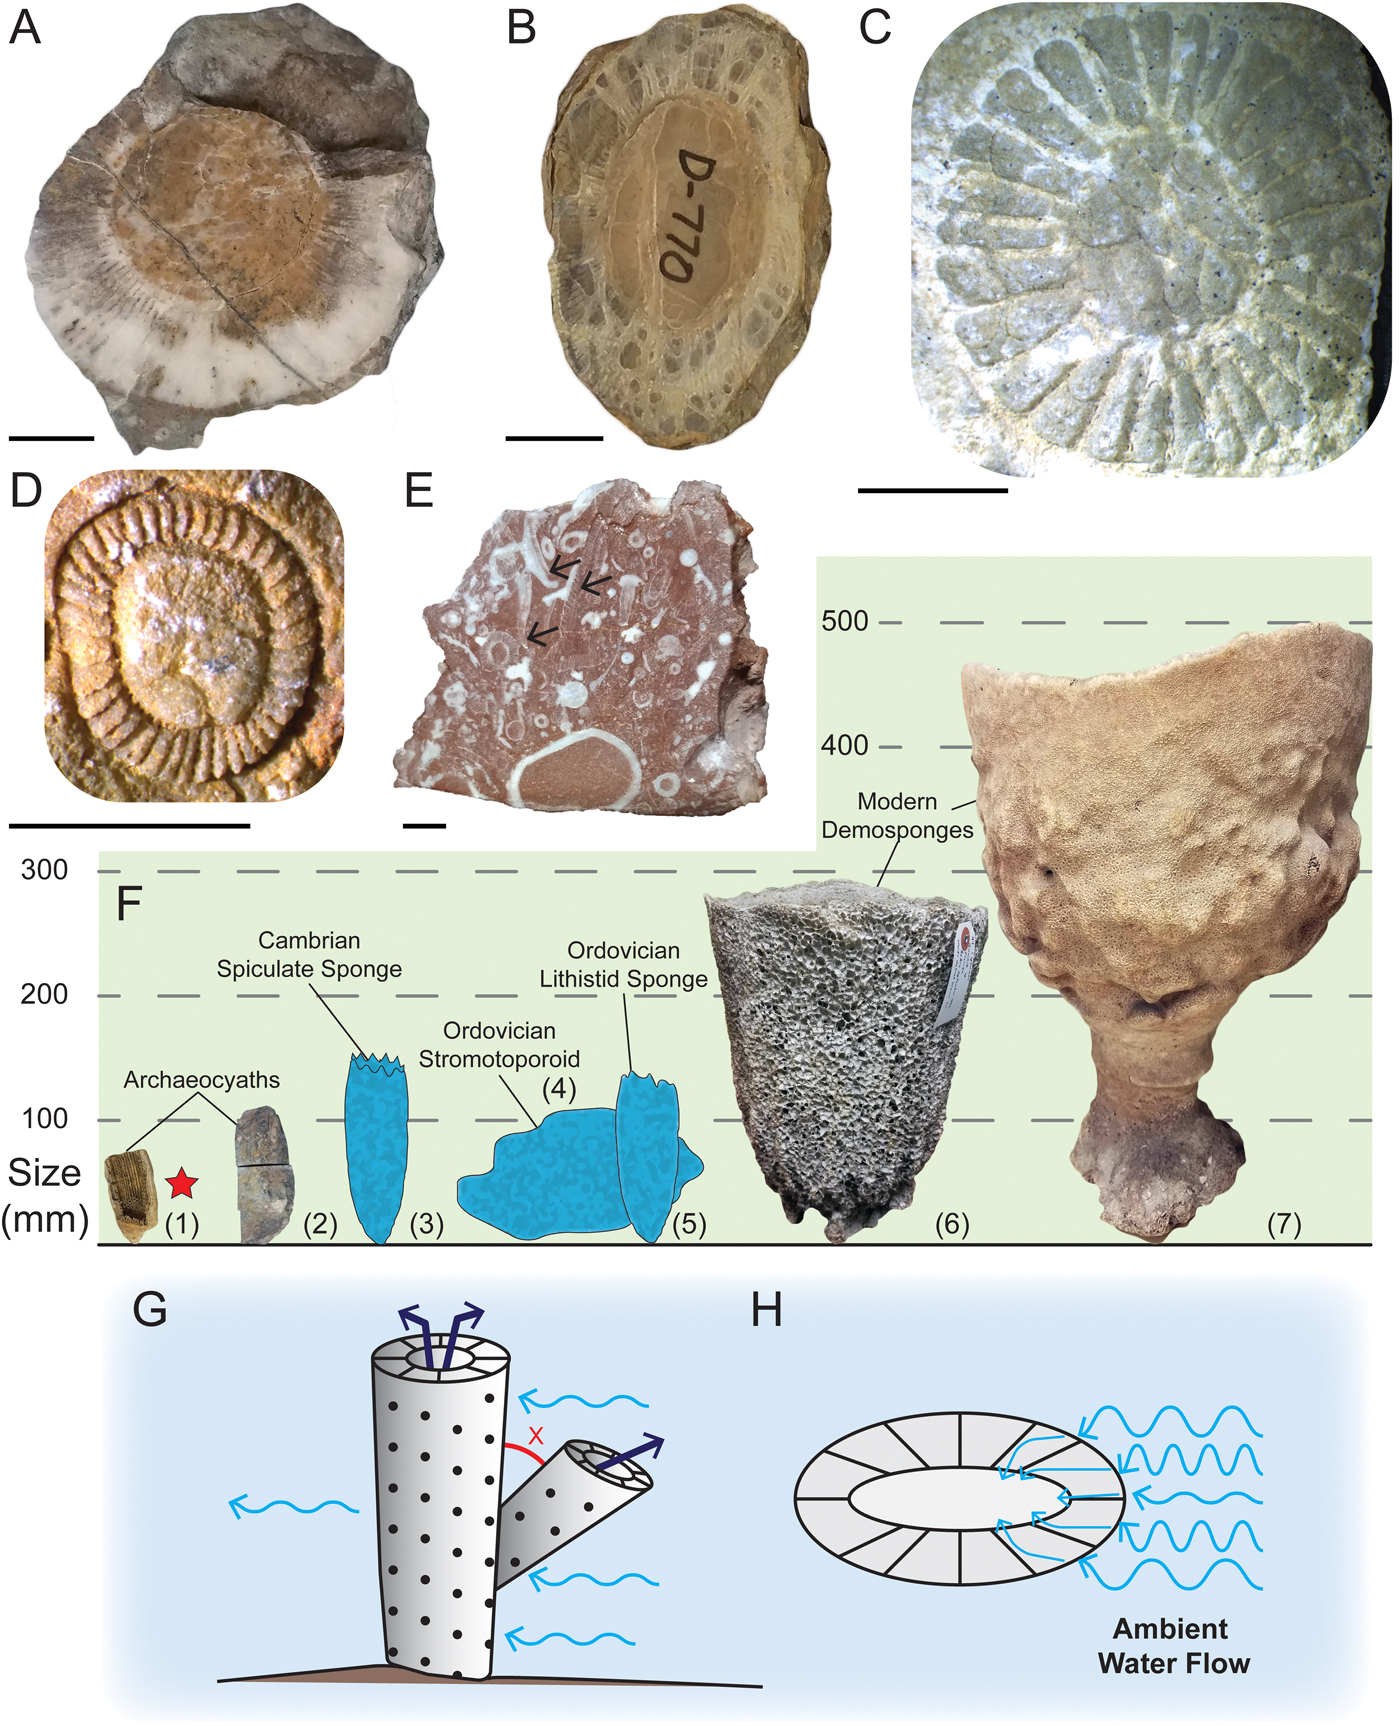
Figure 5. Archaeocyaths and modern demosponges used in study. A, Archaeocyath from western United States, UCMP 220846. B, Archaeocyath from western United States, UCMP 220710. C, Archaeocyath from Alaska, USA, UAMES 6099. D, Archaeocyath from Australia, UAMES 42655. E, Archaeocyath from Mongolia, IESAG000R. Okulitchicyathus fragments labeled with arrows. F, Size comparison of various sponges. Notes: 1, Archaeocyatha, UCMP 220822; 2, Archaeocyatha, UCMP 220858; 3, Lantianospongia (Xiao et al. Reference Xiao, Hu, Yuan, Parsley and Cao2005); 4, Stratodictyon (Webby Reference Webby1979); 5, Zittelella (Liu et al. Reference Liu, Rigby and Zhu2003); 6, Ircinia, MPM 44; 7, Cliona patera, MPM 53. Starred specimen is vertically exaggerated. G, Archaeocyath capturing ambient current. Angle (x) must be large enough to allow flow to reach main cup. H, Cross section of archaeocyath cup with septa redirecting and channelizing current into central cavity. Scale bars, 10 mm (A, B); 5 mm (C–E).
Statistical testing of archaeocyath continuous variables also found differences in centroid means based on taxonomic order and geologic formation groups (Supplementary Tables 2–3). However, as for differences based on locality, three-dimensional morphospace plots show no definitive pattern or separation of morphospace occupation based on taxonomic order or geologic formation (Supplementary Figs. 1, 2). This reaffirms our interpretation that archaeocyaths display a narrow range of morphospace occupancy based on continuous characters.
Discrete character analysis also showed very little diversity across archaeocyaths. Of 309 archaeocyath genera, 257 (83.2%) display the most common type of overall morphology (cylindrical-conical cup shape, no elaboration, arborescent gross morphology). This pattern was consistent through time and across different paleocontinents (Supplementary Figs. 3, 4). Based on descriptions used in the Archaeocyatha database, archaeocyaths only occupy three of our gross morphological categories. However, this might be an underestimate of their morphological disparity. Atypical archaeocyaths, such as Retilamina, Fransuasaecyathus, Erismacoscinus, and Zunyicyathus, can have an encrusting, globular, repent or stromatoporoid-grade gross morphology (Savarese and Signor Reference Savarese and Signor1989; Debrenne et al. Reference Debrenne, Rozanov and Zhuravlev1990, Reference Debrenne, Kruse and Sengui1991; Debrenne and Zhuravlev Reference Debrenne and Zhuravlev1992). These additional forms bring the total to six gross morphological categories. However, these forms are limited in both generic richness and abundance. Nonetheless, we reanalyzed our data with atypical morphologies included, by assuming an arbitrarily high proportion of genera belonged to these atypical categories (20%), and still found the proportion of differences between morphological categories to be statistically different (χ2 p-value < 0.001).
The lack of morphological disparity within archaeocyaths, for both discrete and continuous variables, suggests minimal morphological distinctiveness within early Cambrian reef-building sponges. In fact, their limited morphology limits their realized niche space to patchy hard substrates or cryptic environments, reducing their utility as reef builders and ecosystem engineers (see Wood Reference Wood1995). We do not suggest that archaeocyaths were completely excluded from other environments, only that they had a limited ability to thrive in many environmental settings.
It should be noted that the gross morphological characters are only a small portion of those used for taxonomic classification within Archaeocyatha. Cup diameter, osculum diameter, septal thickness, and loculus width are not taxonomically significant above the species level. Characters such as wall type, pore shape, and distribution, as well as other microscopic features (bracts, canals, microporous sheaths, etc.), would also need to be considered for classification purposes. Therefore, we do not intend here to comment on the taxonomic diversity within archaeocyaths based on these traits at this time.
Comparisons between Archaeocyaths and Other Sponges
Archaeocyaths occupy fewer regions of morphospace (Fig. 2D), have a lower range of morphological variation (Table 1), and are found to be smaller on average compared with either modern demosponges or lithistid sponges (Fig. 3A,B). Specifically, the maximum size of archaeocyaths in this study was often smaller than the minimum size of modern demosponges. The largest documented archaeocyaths belong to the plate-like genus Okulitchicyathus, which has possible examples of 1.5 m diameter cups (Hill Reference Hill1964). However, this perceived diameter could be due to multiple layered specimens, and more conservative estimates suggest a maximum diameter of 500 mm (Debrenne et al. Reference Debrenne, Zhuravlev, Kruse, Debrenne, Hartman, Kershaw, Kruse, Nestor, Rigby, Senowbari-Daryan, Stern, Stock, Vacelet, Webby, West, Willenz, Wood and Zhuravlev2015). Even these conservative estimates most likely represent outliers for archaeocyathan body size (Fig. 5E). Regardless, this is considerably smaller than the largest species of modern demosponges such as Xestospongia muta (barrel sponges), which can measure 0.98 m in diameter (McMurray et al. Reference McMurrary, Blum and Pawlik2008), not to mention even larger hexactinellids (>3.5 m) in deep-water reefs (Wagner and Kelley Reference Wagner and Kelley2016). Interestingly, these same patterns are not observed in osculum size. While osculum size was smaller for archaeocyaths, the difference between these and modern organisms was not nearly as large, and there was no difference in variance. While an exhaustive search was not performed, selected modern demosponges had an average of 9.9 ± 15.1 (N = 4) oscula per sponge, with several more containing more than a hundred. By comparison, nearly all archaeocyaths contained a single osculum. Increasing osculum size can reduce pumping efficiency; therefore, it may be more energetically favorable to produce many smaller oscula rather than expanding a single large one when expanding body size (Palumbi Reference Palumbi1986).
Comparing archaeocyaths to lithistid sponges, we find that while a greater proportion of lithistid sponges surveyed as part of this study were within the body-size range of archaeocyaths, they were on average larger (Fig. 3, Table 1). This pattern remained even after separating fossil and modern lithistid sponges, which themselves showed a change in size through time, with the average fossil lithistid sponge within the range of archaeocyathan body size, but significantly larger overall.
Discrete characteristics also show that archaeocyaths had a limited number of morphologies. Modern demosponges are most commonly encrusting or massive, and lithistid sponges are most often conical (Fig. 4A). While some archaeocyaths—for example, Retilamina, domal shape and possible encrusting habit; order Kazachstanicyathida and suborder Dictyofavina, stromatoporoid-grade shape and massive habit (Debrenne et al. Reference Debrenne, Kruse and Sengui1991)—possess unique gross morphologies, these genera make up <3% of archaeocyaths. Otherwise, archaeocyaths usually have a simple erect habit. Furthermore, archaeocyaths rarely possess specialized elaborations that in other sponges can increase surface exposure and hydrodynamic properties (Church Reference Church2017). Branching morphologies are most common in modular archaeocyaths, and even these are often weakly integrated. A previous study by Wood et al. (Reference Wood, Zhuravlev and Debrenne1992) found that 94.7% of archaeocyathan species were either solitary or weakly integrated (N = 508). This could lead to greater susceptibility to changes in environmental conditions or storms that could fragment poorly supported branching organisms (Wood et al. Reference Wood, Zhuravlev and Debrenne1992). We find that archaeocyaths have smaller average body sizes, lower size variability, and lower diversity of gross morphology compared with other types of sponges, resulting in overall restricted morphospace occupancy.
This study only focused on two endpoints of the Phanerozoic to assess changes in reef-building sponge morphology (Fig. 5F). A more thorough study of the Phanerozoic would be required to assess when this change occurred, but it may most likely be tied to when archaeocyaths ceased being the primary metazoan reef-building organisms (see Lee and Riding [Reference Lee and Riding2018] for a study on size changes in reef builders). Spiculate sponges within the order Protomonaxonida were already equal to or larger than archaeocyaths, with diameters between 5 and 40 mm (Xiao et al. Reference Xiao, Hu, Yuan, Parsley and Cao2005; Botting and Peel Reference Botting and Peel2016), but were confined to low-energy environments until the Ordovician (Carrera and Botting Reference Carrera and Botting2008). During the Miaolingian, explanate lithistid sponges formed in reefs measured between 7 and 23 mm (Kruse and Reitner Reference Kruse and Reitner2014: Figs. 6A, 14). But larger lithistid sponges grew to ~2 cm wide during the Miaolingian of China (Lee et al. Reference Lee, Hong, Choh, Lee, Woo and Riding2016) and even larger in Iran and the western United States by the late Cambrian (Shapiro and Rigby Reference Shapiro and Rigby2004; Kruse and Zhuravlev Reference Kruse and Zhuravlev2008; Lee and Riding Reference Lee and Riding2018). Pulchrilaminids and stromatoporoids (Early and Middle Ordovician, respectively) later occurred in reefs, and they too were larger than early Cambrian archaeocyaths (Li et al. Reference Li, Li and Kiessling2016; Hong et al. Reference Hong, Choh, Park and Lee2017). Thus, it seems that archaeocyaths had a limited size range and morphological disparity, which was unique for reef-building sponges in the early Paleozoic.
Why Were Archaeocyaths So Small?
The size of loculi within the intervallum does not appear to scale linearly with body size (Fig. 6A). Rather, loculus width is maintained by the insertion of new septa once the loculus width attains a certain size (McKee Reference McKee1963), with a maximum loculus width at approximately 1.25 mm (Fig. 6B). At small body sizes (<10 mm) there is a stronger correlation (r = 0.35) compared with larger (>10 mm) body sizes (r = 0.27). Flume-tank experiments with archaeocyathan models have shown that septa increase water entrainment and support unidirectional flow through the central cavity (Savarese Reference Savarese1992). Therefore, it is possible that larger loculus widths would reduce the efficiency of flow patterns and hinder filter feeding (Fig. 5G,H).

Figure 6. Loculus size distribution of archaeocyaths. A, Body size to loculus width relationship with logarithmic trend line shown in red. Purple line shows hypothetical continuation of loculus sizes if a linear trend of increasing width with increasing body size were occurring. Readers are directed to the online version of this article for color figures. B, Box-and-whisker plot of loculus widths; “X” denotes arithmetic mean. Raw data available in the Supplementary Materials.
Archaeocyaths could not grow to larger sizes, as it would have been too energetically expensive to produce additional biomineralized septa to help direct fluid flow. This challenge would have been further exacerbated by the low calcite saturation state of the late-early Cambrian oceans (Pruss et al. Reference Pruss, Finnegan, Fischer and Knoll2010; Knoll and Fischer Reference Knoll, Fischer, Gattuso and Hansson2011; Riding et al. Reference Riding, Liang, Lee and Virgone2019), which negatively impacts calcification of reef builders (Cohen and Holcomb Reference Cohen and Holcomb2009), as well as changing seawater chemistry from aragonite to calcite seas (Lowenstein et al. Reference Lowenstein, Timofeeff, Brennan, Hardie and Demicco2001; Porter Reference Porter2010) that has been correlated with reef-builder extinctions (Zhuravlev and Wood Reference Zhuravlev and Wood2009; Kiessling and Simpson Reference Kiessling and Simpson2010). Furthermore, planktonic food sources may have been lower until the late Cambrian, limiting suspension-feeder food supply (Servais et al. Reference Servias, Perrier, Danelian, Klug, Martin, Munnecke, Nowak, Nützel, Vandenbroucke, Williams and Rasmussen2016).
The hypothesized reliance on passive entrainment and the unique double-walled calcareous structure, which occupies over 20% of the archaeocyathan body, may represent a form of self-limiting modularity within the archaeocyathan body plan (Table 1). Modern experiments on glass sponges show that passive entrainment is critical for sponges, but is probably only plausible in sponges with thin walls and large oscula (Leys et al. Reference Leys, Yahel, Reibenbach, Tunnicliffe, Shavit and Reiswig2011).
This same evolutionary trade-off can be seen in modern examples of calcareous demosponges, though suspension feeding is aided by active pumping with choanocytes as well as passive entrainment. The modern sponge Vaceletia crypta has reliably been placed within the order Demospongiae based on molecular systematics (Wörheide Reference Wörheide2008), despite possessing an aspiculate, aragonite skeleton with stacked chambers. Superficial similarities to Archaeocyatha have led some to suggest an ancestral relationship between the two (Pickett Reference Pickett1985); however, the earliest fossil record of Vaceletia is from the Triassic and would imply a long fossil record gap. Even if Vaceletia is not a direct descendant, a comparison of its morphology can still be useful to understanding the archaeocyathan body plan. Vaceletia displays a gross morphology with a single osculum and size (mm to cm) similar to many archaeocyaths (Wörheide and Reitner Reference Wörheide, Reitner, Reitner, Neuweiler and Gunkel1996; Germer et al. Reference Germer, Mann, Wörheide and Jackson2015).
Extinct sponge taxa also show these patterns. For instance, Triassic examples of chambered “sphinctozoan” sponges also show a convergent robust calcareous skeleton and rarely measure above 130 mm, with most being far smaller (see Senowbari-Daryan and Stanley Reference Senowbari-Daryan and Stanley1992; Senowbari-Daryan and Zamparelli Reference Senowbari-Daryan and Zamparelli2003). In contrast, hypercalcifying labechiid stromatoporoid sponges also lacked spicules, but could achieve large body sizes up to 15 cm across (Stern et al. Reference Stern, Webby, Nestor and Stock1999; Hong et al. Reference Hong, Choh, Park and Lee2017). Stromatoporoid sponges do not contain the same double-walled structure and instead have more densely packed, but thin, laminae and pillars (Wolniewicz Reference Wolniewicz2009) and astrorhizal canals that provide a more distributed and energetically efficient fluid-entrainment system (Boyajian and LaBarbera Reference Boyajian and LaBarbera1987; LaBarbera and Boyajian Reference LaBarbera and Boyajian1991; LaBarbera Reference LaBarbera1993). Additionally, the Ordovician hypercalcifying sponge Calathium, which may have close affinities to archaeocyaths, has been measured at sizes of 300 mm in length and 90 mm in diameter (Li et al. Reference Li, Li, Wang and Kiessling2015). Calathium is superficially similar to archaeocyaths, as both have calcified inner and outer walls. However, Calathium walls are connected by rods as opposed to septa, which may alter the physiological demands of building such structures.
Modern spiculate sponges do not produce thick skeletons and can therefore devote more energy to body expansion and more diverse gross morphologies. It may be that spicules present a less energy-intensive method of extending the sponge body off the seafloor while still maintaining a flexible body plan to adapt to local conditions (Uriz et al. Reference Uriz, Turon, Becerro and Agell2003; Nickel et al. Reference Nickel, Bullinger and Beckmann2006), a condition not afforded by rigid calcareous skeletons. In short, sponges with both a chambered modular structure and calcareous skeletons tend to be smaller than organisms that lack one or the other. The small body size and simple morphology of both archaeocyaths and Vaceletia are consistent with our interpretation that the trade-off of building a calcareous skeleton with a unique double-walled (and/or chambered) structure is limited body size and morphological disparity.
Conclusions
We provide evidence that archaeocyaths from the early Cambrian of Laurentia were relatively restricted in both body size and gross morphological disparity. In comparison with archaeocyaths, modern demosponges and lithistid sponges are as much as an order of magnitude greater in body size and body-size variability. Furthermore, both groups are well distributed across several gross morphological categories compared with a sparser distribution for archaeocyaths. In a larger context, we find that morphospace occupancy of early Cambrian reef-building sponges was reduced compared with other sponge taxa. This suggests that morphospace occupancy for reef builders expanded, potentially sometime during the early Paleozoic, and may have contributed to increases in biodiversity in macroscopic reef builders during the Ordovician (Cordie et al. Reference Cordie, Dornbos, Marenco, Oji and Gonchigdorf2019). Their limited morphospace occupancy suggests that archaeocyaths of Laurentia did not adapt to a variety of environmental conditions. The restricted morphological disparity of archaeocyaths may have played a role in their ability to create additional niche space and resistance to habitat change (Wulff Reference Wulff2006; Kerry and Bellwood Reference Kerry and Bellwood2012). By investigating the morphospace of early Cambrian reef builders, we further support the transitional nature of the Cambrian as a period of establishment of the basic ecological properties common in ecosystems today, but with more restricted diversity.
Acknowledgments
Funding for this project was partially provided by the Wisconsin Geological Society and University of Alaska Fairbanks Student Travel Fund. Special thanks to E. Clites (University of California Museum of Paleontology), J. Colby (Milwaukee Public Museum), P. Druckenmiller and K. Anderson (University of Alaska Fairbanks Museum of the North) for their help accessing museum collections; P. Sheehan for helpful discussions; and C. Tubic for field assistance. Comments from J.-H. Lee, an anonymous reviewer, and W. Kiessling greatly improved the quality of this article.