1. Introduction
Crop microinsurance has great potential to help shield poor farmers from the risks associated with agricultural income. Many people in developing countries directly depend on agriculture and are therefore vulnerable to adverse agronomic events, such as droughts. In the absence of crop insurance, farmers manage agronomic uncertainty in ways that are potentially inefficient. For instance, they may reduce the riskiness of the income process by planting crops with low covariance in yields, and may deal with the consequences of any residual risk by pooling risk within extended families, ethnic groups, neighbourhood groups or professional networks. Crop insurance, where available, can be a useful component of an agricultural risk management strategy. Owing to concerns about moral hazard, adverse selection and high administrative costs of traditional indemnity insurance, many crop microinsurance programmes offer index insurance, where claims are a defined function of an index, chosen to be a good proxy for incurred crop loss.
This paper aims to provide an introduction to crop microinsurance, and the various issues necessary to consider when considering the launch of such a product. We first make the case for crop index microinsurance, comparing it to traditional indemnity insurance. We also talk about different formulations of index insurance, specifically weather index insurance and area-yield insurance. Claims payments from weather index insurance are a defined function of recorded weather at a contractual weather station, while area-yield-indexed insurance claims are a function of average local yields for a specific crop, estimated through crop cutting experiments in a sample of local farms.
We then proceed to outline the various factors involved in designing and launching a crop microinsurance programme, looking at the common stakeholders, product design, product pricing and financing.
First, it is important to understand the different stakeholders that can typically be involved in providing crop microinsurance. These include grassroots-level organisations, insurance and reinsurance companies, distribution channels, third-party administrators, governments, regulators, non-governmental organisations (NGOs) and international financial organisations.
Next, we speak about challenges and solutions for designing crop index insurance products. For example, when designing a weather index crop microinsurance product, an agronomic basis needs to be developed for the insurance product. The product should be easily understandable by the target market, basis risk needs to be minimised and weather data for measuring indices needs to be collected. These issues can be particularly acute in developing countries, where historical data can be sparse and potential customers have low levels of financial literacy. One particular challenge when designing crop index insurance microinsurance is correctly balancing complexity versus basis risk; a more complex product can give better correlation with crop yields, but may be more difficult to understand, and therefore less attractive to potential customers.
As for other insurance products, the premium for crop microinsurance comprises the expected payout, expense loading, profit margin and cost of capital. When pricing a portfolio of weather-indexed crop microinsurance policies, a portfolio approach to estimating the expected payouts is likely to be more efficient than a standalone approach. Portfolio risk analysis can be carried out to determine the amount of risk capital required.
There are various mechanisms through which insurers could use to finance a crop microinsurance product. These include self-financing, mutuality, reinsuring, government funding, catastrophe bonds and pooling. All these methods have their pros and cons, and a provider may decide to use a combination of these methods to finance different risk layers.
Finally, we present two case studies of different crop microinsurance schemes in practice. We look at a product protecting against drought in Malawi, and one protecting against typhoons in the Philippines.
2. Why crop index microinsurance?
In rural areas, a crop loss can be catastrophic for poor families. In the event of suffering an agricultural loss, a rural low-income family may be deprived of the food and earnings required to provide them with adequate nutrition. The family may be forced to stop sending children to school and many children may be forced to switch over to child labour. If the family is already in debt the situation would deteriorate further, requiring them to sell valuable long-term assets such as household possessions and livestock. In addition, if a shock hits entire areas at once (such as during a drought), informal safety nets of friends and families may be insufficient. In this situation, formal insurance can play an important role in protecting people against bad crop outputs.
In this section we explain the design of a couple forms of index insurance, and compare their advantages and disadvantages with respect to indemnity insurance.
2.1. Two categories of index insurance
By definition, index insurance calculates claims based on the realisation of an easily measured index, which should be correlated with individual crop outcomes. There are two main types of crop index microinsurance: weather index insurance and area-yield insurance.
Weather index insurance makes payouts when certain weather events are measured that are deemed to be correlated with crop loss in the region. For example, a deficit rainfall index insurance product may pay $X for every centimetre deficit in rainfall less than Y centimetres, where Y is the trigger point and subject to a maximum of $Z being payable. So, the insurance payout depends only on the specified, measured weather event and the index used to specify the claim payment. The insurance payout does not depend on the actual agricultural loss incurred on individuals’ farms.
Area-yield insurance instead estimates crop loss in an area by measuring crop output on a random selection of farms in the area. This is normally done with a visit to farms by an agricultural expert, who takes a sample of crops on the farm and compare them to pre-determined benchmarks. If the average measured yield in an area is below the payout threshold, everyone in the area receives a payout. Agricultural Company of India’s National Agricultural Insurance Scheme (NAIS) is the largest agricultural insurance programme in the world (covering around 25 million farmers), and provides coverage based on an area-yield index.
Both these methods have their advantages, but the main trade-off is as follows. Weather index insurance has the advantage of being easily measurable, so the index can be verified quickly with little cost. Area-yield insurance is more costly to implement since individual farms must be visited, but this index may be better correlated with crop outputs than a weather index.
2.2. Basis risk
Claim payments from indexed crop microinsurance products depend only on the specified index, which will not be perfectly correlated with output on a customer’s farm. This lack of correlation is known as basis risk, which is the main drawback of indexed crop insurance. Basis risk could potentially be reduced by having more sophisticated products and/or by having many products, each tailor-made for a specific crop. However more complicated and multiple products may be difficult to understand and the take-up rate may be low. Hence, there is an important trade-off between reducing basis risk and increasing the complexity and number of individual products offered.
For weather insurance, basis risk may have three different components depending on the product design. These are:
∙ Spatial component: Most weather-indexed insurance policies make claim payments based on the rainfall or temperature recorded at a local weather station. Rainfall differs across different locations. So, the rainfall as measured at a weather station may not be a good indication of rainfall experienced by the insured farmer. Hence, the claim paid to a farmer may be poorly correlated to the actual crop yield experienced by the farmer. This is a major challenge to plans for scaling-up operations. Certain risks (e.g. inadequate rainfall, flooding) may be more susceptible to spatial basis risk than other risks (e.g. droughts).
∙ Temporal component: During different stages of farming the amount of rainfall has different effects on the crop yield. So, even if the rainfall has been “sufficient” overall the farmer may suffer a loss if the timing of the rainfall has not been suitable.
∙ Crop-specific component: Basis risk may exist due to the low correlation between insurance claims paid and crop yields due to crop-specific agronomic features. These agronomic features include a variation in planting times, duration of growing season and sensitivity to rainfall, average temperature, etc. This component of basis risk is a problem when the product design of the insurance does not sufficiently allow for crop-specific features.
Reducing basis risk is one of the greatest outstanding challenges of index insurance design.
2.3. Advantages and disadvantages of using indexed instead of indemnity insurance
Indexed crop microinsurance has various advantages and disadvantages relative to the indemnity version. Significantly, indexed insurance should not suffer from adverse selection, moral hazard or high administrative costs. Eliminating administrative costs is particularly important for microinsurance, as it allows the product to be sold profitably at small scales.
Some advantages of using indexed insurance include:
∙ As the payment is not based on the output of any particular customer, the insurer should not be affected by adverse selection or moral hazard. In general, it should make absolutely no difference to the insurer who buys the product and what actions they take on their farm.
∙ Assuming that historical data on the index and farm output is available, it should be straightforward to create and price the products. Similarly, it should be easy to calculate payouts after a shock. These factors lead to low administrative costs for the insurer and lower premiums for the customer.
∙ Claims are linked to an objective and independent source of information. This should decrease the chance of fraud and the ability to find reinsurance for local projects.
∙ Because the insured event is relatively easily verifiable, reinsurance may be easier to obtain for indexed products.
Some of these factors will be different for area-yield insurance versus weather insurance. As long as weather stations (or other data such as satellite imagery) exist, weather insurance payouts should be very easy to calculate and verify. Calculating payouts for area-yield insurance requires some yield measurements, which can be more costly and also lead to delays in claim payment.
Disadvantages of indexed insurance include:
∙ Basic risk may be significant depending on the correlation between the actual loss incurred by the farmer and the rainfall recorded at the weather station, the index used and the product design, etc. Also, if the agricultural losses have occurred for other reasons (e.g. pests, flooding) that are not measured by the index, then there may be a large disparity between losses and payouts.
∙ For weather insurance, setting up and maintaining weather stations and other infrastructure required for measuring weather indices may be expensive and challenging. For area-yield insurance, measuring crop output can be costly and time consuming.
∙ Constructing suitable indices and a suitable product design may be challenging and subject to more basis risk. Also, product design may need regular reviewing.
∙ Indexed products may be more difficult to understand, especially if the product design is made more complex to deal with basis risk.
Once again, these disadvantages will play out differently for area yield versus weather insurance. As area-yield insurance features actual measurements of crop yield, basis risk should be relatively low as long as there is not a huge amount of heterogeneity of outputs in the sample area. Also, area-yield insurance does not require rainfall stations, though one still needs historical yield data to price the products.
Although agricultural indemnity insurance is popular in many developed countries, it has achieved high take-up only with heavy premium support from the government. Since average landholdings in the developing world are much smaller, verifying claims under indemnity insurance becomes much more expensive on a per-hectare bases, and so far developing world governments have not shown an appetite for subsidising indemnity insurance. Owing to the easy verifiability of claims and low administrative costs, it is feasible to offer index insurance for very small sum insured values. In most cases, this will make index insurance more suitable than indemnity for the microinsurance market.
2.4. Insurer’s exposure to risks under crop microinsurance
Insurers’ exposure to risks depends for index insurance depends on various factors, which include the level of cover and maximum policy payout, the correlation of different risks insured by geography and over time, the extent to which reinsurance is used, etc.
Concentration of insured risks is a major risk for the insurer. If writing a geographically concentrated portfolio of risks, the insurer is exposed to the risk of suffering large losses from a single event, e.g., poor rainfall throughout a particular region. Ideally, an insurer would provide coverage to a wide geographical area that has low correlation for the payout indices. This risk would be lessened if index insurance was offered as part of a diverse insurance portfolio, as agricultural indices would be hopefully uncorrelated with other lines of business.
Owing to these problems, many insurers seek to reinsure index insurance on the international reinsurance markets. This can be a good solution, but many companies have found that reinsurance costs are high due to uncertainty in the young index insurance market. We will speak more about risk financing options for insurers in section 5.
Another risk to private insurance comes from regulation, which may be constantly shifting. For example, the maximum premium charged for crop microinsurance may be capped by changes in regulations. Similarly, insurers run the risk of being priced out of the market by government insurance companies, which may be able to charge highly subsidised premiums. There is some evidence when the government insurer in India entered the index insurance market, this provided competitive pressure on the private insurance companies that were already in the market.
3.. The parties involved
In this section we look at the organisations that are involved in providing microinsurance and in particular crop microinsurance. To a very large extent the list is the same as the list of parties who are involved in providing traditional insurance. However, the context of crop microinsurance means that in addition to these traditional organisations, governments and international financial institutions and NGOs also have a significant role to play.
3.1. Insurance companies
A number of European insurance groups have set up microinsurance operations in developing countries, sometimes as a joint venture with a local company. These companies include Allianz, Mapfre and Zurich Insurance. At the same time developing countries are themselves home to large commercial insurance companies such as Bradesco in Brazil and ICICI in India.
There are a number of specific challenges for large insurance companies who want to enter into this market. It should be clear to management at all levels of the company that the microinsurance product should contribute positively to the company’s financial bottom line as well as to the company’s corporate social responsibility rating. If it does not do the former then there is a high risk that management will not treat the product seriously and resources will be devoted to other more profitable line of business, making the failure of the microinsurance product a near certainty. The key requirements for profitable microinsurance include generating sufficient scale and achieving high administrative efficiency. Management needs to be focused on these goals.
3.2. Reinsurance companies
Many large global reinsurance companies have invested in microinsurance and are involved in a number of pilot schemes. For example, Munich Re carries out research and sponsors conferences on this topic. Munich Re itself is involved in a pilot scheme in Indonesia along with Indonesian insurance company Asuransi Wahana Tata and the Deutsche Gesellschaft für Technische Zusammenarbeit GmbH on behalf of the German Federal Ministry for Economic Cooperation and Development that offers low-income households in the capital Jakarta the opportunity to insure against the direct economic losses and social risks caused by severe flooding. Swiss Re has been working with Oxfam America, Columbia University and Nyala, an Ethiopian insurance company, on a crop insurance pilot scheme.
Reinsurers such as Munich Re and Swiss Re provide not just capital and sponsorship to local insurers; they also provide technical expertise and a risk transfer mechanism that can diversify the risks from one country or a region within one country against the same or different risks in other places. They can also provide a conduit between donors who wish to support microinsurance and local insurance operations.
3.3. Distributors and other service providers
As with any insurance product, efficient and effective distribution channels are vital. Given the low margins available in microinsurance, the pressure to keep per policy distribution costs down to a minimum is even greater. However, the target marked for agricultural microinsurance (poor farmers) are generally live far away from town centres and are difficult to reach. In general, this results in the distribution of insurance piggy-backing on other distribution channels. In some countries, insurance companies have teamed up with local utility companies (water, electricity and mobile phone operators) who already have a relationship with the microinsurance target market. Insurance companies also use locally based agents and small kiosks in shops as outlets for their products. As crop insurance is frequently tied to loans, it is often sold through the distribution network of the lending institution.
3.4. Governments
Developing country governments are potentially key to the success of microinsurance by helping the insurance industry to develop in general and to encourage or even force the provision of insurance for people of low income. The actual involvement of government will depend on how interventionist it is with respect to the provision of social insurance. Some governments would see it as their role to provide social safety nets while others prefer, or have no choice due to a lack of capacity but to leave it to the market to provide such safety nets.
Governments can use various means to make insurance more attractive to its population:
∙ Subsidise the premiums or subsidise some of the costs incurred by insurers providing microinsurance (including bearing risk).
∙ Help to educate the population about the benefits of insurance.
∙ Invest in product research and development and training and information gathering for crop insurance.
∙ Make insurance compulsory in order to receive government subsidised loans.
∙ Ensure that insurance legislation and regulation is appropriate for the microinsurance market, although they have to be careful to avoid the situation where “benefits meant exclusively for the poor often end up being poor benefits” (Sen, Reference Mahul and Stutley1995).
Government policies can also hurt insurance markets, primarily through crowding out. If the government has a reputation for providing disaster relief, it will decrease the value of insurance provided in the private market. Anecdotally, many farmers who refuse to purchase microinsurance have stated that they believe the government would help them in a time of disaster, and therefore do not need to purchase insurance.
Governments may feel they have a moral responsibility to address disaster-struck citizens, but want to do without crowding out the insurance market. One way to do this is by heavily subsidising and promoting private insurance, as is the case with the National Crop Insurance Scheme in the United States. Another strategy is to require crop insurance in order to access government-backed loans, as is the case with the Nation Agricultural Insurance Scheme in India. While we do not know of any instance where farmers have been forced to purchase agricultural insurance, certain forms of compulsion exist in similar markets, like for flood insurance in the United States.
3.5. Regulators
Insurance regulators have a key role to play in improving access of low-income people to financial products. There is a tension between microinsurance providers who might (in order to keep compliance costs low) prefer to offer their products within a more limited regulatory regime than applies to traditional insurance.
IAIS (2007) sets out the following ideas of how supervisors could make microinsurance sustainable and feasible in their territories:
∙ developing a microinsurance policy and promoting its implementation;
∙ facilitating the availability of key information/statistical data on microinsurance business;
∙ promoting learning processes and dialogue among relevant stakeholders;
∙ enacting clear laws and regulations in accordance with internationally accepted standards that encourage insurance coverage for low-income households and its compliance while limiting regulatory arbitrage;
∙ contributing to the policy dialogue with government so that social insurance schemes are working in conjunction with microinsurance;
∙ developing clear policies to enhance access to financial services that can be used as a basis for discussion with legislators, and also between government departments and supervisors;
∙ limiting moral hazard and fraud by promoting awareness, and putting in place controls and incentive systems;
∙ promoting consumer education and raising awareness to instill an insurance culture among low-income households.
Whether all of these considerations need to be taken into account by a regulator who is assessing crop insurance will be up to the regulator to decide. If crop insurance is heavily subsidised by government or overseas donors then there is perhaps no reason to reduce the level of regulation for this type of business compared with other similar lines of business sold to rich segments of the market.
3.6. International financial institutions
The World Bank and the UN have been actively involved in promoting and sponsoring crop microinsurance.
According to the Mahul & Stutley (Reference Mahul and Stutley2010) government it has provided technical assistance for the development of innovative agricultural insurance programmes in both low- and middle-income countries, often tying these programmes into agricultural finance support efforts and complementary efforts in agricultural development. As of 2009, more than 15 index-based agricultural insurance programmes had been implemented or enhanced with World Bank assistance in low- and middle-income countries. For example, the World Bank has assisted the government of India in improving the NAIS, which offers coverage against crop yield losses, using an area-yield index in the indemnity payment schedule. One of the problems with the original design of the NAIS was that the premiums were not actuarially based. Through the Financial Sector Reform and Strengthening (FIRST) Initiative, which is managed by the World Bank, a Canadian actuarial consultancy firm was used to derive actuarially based premium rates for the NAIS. While farmers still pay a flat rate, the State and Federal governments pay a subsidy so that the insurance company that covers the NAIS scheme, the Agriculture Insurance Company of India, receives a premium calculated using actuarial principles.
The International Finance Corporation, a member of the World Bank Group, also takes an interest in microinsurance. It has set up the Global Index Insurance Facility to expand access to index-based insurance for natural disasters and weather risks in developing countries particularly to farmers and people in agrarian communities. The European Commission committed 24.5 million as the first donor.
The UN, through its agency the International Labour Organisation (ILO), has also been funding a number of microinsurance projects. The ILO is the home of the Microinsurance Innovation Facility, which was funded by the Bill and Melinda Gates Foundation. The Facility provides grants to support organisations developing innovations in the microinsurance sector. While the grants can support insurance against any type of risk, priority is given to products where demand exceeds supply, such as agriculture, health, life and property.
3.7. NGOs
A wide variety of NGOs also get involved in microinsurance in one way or another. Many of these will be microfinance providers and supporters who have branched out into the microinsurance sector.
For example, Planet Finance, which started as a microfinance-related NGO, have set up a microinsurance project to help develop knowledge for MFIs and micro-entrepreneurs and to sell a credit life insurance product covering death and disability. They are starting in Egypt and aim to increase coverage from 50,000 people in 2007 to seven million in 2011.
The Bill and Melinda Gates Foundation has been active in supporting microfinance and microinsurance initiatives such as the Aga Khan Agency for Microfinance (AKAM) and the UN’s Microinsurance Innovation Facility mentioned earlier. The Gates Foundation has also helped to the tune of US $24.2 million, Opportunity International’s subsidiary the Micro Insurance Agency (now called MicroEnsure) expand it’s insurance offering for low-income people with the aim of reaching 21 million low-income people by 2012. MicroEnsure is an insurance intermediary aiming through extensive market research and insurance expertise to ensure that products are designed that address the real financial risk management needs of low-income people. MicroEnsure have been pivotal in providing weather index insurance in Malawi, Tanzania, Rwanda, India, the Philippines as well as other microinsurance products in many other third-world countries.
Other NGOs active in crop index insurance include The Microinsurance Network, the Microinsurance Centre, the World Bank’s Consultative Group to Assist the Poor and the AKAM.
4. Product design
Weather-related risks for smallholder farmers in developing countries have been covered using weather index insurance products since 2003 when the World Bank initiated a pilot with BASIX in India (Manuamorn, 2007). Index crop microinsurance products have covered a number of different weather-related risks including drought, flood, excess rain and typhoons. The aim of weather index insurance product design is to identify an index that closely matches the underlying risk farmers would like protection from. Hess et al. (Reference Hess, Skees, Barnett, Stoppa and Nash2005) list the following to be desired properties for an index:
∙ observable and easily measured;
∙ objective;
∙ transparent;
∙ independently verifiable;
∙ able to be reported in a timely manner;
∙ stable and sustainable over time.
4.1. Product design and ratemaking
While the pricing of products is left to the following section, it may be said at this stage that the procedure for design and ratemaking are linked. To simplify somewhat, one can think of an index insurance product as comprising a shape of coverage, a level of coverage and a premium or premium rate. This section is primarily focused on the shape of index insurance products, whereas section 5 will focus on statistical procedures either for setting the level of coverage to match a target premium or setting the premium for a given coverage level. Figure 1 offers an overview of the topics covered in this and the next section.

Figure 1 Components of ratemaking.
4.2. The actuarial control cycle
The actuarial control cycle offers a framework for thinking about the product design, pricing and risk financing more generally (Figure 2).
Figure 2 The actuarial control cycle.
In order to carry out any analysis one has to start with a set of initial assumptions based on whatever relevant information there is available. Using these initial assumptions, profit tests can be run for each product to assess its profitability. This is normally done as part of the product development process or when reviewing existing products.
The results of the individual profit tests can be combined to produce a model of the whole company making allowance for corporate-level items such as tax, which may not have been included in the product-level profit tests. The model office can be used to product embedded values or other realistic reporting measures as well as producing statutory valuations. As a by-product of the model office the company can produce an appraisal value that is the total value of the company which includes a value of future new business.
The change in the results from the model office over a period, for example, the change in embedded value over a year can be analysed to identify the key drivers of the change. The main items which will explain the change will be changes in modelling techniques and assumptions and differences between the actual experience and the expected experience. There will also be the effect of unwinding any discount rate used and also the effect of any unexpected changes in data.
The reasons for the changes in the results from the model office should be monitored so that any requirement to change assumptions or modelling approaches is identified. The revised assumptions will then feed into subsequent profit tests and model office calculations.
4.3. Developing a scientific basis for the product: weather insurance
A good weather index insurance product should have a scientific basis linking the index to the underlying risk that farmers face. Some weather index insurance products have aimed to insure a specific crop, whereas others are more generic perhaps covering specific months and so potentially applicable to several crops. Product design typically involves initial discussions with local farmers and agronomists to understand the main risks and farming practices specific to the crop being insured. Information on the crop growing season and sowing dates can be matched with an insurance product that covers the growing season only (less than a year term).
For deficit rainfall products crop growth models can be used to assess the water requirements of specific crops in specific locations during different phases of the crop growth. As well as estimating crop water requirements in each growth phase, it is also possible to estimate the levels of rainfall below which the crop becomes stressed owing to deficit rainfall. These can be used to set rainfall triggers, when the rainfall is below these triggers payouts can be made.
For example, potato blight typically occurs when a series of meteorological conditions (known as a “Smith Period”) occur during a certain phase of the potato plants growth. A Smith Period occurs when there are least 2 consecutive days where mininmum temperature is 10ºC or above and on each day there are at least 11 hours when the relative humidity is >90%. Weather index insurance products have been developed in India to provide payouts when a Smith Period occurs.
When weather index insurance products have been developed it is good practice to test how well historic payouts from these products correlate to historic crop loss data. A good correlation provides an additional level of comfort that the product would have paid out in times of significant crop loss. Unfortunately, it is difficult to get good quality crop loss data at a regional level in most poor countries.
It is probably best to design products (and possibly set premiums) based on agronomic and commercial fundamentals, with one free parameter for ratemaking. This parameter could be the commercial premium, the level of a deductible or the payment rate per mm of rainfall. Historic weather data should only be used in setting this single free parameter.
Under no circumstances should historic weather data be used in determining the shape of insurance products; this data will also be used for ratemaking and there is the potential for data mining. One example of data mining would be the following: there are 30 years data for a 1-month period of insurance coverage. The average rainfall is 100 mm in that month and the insurer wants to develop a trigger below which they start making payouts. A crop model says payouts are made below 65 mm. The actual data has the lowest 10 points with 9 points at 65 and 1 point at 60. The product designer finds it is possible to significantly cheapen the product based on historic data by moving the trigger from 65 to 64 mm, excluding the 9 points from payouts.
4.4. Easily understandable products
Product development should take into account the target market. Some of the most scientifically accurate weather index insurance products have failed to achieve sufficient scale and take-up rates as they are too difficult to explain to local partners and customers. Concepts for how the products work need to be clear and easily explainable.
Interaction with farmers is a very useful method for designing the product and in the regular monitoring of the performance of the product, especially for cases where projects are trying to scale-up. Feedback from farmers is particularly useful for understanding issues like how many crops should be covered by a single policy, what different risks should be covered, should the policy pay out small amounts frequently or pay out larger amounts for extreme weather events only, etc. Feedback sessions include interviews, surveys and games played to understand the risks faced by farmers and how the insurance could help in managing some of these risks. It is a challenge of product development to get the right balance between products that are easily understandable and will sell well, with those that are scientifically accurate, but more difficult to explain.
4.5. Minimising basis risk
As discussed above, basis risk is the risk that the weather index insurance product fails to payout when the farmer has suffered a loss on the underlying risk. (It is also the risk that the product pays out when the farmer has suffered no loss – although this typically receives fewer complaints!) Minimising basis risk is extremely important, as customers expect insurance to provide money when their crop outputs are low. In addition, Clarke’s (Reference Clarke2011) thesis shows that high basis risk results in lower demand by the most risk averse. As these are the people who would benefit the most from indemnity insurance, minimising basis risk is essential to provide an attractive product to this sector of the population.
Many weather indexes are based on weather readings taken from weather stations. Not all farmers’ fields are immediately next to weather stations, so the question arises as to how far from the weather station a farmer can purchase weather index insurance with an index based on the weather station. For rainfall indices 20 km has been taken as a standard distance for many contracts in Africa. Although in some places 20 km is far smaller than necessary, and in others the boundary is dangerously large. In India, where there is the longest history of rainfall index insurance products, 20 km is seen as too high in many regions. The basis risk in this instance is that the rainfall at the rain gauge is significantly different from that experienced on the farmer’s field.
The aim of weather index insurance product design is to minimise basis risk. By linking the product as closely to the underlying risk as possible basis risk can be minimised, but never totally removed.
4.6. Weather data source for indices measurements
The weather parameters used for weather index insurance are typically gathered from ground-based weather stations. As discussed in section 3 this restricts the sales of weather index insurance to farmers who live nearby weather stations. There have been insurance pilots launched that have used satellite data to provide the weather parameters for weather index insurance. The main benefit for using satellite data is that there is no restriction to market the insurance near weather stations; and in many developing countries this is a significant benefit as there are currently few weather stations. There are a number of issues with using satellite data, and many satellite-based approaches do not have a resolution high enough to accurately assess the weather conditions in a farmer’s field.
There are many possible approaches to using satellite data, three examples used in practice are:
∙ The typhoon index described in section 7.2 is based on satellite data.
∙ IFFCO-Tokio has launched a satellite drought protection product in India in 2009 (IFFCO-Tokio, 2010).
∙ Kenyan livestock insurance 2010 (Ross, Reference Mahler and Curtis2006).
Other ideas have included measuring the “greenness” of vegetation in known farming regions. This has been used in Canada and the United States with some success. There are potential issues with this approach in smaller fields in the developing countries, where nearby forests can influence index readings (Chen et al., 2010). Satellites can also be used to photograph farmers’ fields at sufficient resolution to capture visible crop damage.
Some testing has been carried out on satellite rainfall estimates compared with ground-based weather stations. There are no conclusive studies yet published, but many satellite weather indices are not well correlated to ground-based rain gauge indices in the tail of the distributions – when insurance claims will be paid.
Satellite data has been seen as a potential solution to the lack of weather stations in the developing countries. However, there are potential issues with many of the possible approaches, which may make developing products with low basis risk difficult. Even if current approaches are not yet good enough for this task, it is quite likely that in the near future more accurate approaches will be developed.
5. Pricing
Pricing for weather index insurance is similar to that for traditional lines of insurance business; a typical premium formula would consist of an estimate of the expected payout from the product as well as loads for expenses and risk. However, there are some unusual aspects of weather index insurance that we will also cover in this section.
First, when selling a product that indemnifies policyholders against an incurred loss, there is a natural product shape in the form of full or partial marginal insurance for losses above a deductible. With weather index insurance, there is no such natural product shape. As noted in the previous section, insurers should be careful in using historic data both for product design and pricing, as there is the potential for data mining, leading to a systematic underpricing of products. In this section, we outline how products should be designed and priced based on agronomic and commercial fundamentals, but with one free ratemaking parameter. For example, the product could be designed to be based on agronomic fundamentals with the premium acting as the free ratemaking parameter. Alternatively, the premium could be set based on commercial fundamentals, with the shape of the product based on agronomic fundamentals and the level of coverage as the ratemaking parameter.
Second, weather patterns and underlying agronomic fundamentals are typically spatially correlated. In such a circumstance, an efficient estimate of the expected payout from each product should be based not only on the weather history at the nearest weather station, but also at other nearby weather stations. By using the spatial structure of agronomic and weather conditions, an insurer could protect the ratemaking process from statistically insignificant features of historic data.
Third, the existing practice for rating weather index insurance products is based on the approach used in weather derivative markets, in which products are designed and priced on a standalone basis. Risk loading is also on an individual basis, calculated using the corresponding weather history. While this might be acceptable for small pilot portfolios, it is likely to be inefficient for larger portfolios. In particular, under a standalone methodology it may be impossible to offer the same product at adjacent weather stations for similar premiums, even if the difference in weather histories is not statistically significant; under a standalone approach there is no mechanism by which weather histories can be compared or historic claims mass be spread over more than one product. As portfolios mature and insurers offer a large number of weather index insurance policies, a portfolio approach to rating may be more appropriate. This would likely lead to similar products being offered at similar prices in nearby, agronomically homogenous, districts.
5.1. Basic premium formula
The basic premium formula a reinsurer might charge for 100% coverage of risk for short-term business is
 $$Premium=(Expected\,payout{\plus}Cost\,of\,capital{\plus}Expenses){\times}Discount\,\,factor$$
Expected payout: Estimating the distribution of payouts will be the main focus of this section and so we defer the bulk of the discussion until we have discussed the other items in the premium formula. However, we may say that the calculation should yield an estimate that is both unbiased and efficient, that is to say the estimate should neither be too high nor too low on average and it should be unlikely that the estimate is significantly wrong. The simplest possible estimate for the expected payout from a product is to calculate the payout that would have been paid in each historic year for whichever weather data is available, and then average these historic payouts. This type of calculation, referred to as historic burn analysis, yields an estimate that is simple and unbiased (barring trends or non-random missing data) but is likely to be inefficient.
Cost of capital: The cost of capital reflects the return an insurer requires on any capital it holds with respect to the risk being taken. Under a risk-based regime such as Solvency 2 this may look like:
 $$Cost\;of\;capital & =Proxy\;for\;capital\;required{\times}Required\;return\;on\;capital$$
where
 $$Proxy\;for\;capital\;required\; & =(99.5^{{th}} \;percentile\,{-}\,Expected\;payout){\times}\;Diversification\;benefit$$
The required return on capital is the extra return that shareholders require to compensate for the capital being held in low-yield low-risk assets and the liabilities containing significant risk. The diversification benefit would typically be set so that the total cost of capital across the portfolio is approximately equal to the portfolio-wide cost of capital, allowing for reserves and any reinsurance purchase. The diversification benefit for weather index insurance is potentially very attractive with little correlation to any other risks international reinsurers may underwrite.
The 99.5th percentile represents an estimate for the high level of payout that might occur with a 0.5% probability.
The cost of capital may also cover the insurer’s profit loading.
Expenses: The contribution to expenses is an allowance for all administrative costs of the product, including design, pricing, marketing, collecting premiums and settling claims. The total contribution to expenses for an insurer should equal or exceed the total expected expenses of the insurer.
Discount factor: The discount factor allows for the fact that there is a period between premiums being paid and claims being settled, during which the premium income may be invested in interest-bearing assets. In agricultural insurance, premiums are typically due before sowing whereas claims are settled after harvest. The discount factor can take different forms depending on the timing of payouts and expenses and whether the cost of capital already essentially includes a discount factor.
5.2. Cleaning data
Some developing countries have weather stations with long recorded histories, and many of these weather series have gaps. Depending on the specific context, an assumption that gaps are missing at random might be entirely reasonable. If gaps are not missing at random one might try to construct estimates of missing weather data from other sources or make an ad hoc adjustment to rates, for example, by the addition of an “ambiguity load”. The latter approach is common in weather derivative markets regardless of whether missing data is perceived to be missing at random, presumably to protect against adverse selection.
5.3. Historic burn analysis and de-trending
Armed with a product and a historic weather series one should be able to calculate the claim payments that would have been made in past years for each product in the portfolio. The average claim payment for an individual product, divided by the sum insured, is typically referred to as the historic burn rate. Historic payments should be analysed for statistically significant trends. If an unusually high number of series display trends and these trends have a plausible explanation then de-trending of raw weather data or historic payments may be necessary.
In some situations, there may be few years of data available, making the estimate of the historic burn rate unreliable. In this case it may be prudent to use a historic burn rate that corresponds to the highest value in the 95% confidence interval of the estimate.
5.4. Using the spatial structure of weather to increase efficiency
The portfolio approach to ratemaking outlined in this section is based on Bühlmann’s Credibility Theory (Bühlmann, Reference Bühlmann1967; Herzog, Reference Herzog1999, Mahler & Curtis, 2001). This is one of the simplest portfolio approaches to pricing and can be easily implemented in Excel. There are, of course, more advanced statistical methods that could be applied and may be more efficient than this methodology.
Standalone approaches to ratemaking will take the historic burn rate as the estimate for the pure premium rate. However, such a standalone approach is likely to be inefficient for reasons described above. One might instead begin with an uninformative symmetric prior belief over the claim payment distribution for all products. Suppose that all products are fixed and the challenge is to determine premiums then Bühlmann’s Credibility Theory would suggest the following steps.
First, partition products into risk collectives. This classification should be based on sound agronomic, spatial or practical reasons. No two products in the same risk collective should be based on the same weather station data. One possible rule would be that all products designed for the same crop in the same political or agronomic region form a risk collective.
Second, rate all products in a risk collective together. Let us index products by i and years with loss cost histories by j. Denote:
∙ N=the number of products in the risk collective to be considered;
∙ n i=the number of years of history for product i;
∙ LCij=the historic loss cost (payment/sum insured) for product i and observation j;
∙
 $$\overline{n} ={\textstyle{1 \over N}}\mathop{\sum}\nolimits_{i=1}^N \,n_{i} $$
=the average number of years of loss cost history within the risk collective;
$$\overline{n} ={\textstyle{1 \over N}}\mathop{\sum}\nolimits_{i=1}^N \,n_{i} $$
=the average number of years of loss cost history within the risk collective;∙
${\overline{{{\rm LC}}} }_i ={\textstyle{1 \over {n_{i} }}}\mathop{\sum}\nolimits_{j=1}^{n_{i} } \,{\rm LC}_{{ij}} $
=the average historic loss cost for product i;∙
$\overline{{{\rm LC}}} ={\textstyle{1 \over N}}\mathop{\sum}\nolimits_{i=1}^N \,{\overline{{{\rm LC}}} }_i $
=the average of average historic loss costs within the risk collective.


For illustration, assume that uniform take up is expected across all products in the risk collective. Then, Bühlmann’s Credibility estimate of the pure premium for product i is  $Z{\times}{\overline{{{\rm LC}}} }_i {\plus}(1{\minus}Z){\times}\overline{{{\rm LC}}} $
where Bühlmann’s Credibility Factor Z is given by
$Z{\times}{\overline{{{\rm LC}}} }_i {\plus}(1{\minus}Z){\times}\overline{{{\rm LC}}} $
where Bühlmann’s Credibility Factor Z is given by
 $${{n_{i} } \over {n_{i} {\plus}{\displaystyle{{E[s^{2} (\theta )]} \over {{\rm VAR}[m(\theta )]}}}}}$$
where
$$\eqalignno{ E[s^{2} (\theta )] & =\mathop{\sum}\limits_{i=1}^N \,\mathop{\sum}\limits_{j=1}^{n_{i} } \,{{({\rm LC}_{{ij}} {\minus}{\overline{{{\rm LC}}} }_i j)^{2} } \over {N(n_{i} {\minus}1)}}{{n_{i} } \over {n_{i} {\plus}{\displaystyle{{E[s^{2} (\theta )]} \over {{\rm VAR}[m(\theta )]}}}}} \cr {\rm VAR}[m(\theta )] & =max\left( {{1 \over {N{\minus}1}}\mathop{\sum}\limits_{i=1}^N \,(\overline{{{\rm LC}_{i} }} {\minus}\overline{{{\rm LC}}} )^{2} {\minus}{{E[s^{2} (\theta )]} \over {\overline{n} }},0} \right) $$
Bühlmann interpreted Z as the credibility of each individual data series, as it satisfies intuitive properties. It increases if:
∙ There is more data for the product itself.
∙ The variation of historic losses for the product itself decreases.
∙ Data from other risks in the collective is statistically less relevant. (This is based on the relationship between the within-product and the between-product volatility.)
5.5. Designing products with target premiums or premium rates
The procedure in the previous section assumes that the free parameter is the premium rate. The free parameter could instead be a product design parameter, to be set with a target premium in mindFootnote 1.
6. Risk financing
Like all insurers, providers of crop microinsurance need to have a plan for the inherent risk that comes with underwriting policies. However, correlation of claims can make this problem especially difficult for aspiring microinsurance upstarts. Most early micro-credit organisations started locally, building a small customer base and steadily expanding. But for crop microinsurance, this strategy is a lot more difficult. As agricultural risks are highly spatially correlated, an insured shock will spur a large number of claims from the affected area. Unless the insurer has extremely diverse coverage or extremely deep reserves, they may have trouble meeting claims in a rough season. Ideally, insurers would hold such a diverse portfolio that the chance of having exorbitant claims in any given year is minimal, but suddenly attracting many customers in new markets is not generally feasible. Therefore, many crop microinsurance providers seek to pass on the risk to other parties.
There are a number of mechanisms that microinsurance providers could use to bear the risk of a crop microinsurance venture. The following paragraphs describe some of these approaches.
Self-financing: If an insurance company is sufficiently diversified with ample cash reserves, it can bear the risk itself. As long as the company can afford to bear this risk, this is best option, as any form of risk transfer will come at a cost. However, due to the fact that crop insurance claims are highly correlated, this can be a big problem in practice and most crop microinsurance schemes transfer their risk in some way.
Mutuals: In much of the developing world, risk mitigation is provided through informal risk-sharing agreements. Therefore, a natural first step towards establishing formal insurance may be to set up a mutual insurance company. In this situation, the policyholders are the sole owners of the company, and therefore share all gains and losses together.
While this may seem like a natural arrangement, applying it to crop microinsurance has its pitfalls. The problem of correlation of claims that plagues self-financing may be an even bigger issue for a mutual, as they may find it harder to diversify. Assuming that claims are highly correlated, the mutual will need to have large capital reserves to cover payouts, and it will likely be difficult to raise this capital. Unless the mutual covers a wide enough area that its risk is diversified, it is unlikely to succeed on its own. One option would be for the mutual to purchase reinsurance. Another idea would be for mutuals to share risk among themselves through a Reciprocal Quota Share arrangement. In this set up, mutuals in different geographical locations (who should have uncorrelated risks) could share the risk of catastrophic events.
Cell captive: Another option for self-financing would be to set up a cell captive subsidiary to deal with index insurance. In this situation, an insurer could work with affiliated “cells”, which would design microinsurance products and share in both the profit and risk. This can be an attractive option for both sides, as a diversified insurance company may not have the local knowledge to develop new products, but the local organisation may not have the capital, expertise and regulatory permission to sell insurance on their own.
A cell captive will have different repercussions based on the regulatory environment of the company in which they are operating. In many countries, the cells can be set up as “ring fenced” individual entities, so if one cell went bankrupt the finances of the parent company or other cells would not be affected. This would be desirable for the parent, since it would allow it to give autonomy to the cell without exposing itself to too much risk.
Hollard, a South Africa-based insurance company, has taken this approach in developing a weather index product. They have agreed to underwrite insurance products designed by the microinsurance provider MicroEnsure, and their cell captive subsidiary will bear much of the risk. This arrangement has allowed MicroEnsure to provide products at more attractive prices than if they transferred the risk to international reinsurers. Note, however, that South African laws do not allow cells to be ring fenced, so Hollard is still exposed to the risk of its cells.
Reinsurance: Owing to the problems with self-financing, many sellers of crop microinsurance turn to international reinsurers to bear most of the risk of their ventures. Large reinsurers such as French Re, Swiss Re and Munich Re have highly diversified portfolios, so can afford the risk of localised crop insurance. The drawback of reinsurance is the price, with reinsurers typically asking for premiums far larger than the actuarially fair value, which squeezes the profits for local insurers and drives up rates for the end customer.
In order to make reinsurance more affordable and more sustainable in the long term, good sources of historical data are required. With the availability of reliable, accurate and indicative data, the large loadings in reinsurance premiums may be justifiably reduced and a greater choice of reinsurance may become available with more affordable terms.
Government: If providing protection to farmers from the significant downside risk inherent in agriculture is a government priority, the central or local government may offer explicit or implicit subsidies to insurance companies that serve target populations. Such subsidies could be ex ante, in the form of upfront premium subsidies or ex post, in the form of partial indemnification for aggregate claims. In addition, the government could simply provide a guarantee to assist an insurer with payouts in the event of a rare catastrophe.
For instance, the NAIS is an area-yield index insurance scheme provided by the government available throughout India. It has been successful in achieving wide coverage (over 19 million farmers were covered in 2008), partly attributable to the large subsidies from state and central government. The Indian government currently offers substantial ex post subsidies to the NAIS. From 1999 to 2006, the NAIS collected premiums that amounted to just over 30% of the claims that were paid out, resulting in ex post subsidy from government of around 607,000 crore (or around 133.5 billion USD at current exchange rates). Subsidies are higher for small/marginal farmers and farmers growing food crops or oilseeds, and lower for other farmers.
An alternative model for government involvement in microinsurance is that of the Mongolian Livestock Mortality Indexed Insurance programme. In this programme, insurance companies retain a working layer of risk. Different insurers pool together to pay a reinsurance premium to the government of Mongolia for reinsuring extreme risk layers. The reinsurance premium charged by the government is lower than what may have been available from commercial reinsurers due to a lower ambiguity loading, i.e., lower loading to allow for uncertainties of extreme losses. Once the government’s reinsurance layer is burnt through, a line of contingent credit is available from the World Bank. The Mongolian Livestock Mortality Indexed Insurance programme is a good example of where private and public partnerships are necessary for financing a microinsurance product.
CAT bonds: Catastrophe bonds allow the risk of microinsurance to be covered in small amounts by international investors. In theory, these bonds should provide good value as part of a diversified portfolio, as crop risk in the developing world is unlikely to be correlated with other risks undertaken by an investor (such as developed world stocks and bonds).
FONDEN, the Mexican natural disaster relief fund, is an example of a government buying a macro-index insurance product and is the first CAT bond issued in Latin America. The fund provides cover for the risk of earthquakes, as measured on the Richter scale. Part of the bond (US $160 million) is placed on the capital markets as CAT bonds and the remainder is reinsured.
Pooling: Community organised risk pooling can be used to reduce basis risk and insure idiosyncratic risks and also reduce the cost of insurance. Geographical risk spreading is feasible where complementary weather patterns are observed in different geographical regions. For example, in Africa a certain country may tend to have a dry season when a neighbouring country experiences a wet season. For example, Hess & Syroka (Reference Hess and Syroka2005) calculated premium savings of about 23% if Malawi and Tanzania were covered in a single insurance portfolio.
The Caribbean Catastrophe Risk Insurance Facility is the world’s first multinational index insurance scheme with 16 member countries, although it is not really a microinsurance scheme. By pooling together their country-specific risks, the reserves and reinsurance required by the pool reduces considerably as opposed to their risk capital requirements if each country had insured their catastrophe risks separately. CCRIF purchases reinsurance for the combined pool for events such as large, multi-island hurricanes.
7. Case studies
7.1. Deficit rainfall insurance: Malawi
7.1.1. Background
In 2005 the World Bank and insurance broker MicroEnsure launched a weather index insurance pilot for deficit rain risk in Malawi. The International Research Institute for Climate and Society at Columbia University provided scientific expertise to develop the initial product. The insurance is linked to a bank loan for each farmer, allowing access to funding for high-quality seeds and fertilizer. A collection of nine insurance companies underwrote the risk in the 1st year. After the product was shown to be successful, the risk has been subsequently underwritten in the international insurance market.
The 1st year of the pilot included groundnut farmers. The farmers purchased index insurance covering deficit rainfall, which was included with a loan agreement for improved farming inputs. The 2005 pilot year included 892 farmers located near four different weather stations on which the deficit rainfall was based. In the 2006 season the coverage was expanded to include maize in conjunction with the purchase of groundnut coverage. The groundnut pilot was discontinued after the 2nd year. In practice, farmers found other markets to sell their produce than the agreed markets and defaulted on their loans.
After the first 2 years the programme moved to the tobacco sector because it has a reliable built-in mechanism for loan repayment. The Opportunity International Bank of Malawi purchased the index insurance policy, which covered tobacco farmers located near two weather stations. Though the policy was designed to insure the bank’s portfolio of loans to tobacco farmers, the contract was based on individual insurance policies so that the companies could easily associate payouts from particular stations to farmer groups and crops. The cost of the insurance was shared with the farmers.
During the 2008 and the 2009 cropping seasons the pilot programme was expanded to include additional tobacco clients and organisations with both meso- and micro-level products. Two additional banks agreed to participate in financing the bundled insurance and loan product. During the 2008 cropping season, the pilot covered 2,500 farmers and the total transaction value was in excess of US $2 million. Future scale-up plans for weather index insurance are being considered, particularly within formal and well-coordinated supply chains. Malawi has a well-sourced supply of weather stations – many of them recently installed as shown in Figure 3.
Figure 3 Installed weather stations in Malawi.
7.1.2. Deficit rainfall weather index product
The initial product design divided the crop growing season into three periods. If the rainfall was below a certain trigger level in each of these three periods a payout would be made. The lower the rainfall the higher the payout, up to a maximum of 100% of the sum insured. Agro-meteorological data was used in the FAO Water Requirement Satisfaction Index to calculate the rainfall triggers below which payments would be made. The coverage period of the insurance was matched to the growing period of the crop. A dynamic start date for the insurance contract was also included so that the insurance coverage starts when there is sufficient rainfall for germination in the month farmers typically sow. Discussions were held with farmers in the pilot to understand better their practices and to ensure these were closely in line with the contract design.
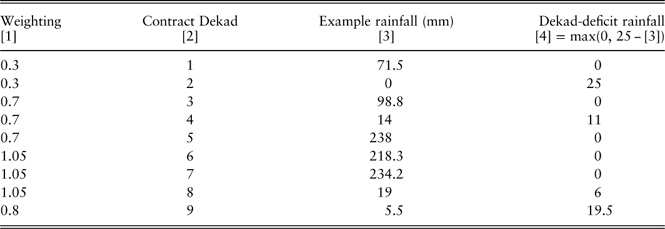
After the first 2 years the contract was modified by MicroEnsure to allow for lessons learned. It was found that by having just three phases over a typical 90-day contract that the product had some issues of basis risk. It is possible that there is a no rainfall until the last few days of a 30-day phase. This would lead to potentially drought-like conditions at the start of the phase without a payout. The improvement taken was to split the contract into nine 10-day (10 days is a“dekad” in agronomic terminology) phases. Each phase had a trigger below which deficit rainfall would be calculated. The deficit rainfall in each of the nine phases was given a different weighting according to crop water requirements during these phases. By applying these weights to the deficit rainfall in each phase and overall weighted deficit rainfall (OWDR) level was developed. This overall weighted deficit rainfall is then subject to a trigger on which payouts are made.
The OWDR is calculated by the sum product of columns (1) and (4). In this example this is 37.1. A trigger for the OWDR can then be calculated as part of the product design process so a payout may be generated if the OWDR is above 50, for example.
7.1.3. Conclusions
The pilot in Malawi has highlighted some of the key issues with weather index insurance (Table 1).
Table 1 Example of deficit rainfall product with trigger of 25 mm.
An early decision to tie the weather index insurance to a loan meant that farmers were willing to accept the cost of the insurance to have access to bank loans. The banks understood their exposure to higher defaults due to droughts has been reduced.
The importance of the agricultural supply chain was highlighted with the failure to ensure loan repayment from the groundnut farmers and the successes when moving to tobacco farmers, where the markets are fixed.
The weather index insurance products themselves can be refined and improved as local experience is gained.
When a successful pilot has been established, action to scale the project up can be taken.
7.2. Typhoon weather index insurance – the Philippines
7.2.1. Background
The Philippines is heavily reliant on agriculture and it is estimated that the average farm size is 2 ha. This suggests a large number of smallholder farmers and a large potential market for weather index insurance. Questionnaires and focus groups held by an insurance broker in 2007 and 2008 on the Philippines island of Panay confirmed that typhoon risk is the biggest perceived risk among the small holder farmers questioned.
Typhoon weather index insurance was piloted in 2009 by MicroEnsure to cover 446 smallholder rice farmers in the Philippines from high wind speeds. The pilot involved partnering with rural banks and MFIs that act as delivery channels for the product. The product is tied to a loan from the rural bank/MFI to provide financing for farm inputs. The weather index insurance removes a significant default risk across the banks/MFIs loan portfolio. The weather index insurance is insured by the Malayan Insurance Company, marketed with loans offered by rural banks/MFIs and reinsured by Paris Re.
In the Philippines a government multi-peril product is available to farmers. Farmers in the pilot had experienced the government multi-peril product and claimed to be dissatisfied with the level of previous payouts and the length of delay in making such payouts. If a claims assessor takes 2 months before visiting a field, the farmer is obliged to leave the field in a damaged state for this period.
7.2.2. Typhoon weather index insurance product design
The GPS latitude and longitude for each farmer or farmer group is recorded (typically the farmer’s field is within 2 km of any GPS reading used for the farmers contract).
The index for claim payments is based on “Typhoon tracks” that give the location (latitude and longitude) and wind speed of typhoons in real time as the typhoon occurs. These “Typhoon tracks” are made freely available by the Japanese Meteorological Authority.
Insured farmers with a GPS point within a certain distance of the typhoon track, which has a certain wind speed, will receive a payout.
Payouts will be based on distance of the farmer’s GPS point from the typhoon track and the wind speed of the typhoon at that point. i.e., Payout=w×d×s; where w is the wind speed factor, d the distance factor and s the sum insured. In the example below, the distance d is measured using the GPS points of the farmer’s field and the typhoon track. The numbers at each track point are the wind speed of the typhoon at those points.
7.2.3. Product development
The key determinants of payout sizes are the distance from the farmer to a typhoon track and the wind speed of the typhoon at that point. Payout=Distance factor×Wind speed factor×Sum insured.
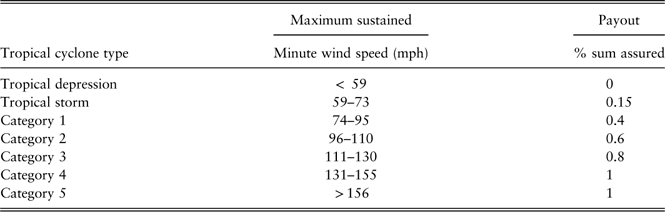
The wind speed factors used are given in Table 2.
Table 2 Wind Speed Factors used for typhoon index.
Distance factor:
∙ 100% of the payout for tracks within 100 km radius;
∙ (max(140−Distance(km),0)/(140−100))% for tracks up to 140 km radius;
∙ 0% for tracks over 140 km.
This product design was tested against crop loss data over the whole Philippines. Payouts at an aggregate level across the Philippines were found to correlate well with recorded crop losses. The product was also tested against the questionnaires put to farmers. The farmers on the island of Panay where the product was piloted were asked to detail the years in which they recalled suffering losses due to typhoons. Again the years significant payouts would have been made correlated well with the years Panay farmers recorded crop losses.
The product had an unknown level of basis risk before launching the pilot, so it was combined with a government multi-peril product that was subsidised by the insurance broker.
7.2.4. Project results
There were no typhoons in the pilot area of sufficient wind speed to trigger payouts of the weather index insurance during the piloting periods. However, a number of claims in the region were recorded under the multi-peril scheme in the region of 10%–30% of sum insured. The government scheme recorded these as due to typhoon; even in cases where the nearest typhoon was over 3,500 km away; also rainfall during these claim periods were low. The view from the local insurance broker was that these claims paid were not serious damage to the farmer’s field warranting payouts.
7.2.5. Product improvements
The product is planned to be improved in two significant ways.
The distance parameter is currently based on two distances which are fixed for all typhoons. In the real-time typhoon track data, the radius of 50 knot and 30 knot wind speeds are given. These radii could be used as the distance parameters.
Intense rainfall can also cause significant damage during typhoons and is intended to be added to the index. In particular, a typhoon with low wind speed and high rainfall would not be picked up well by the current product. There are very few rain gauges in the Philippines, making this step more difficult. The options being explored are as follows.
Funding rain gauges across the regions of the Philippines where this product will be sold.
Using some form of satellite rainfall estimation technique. Satellite rainfall estimators are not particularly accurate for high rainfall events, so this approach is considered less likely to be successful.
7.2.6. Conclusions
The pilot has shown it is possible to develop weather index insurance to cover typhoon risk. Further improvements to the product are being developed for future use.
The piloting period did highlight one of the problems with multi-peril products in that claims were potentially wrongly paid with weather index insurance payments based on objective indices.
One of the main problems with weather index insurance is that these indices do not accurately represent the damage in a farmer’s field – i.e. basis risk. However, for a loan portfolio across a reasonably sized area the losses to the bank due to defaults as a result of typhoon damage are reduced. This has meant banks are more willing to lend to farmers if such insurance is in place. This can provide much needed capital investment into Philippines agriculture.
This pilot is also an example of using weather parameters from satellite, which means the distribution is not tied to nearby weather stations.
7.3. Crop insurance in India
Despite a declining share in national GDP, two-thirds of India’s total population – including millions of small and marginal farmers – are dependent on agriculture. For them, crop insurance forms an important element of risk mitigation. The Government of India has long considered crop insurance as a mechanism that can contribute to increasing access to rural finance and ensure a more viable agriculture credit business. Further, given the inherent risks in agriculture in India with its high degree of dependence on rain-fed cultivation, a well-developed and widely used agriculture insurance programme is considered to be critical from a farmer perspective.
The Government of India is responsible for the world’s largest crop insurance programme with 25 million farmers insured. The NAIS is the main crop insurance programme in the country, and in states and union territories that choose to participate, insurance for food crops, oilseeds and selected commercial crops is compulsory for all farmers that borrow from financial institutions and is voluntary for non-borrowing farmers without loans. The NAIS operates on an area-yield-indexed basis, whereby claim payments to farmers depend on the average yield of the insured crop measured across the insurance unit, typically an administrative block, in which they live. Area-yield-indexed crop insurance offers a middle ground between indemnity-based multiple peril crop insurance and weather-based index-based weather insurance. It provides the potential for a greater resilience to moral hazard, fraud and adverse selection than indemnity insurance and lower basis risk (the risk of a mismatch between incurred losses and indexed claim payments) than the latter.
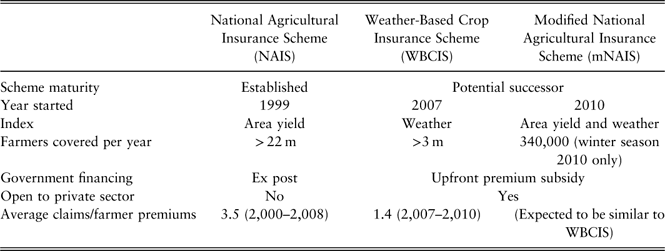
In addition, the NAIS government is currently piloting two potential successor programmes, the Weather-Based Crop Insurance Scheme (WBCIS) and the Modified National Agricultural Insurance Scheme (mNAIS). Table 3 offers a high-level comparison of the three programmes.
Table 3 Government crop insurance in India.
Note. Mahul et al. (Reference Mahul, Clarke and Verma2012).
Under the current system state governments are able to choose between the above three programmes for each crop and each district. The insurance coverage selected by the State government is then added as a compulsory addition to loans to farmers for production purposes, and is available for all other landowning farmers to purchase on a voluntary basis.
For further information about the WBCIS see Clarke et al. (Reference Clarke2012a) and for further information about the actuarial approach to design and ratemaking for the mNAIS see Clarke et al. (Reference Clarke, Mahul, Rao and Verma2012b).
8. Areas for further work
We had like to highlight four main outstanding issues in the further development of index insurance:
∙ How can index insurance be expanded to places where there is no historical data or no current measurement of valid indices?
∙ How can basis risk further be reduced?
∙ How can demand for index insurance be increased?
∙ What is the effect of index insurance on livelihood?
One of the main issues with weather index insurance is use of available index data. Weather index insurance requires real-time data to provide an index on which claims are paid, and also requires historic data to enable pricing of weather index insurance contracts by the risk carriers. This is a challenge in developing countries, as weather gauges are very limited and there may not be good historical data available. Using satellite data has been discussed above, but there an improvement in designing contracts based on satellite data could spur the expansion of weather insurance coverage. An alternative approach is to install rainfall gauges in areas where weather index pilots are being carried out – the economic viability of installing rain gauges for weather index insurance could be explored in further work.
It is clear that for index insurance to be successful, it must come with as little basis risk as possible. Again, this is one area where improved data (potentially from satellites) could play a big role. In addition, it would be helpful to better understand the correlation between crop output and measurable weather indices. This could allow contracts to be written where the insurance payout would more closely mirror actual crop yields. For instance, most index insurance with drought coverage currently uses rainfall as the index, but soil moisture may be a more accurate measure of crop yields than rainfall.
Insurance demand has been persistently low for index insurance in many different implementations around the world, especially when insurance is unsubsidised and sold unbundled from other products. An in-depth study of willingness-to-pay for rainfall index insurance in India showed most subjects would only buy insurance when priced well below their actuarially fair value (Cole et al., Reference Cole, Stein and Tobacman2011). While it is possible that people will begin to adopt insurance once they have learned a bit more about the product by witnessing payouts, some recent studies cast doubt on that prediction (Hill & Nobles, Reference Hess and Syroka2010; Stein, Reference Stein2014).
Improving the products and decreasing their cost will likely help demand, but one potential idea to improve the products is to combine insurance with savings or loans. One of the possible benefits of crop insurance is access to credit, and this can be formalised by offering insurance as a package with a loan. This has been done successfully by the Agricultural Insurance Company of India through their WBCIS programme and by the non-profit organisation MicroEnsure. However, it is difficult to know whether the demand for insurance linked to loans just comes from people being credit constrained. For instance, a field experiment in Malawi showed that customers were less likely to take up a loan if it was bundled with insurance (Giné & Yang, Reference Giné and Yang2009).
In addition, insurance could be combined with savings, with an account where the rate of return of the savings changes based on the weather. Using an example of rainfall insurance, this type of account would give an interest rate boost if drought conditions (as determined by an index) occurred. Of course, this would come at a cost of a lower rate in times of “good” rainfall, but the benefit of having extra money during a drought may be attractive to customers. If consumers are unfamiliar with insurance but comfortable with savings, they may be more likely to take part in a savings scheme with some elements of insurance than a standalone insurance product. However, preliminary research on the potential demand for such a product has not been encouraging (Stein & Tobacman, Reference Stein and Tobacman2014).
Finally, it remains an open question as to the exact benefits rainfall insurance will give to its customers. Will it really help consumption smoothing, or will it just crowd out informal risk coping mechanisms (as explored in Mobarak & Rosenzweig, Reference Karlan, Osei, Osei-Akoto and Udry2013)? Will it spur higher agricultural investment (Karlan et al., Reference Hill and Nobles2012; Cole et al., Reference Clarke, Mahul and Verma2013)? Careful study is needed to assess these and other potential impacts.
9. Conclusions
Weather risk is a major issue faced by millions of low-income farmers throughout the world. Weather index insurance provides a way for farmers to manage this risk that is potentially beneficial to the farmers while remaining a viable product for the counterparty (an insurance company, government, etc.) While it holds great promise, weather index insurance schemes have a mixed track record of success, and the products are constantly improving in an attempt to overcome previous challenges. One of the great promises of weather index insurance was that it theoretically could be provided as a standalone product in the marketplace, bringing benefits to both customers and insurers. However, early trials cast doubt on this model, as customers failed to respond to the products.
Despite these challenges, weather index insurance continues to proliferate around the world, as interested parties search for the best ways to mitigate weather risk. While selling standalone products at market rates has been difficult, other models such as tying insurance to loans or selling insurance to organisations has been more successful. Given the vast amount of demand for mitigation or weather risk, weather index insurance is sure to play an important in the market. As these products are constantly evolving, this field is ripe for innovation and experimentation.
Acknowledgements
This paper is part of a larger programme of work on microinsurance conducted by the UK Actuarial Profession’s working party on microinsurance. The views expressed in this publication do not necessarily reflect the views of our respective employers or the Profession. A number of others have provided support and useful comments on aspects of the paper; without implicating them in the shortcomings of the work, we thank Bertha Liverpool, Ralf Radermacher, Vyasa Krishna, Scott Brown and participants at the UK General Insurance Convention, 2010.