


Introduction
The common bean (Phaseolus vulgaris L.; 2n = 2x = 22) is a crop of major importance consumed worldwide. It is a predominantly self-pollinating crop with a genome size of 587 Mbp (Broughton et al., Reference Broughton, Hernandez, Blair, Beebe, Gepts and Vanderleyden2003; De Ron et al., Reference De Ron, Papa, Bitocchi, Gonzalez, Debouck, Brick, Fourie, Marsolais, Beaver, Geffroy, McClean, Santalla, Lozano, Yuste-Lisbona, Casquero and De Ron2015). It is regarded as a staple food in many developing countries and cultivated in tropical, sub-tropical and temperate regions (Pathania et al., Reference Pathania, Sharma, Sharma, Singh, Bisht and Dutta2014). The crop ranked third among legumes (De Ron et al., Reference De Ron, Papa, Bitocchi, Gonzalez, Debouck, Brick, Fourie, Marsolais, Beaver, Geffroy, McClean, Santalla, Lozano, Yuste-Lisbona, Casquero and De Ron2015), with 33.06 million hectares produced globally (FAO, 2019). Beans are high in proteins, carbohydrates, vitamins, and minerals and known for having therapeutic characteristics (Bressani, Reference Bressani1983; Broughton et al., Reference Broughton, Hernandez, Blair, Beebe, Gepts and Vanderleyden2003; Shevkani et al., Reference Shevkani, Singh, Kaur and Rana2015). Bean production is the main source of income for the majority of rural and urban people.
Common beans cultivated in the Union territory of Jammu and Kashmir's North-Western Himalayas are known for their particular flavour and taste. In terms of market classes, plant type, seed quality traits and agro-ecological adaptations, the landraces and farmer varieties grown in this region are diverse. This is due to the differential adaptative evolutionary process that occurred as a result of its introduction to the Indian subcontinent by various Portuguese, England, Dutch and French explorers in the 16th century (Joshi and Mehra, Reference Joshi and Mehra1984; Rana et al., Reference Rana, Sharma, Tyagi, Chahota, Gautam, Singh, Sharma and Ojha2015). Green bean and dry bean average yields globally are 163,555 and 8741 kg/ha, respectively (FAO 2019). The yield of common beans in Jammu and Kashmir is 0.8 tonnes per hectare (Choudhary et al., Reference Choudhary, Bawa, Paliwal, Singh, Bhat, Mir, Gupta, Sofi, Thudi, Varshney and Mir2018). Based on its origin and domestication, the common bean mainly comprises of the Andean gene pool from the Andes mountains of South America and the Mesoamerican gene pool from Central America and Mexico (Gepts and Debouck, Reference Gepts, Debouck and Schoonhoven1991; Singh et al., Reference Singh, Gepts and Debouck1991a). The two gene pools can be distinguished based on morphological (Singh et al., Reference Singh, Nodari and Gepts1991b), biochemical (Gepts et al., Reference Gepts, Osborn, Rashka and Bliss1986) and molecular markers (Blair et al., Reference Blair, Giraldo, Buendia, Tovar, Duque and Beebe2006; Diaz and Blair, Reference Diaz and Blair2006). To determine genetic diversity and population structure in beans, and generate new varieties and conserve genetic resources, knowledge of their origin and evolutionary history is required (Bitocchi et al., Reference Bitocchi, Nanni, Bellucci, Rossi, Giardini, Zeuli, Logozzo, Stougaard, McClean, Attene and Papa2012). The crop improvement programme involves the identification of phenotypic and molecular diversity and further determination of quantitative trait loci (QTL) controlling agronomic traits. Genetic diversity in beans had been analysed using simple sequence repeats (SSRs) (Sharma et al., Reference Sharma, Diaz and Blair2013; Carovic-Stanko et al., Reference Carovic-Stanko, Liber, Vidak, Baresic, Grdisa, Lazarevic and Satovic2017), inter simple sequence repeat (Gill-Langarica et al., Reference Gill-Langarica, Muruaga-Martinez, Vargas-Vazquez, Rosales-Serna and Mayek-Perez2011; Cabral et al., Reference Cabral, de Souza, da Costa, Silva and Soares2018) and random amplified DNA polymorphism (RAPD) markers (Tiwari et al., Reference Tiwari, Singh, Rathore and Kumar2005; Chiorato et al., Reference Chiorato, Carbonell, Benchimol, Chiavegato, Santos Dias and Colombo2007; Bukhari et al., Reference Bukhari, Bhat, Ahmad and Saleem2015). At the inter-specific, inter-subspecific, inter-varietal and even intra-varietal levels, microsatellite markers are considered to be the most important for determining genetic diversity in crops and their wild relatives (Mitchell et al., Reference Mitchell, Kresovich, Jester, Hernandez and Szewc-McFadden1997; Matus and Hayes, Reference Matus and Hayes2002). Microsatellites, also known as simple sequence repeats, are two to six nucleotides tandem repeats found between segments of non-repeated DNA (Hancock, Reference Hancock, Goldstein and Schlotterer1999). These are polymorphic, codominant, multi-allelic, widely distributed over the genome, reproducible and found in both the coding and non-coding region of genes (Blair et al., Reference Blair, Soler and Cortes2012). Linkage analysis and QTL mapping employing a biparental mapping population has traditionally been used to determine the genetic basis for simple or complex traits in beans. It is a time-consuming procedure that only takes into consideration few recombination events resulting in low mapping resolution (Flint-Garcia et al., Reference Flint-Garcia, Thuillet, Yu, Pressoir, Romero, Mitchell, Doebley, Kresovich, Goodman and Buckler2005). On the other hand, association mapping has emerged as the most potent approach in gene mapping for identifying genes governing traits of interest. It involves a diverse natural population with high resolution mapping (Flint-Garcia et al., Reference Flint-Garcia, Thuillet, Yu, Pressoir, Romero, Mitchell, Doebley, Kresovich, Goodman and Buckler2005; Yan et al., Reference Yan, Warburton and Crouch2011). To find markers linked with yield attributing traits in common beans, association mapping studies were conducted (Nemli et al., Reference Nemli, Asciogul, Kay, Kahraman, Siyok and Tanyolac2014; Gupta et al., Reference Gupta, Zargar, Singh, Nazir, Mahajan and Salgotra2020; Lei et al., Reference Lei, Wang, Wang and Wu2020; Mir et al., Reference Mir, Choudhary, Bawa, Jan, Singh, Bhat, Paliwal, Kumar, Chitikineni, Thudi and Varshney2021). In common bean, yield is primarily determined by the number of pods per plant, seeds per plant and 100 seed weight, all of which are positively correlated with yield (Bezaweletaw et al., Reference Bezaweletaw, Belete and Sripichitt2006; Ribeiro et al., Reference Ribeiro, Filho, Poersch, Jost and Rosa2008; Beebe et al., Reference Beebe, Rao, Blair and Acosta-Gallegos2013; Rao et al., Reference Rao, Beebe, Polania, Grajales, Cajiao, Ricaurte, Garcia and Rivera2017). In this study, 100 common bean genotypes were phenotypically evaluated using nine agronomical traits related to yield, and genetic variability, as well as population structure within the germplasm, was assessed using 32 SSR markers. Furthermore, the markers linked to yield attributes were identified.
Materials and methods
Plant material
A total of 100 accessions of common bean were evaluated in this study, including local landraces, wild and improved genotypes collected from different areas of Jammu & Kashmir. Released/improved genotypes had been procured from Central Pulse Research Institute, ICAR, Kanpur and VPKAS, Almora. Indigenous and exotic lines were procured from the National Bureau of Plant Genetic Resources (NBPGR, ICAR), Shimla (online Supplementary Table S1).
Phenotypic evaluation of germplasm
The collected diverse 100 genotypes of common bean were grown in a randomized block design in three replications during the month of April–May with row length of 2 m and spacing of 0.5 m and harvested in August to September depending upon the maturity period of accessions. The evaluation was done for different agro-morphological traits at Regional Horticulture Research Sub Station, SKUAST-J, Bhaderwah (J&K) 32° 58′ 45.88″ N and 75° 43′ 2.03″ E, 1613 m altitude for one year (2018). Recommended agronomic practices were followed. The agronomic traits like days to bud initiation, days to flowering, days to fruiting, pod length, pod width, total number of pods per plant, total number of seeds per plant, 100 seed weight and seed yield per plant were measured. The pooled analysis of variance for nine traits was performed and analysed using OPSTAT (CCS HAU, Hisar) (Sheoran et al., Reference Sheoran, Tonk, Kaushik, Hasija, Pannu, Hooda and Hasina1998). The range was calculated in excel. Phenotypic and genotypic coefficients of variation (PCV and GCV) for each trait were calculated as PCV = √V P/mean × 100, GCV = √V G/mean × 100 as per Burton (Reference Burton1952) and categorized the range as per Sivasubramanian and Madhavamenon (Reference Sivasubramanian and Madhavamenon1973) where PCV and GCV >20% is considered as high, 10–20% as moderate and below 10% as low. The correlation coefficient between the traits was done using SPSS statistical software (SPSS 16.0).
Genomic DNA isolation
The genomic DNA was extracted from young trifoliate leaf samples using the CTAB method (Doyle and Doyle, Reference Doyle and Doyle1987). DNA quality was checked on 0.8% agarose gel. The DNA concentration for each sample was determined spectrophotometrically by measuring the absorbance at 260/280 nm using Nanodrop. It was diluted to a final concentration of 50 ng/μl for further use.
SSR markers
Out of 121 markers, 32 highly polymorphic SSR markers with a known position on 11 chromosomes were selected for the evaluation of the genotypes based on their high polymorphism, the maximum number of alleles, stable amplification and distribution on 11 linkage groups (Gaitan-Solis et al., Reference Gaitan-Solis, Duque, Edwards and Tohme2002; Blair et al., Reference Blair, Giraldo, Buendia, Tovar, Duque and Beebe2006; Leite et al., Reference Leite, Santos, Carneiro and Couto2011) (online Supplementary Table S2). The concentration of the primers was made up to 10 μM and stored at −20 °C. The selected primers were synthesized from Sigma-Aldrich, Bangalore, India.
PCR and SSR marker analysis
PCR amplification was carried out in 96-well Universal Gradient Thermal Cycler in a 15 μl reaction mixture. The reaction mixture contained 1 μl genomic DNA (50 ng), 0.2 μM of each forward and reverse primers, 0.5 U of Taq polymerase (D1806-Sigma-Aldrich, USA), 1× PCR buffer with MgCl2, 0.2 mM dNTPs. Amplifications were performed using the following programme: 94 °C for 4 min, followed by 30 cycles of 94 °C for 30 s, 47–56 °C for 30 s, 72 °C for 30 s, with a final extension of 72 °C for 8 min. PCR products were mixed with 6× loading dye (Thermo Scientific # R0611, Waltham, Massachusetts, USA) (2 μl) and resolved on 3% metaphor agarose gel.
Data analysis
The band of each amplified DNA fragment represents the alleles of each SSR locus. Allele differences were determined by their relative mobility in gel and the size of each allele was estimated using 100 bp DNA Ladder (3407A Takara). When a PCR product was not amplified, data for the relevant genotype were treated as a null allele. Various parameters such as polymorphism information content (PIC) (Botstein et al., Reference Botstein, White, Skolnick and Davis1980), number of alleles, gene diversity (Nei, Reference Nei1987), heterozygosity and major allele frequency were also calculated using Power Marker software version 3.25 (Liu and Muse, Reference Liu and Muse2005). A pair-wise distance matrix was calculated using DARwin version 5.0. Further, a dissimilarity matrix was constructed and cluster analysis was performed using an unweighted neighbour-joining algorithm (Perrier and Jacquemoud-Collet, Reference Perrier and Jacquemoud-Collet2006). The dendrogram was made by bootstrap analysis with 1000 permutations. Also, principal coordinate analysis (PCoA) was calculated using DARwin version 5.0 (Perrier and Jacquemoud-Collet, Reference Perrier and Jacquemoud-Collet2006).
Population structure analysis
STRUCTURE version 2.3.4 software (Pritchard et al., Reference Pritchard, Stephens and Donnelly2000) was used to assign individuals to a population i.e. to determine the number of subpopulations present in common bean germplasm in the present study. The data were run with a preset number of populations (K) ranging from 1 to 10. For each K, 10 independent simulations were performed using the admixture model, correlated allele frequencies and 150,000 replicates both in the burn-in and Markov chain Monte Carlo analysis. By plotting the mean estimate of the log posterior probability of the data L (K) against the given K value, the optimum K value was interpreted. The true number of subpopulations was identified using the maximal value of L (K). An ad hoc quantity ΔK proposed by Evano et al. (Reference Evano, Regnaut and Goudet2005) showing a clear peak at the optimal K value was determined using Structure Harvester (Earl and von Holdt, Reference Earl and von Holdt2012). The STRUCTURE bar plot was drawn using the STRUCTURE software (Pritchard et al., Reference Pritchard, Stephens and Donnelly2000). The genotypes were assigned to a given cluster when the proportion of its genome in the cluster (qK) was higher than a standard threshold value of 80%. The level of genetic differentiation or Wright fixation index of F statistics (F ST) simultaneously between the different bean subpopulations was also determined (Wright, Reference Wright1951). Further, analysis of molecular variance (AMOVA) was performed by GenALEx 6.51 (Peakall and Smouse, Reference Peakall and Smouse2012).
Marker-trait association
The morphological data of yield attributing traits of common bean were subjected to association analysis with 32 polymorphic SSR markers based on the general linear model (GLM) based on the Q-matrix and mixed linear model (MLM) based on both the Q-matrix and the kinship matrix (K-matrix) using the software TASSEL 3.0 (Bradbury et al., Reference Bradbury, Zhang, Kroon, Casstevens, Ramdoss and Buckler2007). The significance of marker-trait association (MTA) was identified by determining P-value (P ⩽ 0.005 for significant markers) for each SSR marker. The magnitude of phenotypic variation was determined using a likelihood-ratio-based R 2 value (Sun et al., Reference Sun, Zhu, Kramer, Yang, Song, Piepho and Yu2010).
Results
Agronomic traits
A wide range of variation was observed for days to bud initiation, days to 50% flowering, days to fruiting and the seed-related traits like seeds per plant and 100 seed weight. The least range of variation was observed for pod width. The variability was also found for PCV (phenotypic coefficient of variation) and GCV (genotypic coefficient of variation) for the traits under study. The PCV for pod width, pods per plant and seed yield per plant was found to be higher than GCV. For traits like days to bud initiation, days to 50% flowering, days to fruiting, pod length, seeds per plant and 100 seed weight, PCV and GCV values were closer. Highest PCV (35.14%) and GCV (34.67%) were found for seed yield per plant followed by seeds per plant and 100 seed weight while the lowest PCV (9.12%) and GCV (8.64%) were found for pod width. Moderate PCV and GCV values were observed for days to bud initiation, days to 50% flowering, days to fruiting, pod length and pods per plant (Table 1).
Table 1. Variability parameter estimates for nine characters in common bean

Correlation analysis revealed a highly significant positive correlation between days to bud initiation and days to 50% flowering (r = 0.996**), days to 50% flowering and days to fruiting (r = 0.994**), days to bud initiation and days to fruiting (r = 0.987**). Also, a positive correlation was observed for yield traits such as number of pods per plant and seeds per plant (r = 0.889**), number of seeds per plant and seed yield per plant (r = 0.768**), number of pods per plant and seed yield per plant (r = 0.679**), 100 seed weight and seed yield per plant (r = 0.555**) (online Supplementary Table S3).
Allele diversity
Thirty-two polymorphic genic SSR markers across 11 chromosomes of common beans used in the present study are effective in discriminating 100 genotypes in the expected size range (Table 2). A total of 272 alleles ranging from 4 (X59469) to 18 (Pvag004) with an average of 8.5 alleles per locus were amplified on all the genotypes. The major allele frequency ranged from 0.142 (Pvag004) to 0.569 (BM142) with an average of 0.337. Gene diversity is the probability of two alleles being different while sampling at a locus. It ranges from 0.5876 (BM142) to 0.9222 (Pvag004) with an average of 0.7699. Heterozygosity varies from 0.01 (Bmd1) to 0.86 (X04660) with an average of 0.12. The informativeness of a genetic marker was determined using PIC. It is highly dependent on the number of alleles per locus and allele frequencies in the population and ranges from 0.502 (X59469) to 0.9169 (Pvag004) with an average of 0.736. All the SSR markers used in the study are highly polymorphic (PIC values higher than 0.5).
Table 2. Evaluation of polymorphism and discriminatory power of 32 polymorphic SSR markers

Genetic relationship among genotypes
The dendrogram was generated using SSR data to determine pair-wise distances between all possible pairs of 100 genotypes. The common bean genotypes were divided into three main clusters, namely I, II and III. Cluster II is further divided into two subclusters: IIa and IIb (Fig. 1). Cluster I contains 10 genotypes from NBPGR Shimla (six indigenous and four exotic), four from Kupwara Baramula, two from Pulwama and two from ICAR, Kanpur. Cluster IIa comprises nine genotypes from Bhadarwah, two from Shopian, eight from Poonch, 16 from NBPGR Shimla (10 indigenous and six exotic), five from Kupwara Baramula and three from ICAR, Kanpur. Cluster IIb comprises eight genotypes from Bhadarwah, nine from NBPGR Shimla (four indigenous and five exotic), four from Poonch, three from Shopian, one from Pulwama and one from Kupwara Baramula. Cluster III consists of few genotypes from NBPGR Shimla, ICAR Kanpur, Pulwama, Poonch and Bhadarwah. The local landraces of common bean collected from Jammu and Kashmir, India along with exotic and indigenous lines from NBPGR Shimla, ICAR Kanpur and VPKAS Almora were grouped. The PCoA also divided the genotypes into three groups (online Supplementary Fig. S1).

Fig. 1. Dendrogram depicting genetic relationship among 100 common bean genotypes using 32 SSR markers.
The most similar and dissimilar groups of genotypes were identified using dissimilarity coefficient values. The smaller the coefficient value higher will be the similarity while the larger value represents dissimilarity. The genotypes P1 and BR9 from Poonch and Bhadarwah were most similar with a value of 0.15. The genotypes BR1 and IC-265932; BR1 and KB9; BR2 and P14; PL3 and Hur15; BR4 and BR18; EC-398565 and VL63; EC-530898 and EC-755305; Utkarsh and EC-530898; PL2 and KB4 were highly dissimilar with a value of 0.98.
Population structure
STRUCTURE analysis was carried out to observe the number of populations from 100 genotypes using 32 SSR markers. Three subpopulations were detected. Based on membership probability (0.8), each genotype was assigned to one of the three subpopulations. The genotypes having a probability lower than 0.8 were considered admixture. Thirty-six individuals were categorized in subpopulation 1, 25 each in subpopulations 2 and 3 respectively and 14 genotypes showed admixtures (online Supplementary Table S4). The Evano test found a clear maximum for delta K at K = 3 in the plots of L (K) versus Delta confirming categorization of bean germplasm to three subgroups (Fig. 2). The individual membership coefficient at K = 3 from the STRUCTURE run had a maximum mean probability of likelihood value of L (K) = −10034.76 which led to the assignment of common bean germplasm to three (K = 3) subpopulations (Fig. 3). The expected heterozygosity is the probability at a given locus for two randomly chosen individuals to be different (heterozygous). It ranged from 0.7223 in the first subpopulation to 0.6971 in the second subpopulation with an average of 0.714 and F ST values from 0.1474 to 0.1908 with the mean value of 0.1656 for three subpopulations (online Supplementary Table S5).

Fig. 2. Plot of Delta K against subpopulation K with three subpopulations in common bean genotypes.

Fig. 3. STRUCTURE plot of membership coefficients for all the accessions of common bean in the study sample sorted in the same order and classified according to successive selected preset K values ranging from 1 to 10. For K = 3, the groups are identified.
Analysis of molecular variance (AMOVA)
AMOVA analysis was carried out on three common bean populations produced from structure analysis. The percentage of variation among populations, among individuals and within individuals was determined. Out of total variance, the variance of 10% was present among the population. The variance of 77% was present among individuals and 13% within the individuals (online Supplementary Table S6).
Marker-trait association
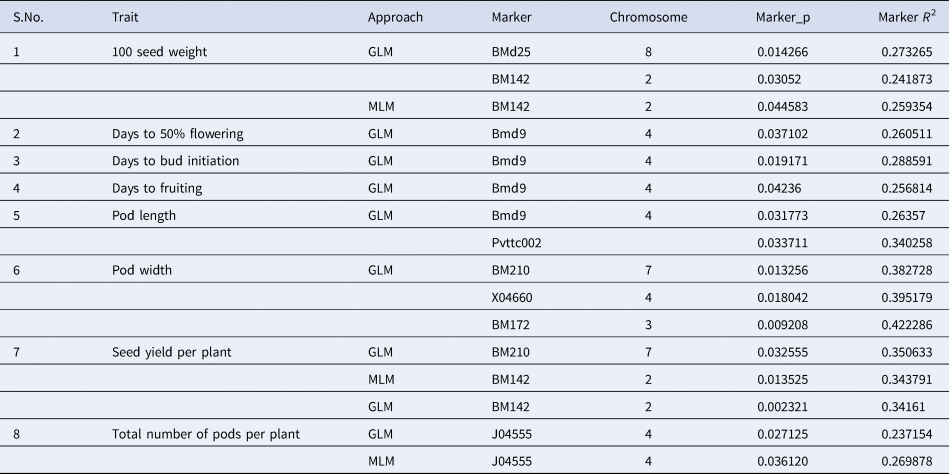
To identify significant MTAs, GLM and MLM-based approaches were used. Eight SSR markers were found to be associated with agronomic traits at probability P < 0.05 in GLM and two SSR markers were found to be associated with MLM (Table 3). The phenotypic variation ranges from 23 to 42%. Markers BM142 and BMd25 were significantly associated with 100 seed weight. BMd9 was significantly associated with days to 50% flowering, days to bud initiation, days to fruiting and pod length. Pvttc002 was also significantly associated with pod length. Markers X04660, BM172 and BM210 were significantly associated with pod width. Markers BM210 and BM142 were significantly associated with seed yield per plant. J04555 was significantly associated with the total number of pods per plant. Only two markers, BM142 associated with 100 seed weight and J04555 associated with the total number of pods per plant were found common while using both GLM and MLM approaches. All the MTAs were considered as major MTAs contributing more than 25% phenotypic variation (BMd25 and BM142 provide 27 and 25% phenotypic variation respectively for 100 seed weight; BMd9 (26, 28, 25, 26% respectively) for days to 50% flowering, days to bud initiation, days to fruiting and pod length; Pvttc002 (34%) for pod length; X04660 (39%), BM210 (38%) and BM172 (42%) for pod width; BM210 (35%), BM142 (34%) for seed yield per plant and J04555 (26%) for total number of pods per plant).
Table 3. Marker-trait association with P value and marker-trait regression coefficient derived from 32 SSR markers using 100 genotypes of common bean
Discussion
In this study, we evaluated the genetic diversity of common bean accessions and significant variation was observed in diverse germplasm of common bean for all the studied agronomic traits which can be used in the selection of the best genotype in breeding programmes. The findings were in concurrence with previous studies by Salgotra et al. (Reference Salgotra, Katoch and Sood2002, Reference Salgotra, Gupta and Ahmed2012) in rice; Bralewski et al. (Reference Bralewski, Fiebig and Kotlinska2007); Stoilova et al. (Reference Stoilova, Pereira, Tavers-de-Sousa and Carnide2005, Reference Stoilova, Pereira and Tavers-de-Sousa2013); Boros et al. (Reference Boros, Wawer and Borucka2014) in common bean. PCV was found to be higher than GCV for pod width, pods per plant and seed yield per plant, indicating that phenotypic variation is attributed to genotype and environment (Singh et al., Reference Singh, Singh and Singh2018). PCV and GCV values were closer for traits including days to bud initiation, days to 50% flowering, days to fruiting, pod length, seeds per plant and 100 seed weight. This means that these characters are unaffected by their environment and are stable. Hence, selection based on genotype alone will be effective (Prakash and Ram, Reference Prakash and Ram2014; Prakash et al., Reference Prakash, Ram and Meena2015). High PCV and GCV values for pod yield per plant and pods per plant were reported by Devi et al. (Reference Devi, Sharma, Singh, Katoch and Sharma2015); for seed weight per pod by Lyngdoh et al. (Reference Lyngdoh, Thapa, Shadap, Singh and Tomar2018) and yield per plant by Mir et al. (Reference Mir, Choudhary, Bawa, Jan, Singh, Bhat, Paliwal, Kumar, Chitikineni, Thudi and Varshney2021). Further, correlation analysis revealed a highly significant positive correlation of days to bud initiation with days to 50% flowering and days to fruiting. This was also reported by Gupta et al. (Reference Gupta, Zargar, Singh, Nazir, Mahajan and Salgotra2020). Also, a positive correlation observed for yield traits in the present study was also reported by Beebe et al. (Reference Beebe, Rao, Blair and Acosta-Gallegos2013); Assefa et al. (Reference Assefa, Wu, Beebe, Rao, Marcomin and Rubyogo2015); Rao et al. (Reference Rao, Beebe, Polania, Grajales, Cajiao, Ricaurte, Garcia and Rivera2017) and Mir et al. (Reference Mir, Choudhary, Bawa, Jan, Singh, Bhat, Paliwal, Kumar, Chitikineni, Thudi and Varshney2021). Hence, to enhance the yield of common bean, emphasis should be given to the improvement of the number of seeds per plant, the number of pods per plant and 100 seed weight (Beebe et al., Reference Beebe, Rao, Blair and Acosta-Gallegos2013; Assefa et al., Reference Assefa, Mahama, Brown, Cannon, Rubyogo, Rao, Blair and Cannon2019).
An average of 8.5 alleles per locus was amplified on all the genotypes indicating high diversity in the common bean germplasm used in the study. The common bean grown in North-Western Himalayas possesses huge diversity, hence can be utilized in crop improvement programmes. The number of alleles per locus was comparable to a study by Jimenez and Korpelainen (Reference Jimenez and Korpelainen2012); Scarano et al. (Reference Scarano, Rubio, Jose Ruiz, Raoa and Corradoa2014). Jimenez and Korpelainen (Reference Jimenez and Korpelainen2012) reported an average of 8.9 alleles per loci in Nicaragua genotypes. Scarano et al. (Reference Scarano, Rubio, Jose Ruiz, Raoa and Corradoa2014) reported an average of 8.5 alleles per loci in 25 common bean populations from the Campania region. The value is higher than the values reported in common bean genetic diversity studies by Carovic-Stanko et al. (Reference Carovic-Stanko, Liber, Vidak, Baresic, Grdisa, Lazarevic and Satovic2017); Gioia et al. (Reference Gioia, Logozzo, Marzario, Spagnoletti Zeuli and Gepts2019); Sajgalik et al. (Reference Sajgalik, Ondreickova, Hauptvogel, Mihalik, Glasa and Kraic2019); Mir et al. (Reference Mir, Choudhary, Bawa, Jan, Singh, Bhat, Paliwal, Kumar, Chitikineni, Thudi and Varshney2021); Vidak et al. (Reference Vidak, Satovic, Liber, Grdisa, Gunjaca, Kilian and Carovic-Stanko2021). On the other hand, more alleles per locus than observed in the study were reported by Asfaw et al. (Reference Asfaw, Blair and Almekinders2009); Kwak and Gepts (Reference Kwak and Gepts2009); Blair et al. (Reference Blair, Gonzales, Kimani and Butare2010); Okii et al. (Reference Okii, Tukamuhabwa, Kami, Namayanja, Paparu, Ugen and Gepts2014). The number of alleles per loci varies according to the number of genotypes and SSR markers used in the study. An average major allele frequency and gene diversity of 0.337 and 0.7699, respectively, were observed. Bashir et al. (Reference Bashir, Bashir, Mahajan, Nazir, Mir, Nehvi and Majeed2020) reported an average major allele frequency of 0.216 in 102 common bean genotypes collected from North-Western Himalayas. An average of 0.82 gene diversity was reported by Okii et al. (Reference Okii, Tukamuhabwa, Kami, Namayanja, Paparu, Ugen and Gepts2014); 0.73 by Mahajan et al. (Reference Mahajan, Zargar, Singh, Salgotra, Farhat and Sonah2017a) and 0.9 by Bashir et al. (Reference Bashir, Bashir, Mahajan, Nazir, Mir, Nehvi and Majeed2020). The high PIC value represents genetically distant genotypes. Kwak and Gepts (Reference Kwak and Gepts2009) and Scarano et al. (Reference Scarano, Rubio, Jose Ruiz, Raoa and Corradoa2014) identified average PIC values of 0.62 and 0.67 in common bean accessions. Bashir et al. (Reference Bashir, Bashir, Mahajan, Nazir, Mir, Nehvi and Majeed2020) reported an average PIC value of 0.899 in 102 common bean genotypes.
Clustering analysis using DARwin5 software divided common bean genotypes into three main clusters, namely I, II and III. There was no clear separation of local beans from those collected from different locations. This represents diversity in the common bean germplasm. Similar results were reported by Mir et al. (Reference Mir, Choudhary, Bawa, Jan, Singh, Bhat, Paliwal, Kumar, Chitikineni, Thudi and Varshney2021) in a core set of 96 diverse common bean genotypes including local landraces from Jammu and Kashmir and exotic lines. The information from population structural analysis in the form of a structure matrix was shown to be helpful in avoiding false positives. STRUCTURE analysis grouped genotypes into three subpopulations with 14% individuals showed mixed ancestry. Also, highest percentage of variance was present among individuals. This was expected as common bean is self-pollinated crop. The three subpopulations have also been reported in population structure analysis in earlier studies by Okii et al. (Reference Okii, Tukamuhabwa, Kami, Namayanja, Paparu, Ugen and Gepts2014); Scarano et al. (Reference Scarano, Rubio, Jose Ruiz, Raoa and Corradoa2014); Mahajan et al. (Reference Mahajan, Zargar, Singh, Salgotra, Farhat and Sonah2017a); Bashir et al. (Reference Bashir, Bashir, Mahajan, Nazir, Mir, Nehvi and Majeed2020) in common beans. The PCoA and model-based approach using STRUCTURE distinguished common bean germplasm into three subpopulations. The differences in the categorization of individuals to different groups might be due to different algorithms on which the software was based. Cluster analysis assigns genotypes to different groups/clusters by assigning fixed branch position to each genotype. On the other hand, structure analysis assigns genotypes to different subpopulations based on the highest membership percentage. This was also reported by Mahajan et al. (Reference Mahajan, Zargar, Salgotra, Singh, Wani, Nazir and Sofi2017b) and Bashir et al. (Reference Bashir, Bashir, Mahajan, Nazir, Mir, Nehvi and Majeed2020) in diversity studies in common bean genotypes from Jammu and Kashmir, India. Variation in diversity and population structure can also be due to differences in germplasm, molecular markers, partial reproductive isolation as well as lower genetic drift.
The hilly region of Northern India has a wide range of plant types, grain shape and agro-ecological adaptations of the common bean. Association mapping was performed to determine the marker associated with yield attributing trait in a population of 100 genotypes based on linkage disequilibrium (Zondervan and Cardon, Reference Zondervan and Cardon2004). The population size used in the present study is more than used in recent studies for genome-wide association analysis in common bean i.e. 93 (Galeano et al., Reference Galeano, Cortes, Fernandez, Soler, Franco-Herrera, Makunde, Vanderleyden and Blair2012); 66 (Nemli et al., Reference Nemli, Asciogul, Kay, Kahraman, Siyok and Tanyolac2014) and 96 (Villegas et al., Reference Villegas, Song and Kelly2016; Mahajan et al., Reference Mahajan, Zargar, Salgotra, Singh, Wani, Nazir and Sofi2017b; Choudhary et al., Reference Choudhary, Bawa, Paliwal, Singh, Bhat, Mir, Gupta, Sofi, Thudi, Varshney and Mir2018; Gupta et al., Reference Gupta, Zargar, Singh, Nazir, Mahajan and Salgotra2020; Mir et al., Reference Mir, Choudhary, Bawa, Jan, Singh, Bhat, Paliwal, Kumar, Chitikineni, Thudi and Varshney2021). Out of eight markers used, three markers namely BMd 25, BM210 and X04660 were also previously found to be associated with seed weight, yield and with pod width respectively (Asfaw et al., Reference Asfaw, Almekinders, Blair and Struik2012; Gupta et al., Reference Gupta, Zargar, Singh, Nazir, Mahajan and Salgotra2020; Mir et al., Reference Mir, Choudhary, Bawa, Jan, Singh, Bhat, Paliwal, Kumar, Chitikineni, Thudi and Varshney2021), hence, can be considered as validated MTAs. BM142 was found to be associated with both 100 seed weight and seed yield per plant and BM210 was associated with both pod width and seed yield per plant indicating pleiotropic gene action. The validated markers associated with yield traits can be used in bean breeding programmes for improving the productivity of common beans.
Supplementary material
The supplementary material for this article can be found at https://doi.org/10.1017/S147926212200017X
Acknowledgements
The corresponding authors gratefully acknowledge the financial support (San No. 09/1238(0001)/2019-EMR-I) received from the Council of Scientific and Industrial Research (CSIR), Govt. of India and the School of Biotechnology, SKUAST-Jammu for the work reported in this paper.


