


INTRODUCTION
In the backreef lagoon of a fringing reef, the seabed floor is commonly composed of eroded deposits from corals and other carbonate-bearing organisms (Alongi, Reference Alongi1989). The physical and biological breakdown of the coral skeletons results in a large variety of substrates with different structural complexity, providing a wide range of potential microhabitats for benthic fauna. Despite the considerable research effort on the meiofauna communities associated with carbonate reef sediments (e.g. Alongi, Reference Alongi1989; Ndaro & Ólafsson, Reference Ndaro and Ólafsson1999; Netto et al., Reference Netto, Warwick and Attrill1999, Reference Netto, Attrill and Warwick2003; Raes et al., Reference Raes, De Troch, Ndaro, Muthumbi, Guilini and Vanreusel2007), studies have primarily focused on the associated benthic nematode assemblages, whereas the epimeiofauna inhabiting these hard coral substrates has been ignored. Harpacticoids play an important trophic role in coral sands because of their numerical abundance, capacity to recycle nitrogen and high bacterial ingestion rates (Gray, Reference Gray1985; Moriarty et al., Reference Moriarty, Pollard, Alongi, Wilkinson and Gray1985). Furthermore, they are an important food source for fish larvae and juveniles and for small fish (Hicks & Coull, Reference Hicks and Coull1983; Gee, Reference Gee1989; Coull, Reference Coull1990; De Troch et al., Reference De Troch, Mees and Wakwabi1998). However, studies focusing on harpacticoid assemblage structure in the carbonate sands of coral reefs are scarce and geographically restricted to the Bermuda Platform (Coull, Reference Coull1970; Coull & Herman, Reference Coull and Herman1970), the US Virgin Islands (Hartzband & Hummon, Reference Hartzband and Hummon1974), Mururoa (Villiers et al., Reference Villiers, Christien and Sevère1987; Villiers, Reference Villiers1988) and Fangataufa Atoll (Villiers & Bodiou, Reference Villiers and Bodiou1996), both in French Polynesia. Generally, grain size, controlled by reef hydrodynamics, has been identified as an important structuring factor of harpacticoid communities. Studies about epifaunal harpacticoids are rare and mainly restricted to the phytal assemblages of sea grasses and macroalgae (e.g. Hicks & Coull, Reference Hicks and Coull1983; Hicks, Reference Hicks, Moore and Seed1985; Bell et al., Reference Bell, Hicks and Walters1988; Bell & Hicks, Reference Bell and Hicks1991; De Troch et al., Reference De Troch, Fiers and Vincx2001a, Reference De Troch, Fiers and Vincx2003). These species-rich assemblages are characterized by a specific faunal composition usually quite distinct from adjacent sedimentary habitats (Hicks, Reference Hicks, Moore and Seed1985). Different within-plant subhabitats may be occupied by a different suite of species (Hicks, Reference Hicks1977b; De Troch et al., Reference De Troch, Fiers and Vincx2001a; Arroyo et al., Reference Arroyo, Maldonado and Walters2006). Furthermore, the role of structural complexity of the phytal habitat in determining harpacticoid species number and diversity has been documented (Hicks, Reference Hicks, Moore and Seed1985; Jenkins et al., Reference Jenkins, Walker-Smith and Hamer2002).
So far, little meiobenthic research has been conducted along the East African coast. Previous studies addressed the associated fauna of sea grass beds, mangroves or the lagoonal soft-bottom in Kenya, Zanzibar and Madagascar (Thomassin et al., Reference Thomassin, Vivier and Vitiello1976; Vanhove et al., Reference Vanhove, Vincx, Van Gansbeke, Gijselinck and Schram1992; Ólafsson et al., Reference Ólafsson, Johnstone and Ndaro1995; Ndaro & Ólafsson, Reference Ndaro and Ólafsson1999; De Troch et al., Reference De Troch, Gurdebeke, Fiers and Vincx2001b; Raes et al., Reference Raes, De Troch, Ndaro, Muthumbi, Guilini and Vanreusel2007), and mostly focused on the nematode assemblage. Harpacticoid copepod studies have mainly focused on their taxonomy, e.g. in Madagascar (Chappuis, Reference Chappuis1954), Réunion (Bozic, Reference Bozic1969), Seychelles (Wells & McKenzie, Reference Wells and McKenzie1973), Mozambique (Wells, Reference Wells1967), and Kenya (Fiers & De Troch, Reference Fiers and De Troch2000; Gheerardyn et al., Reference Gheerardyn, Fiers, Vincx and De Troch2006a, Reference Gheerardyn, Fiers, Vincx and De Trochb). Recently, De Troch et al. (Reference De Troch, Fiers and Vincx2001a, Reference De Troch, Fiers and Vincx2003) also investigated the composition and structure of harpacticoid communities in Kenyan sea grass beds. The East African coast supports extensive intertidal lagoon flats mainly composed of carbonate sand and in Zanzibar these account for approximately 90% of the total coastal area (Ndaro & Ólafsson, Reference Ndaro and Ólafsson1999). Along the eastern side of the island, fringing reefs span the coastline and are exposed to strong waves and currents, the main ocean current affecting Zanzibar being the East African Coastal Current (Mbije et al., Reference Mbije, Wagner, Francis, Ohman and Garpe2002). Ndaro & Ólafsson (Reference Ndaro and Ólafsson1999) examined the meiobenthos of a shallow lagoon along this coast and found distinct nematode assemblages, principally determined by sediment characteristics, in sea grass bed, fine sand and coarse sand habitats. Raes et al. (Reference Raes, De Troch, Ndaro, Muthumbi, Guilini and Vanreusel2007) demonstrated the structuring effect of microhabitat type (coral sand, gravel and dead coral fragments) on nematode assemblages along the Kenyan and Zanzibari coasts.
The major aim of this study was to assess the importance of microhabitat type in influencing harpacticoid communities in the lagoon along the east coast of Zanzibar.
MATERIALS AND METHODS
Sampling and laboratory analysis
Meiofauna samples were collected in the lagoon of the fringing reef, between the reef crest and the sand beach, at two locations along the eastern coast of Zanzibar Island (Tanzania): at Matemwe (MAT), located in the north of the island (5°52′S, 39°21′E; 17 August 2004) and at Makunduchi (MAK), in the south of the island (6°25′S, 39°34′E; 22 August 2004) (Figure 1). Distance between both locations is 70 km. At each location, three replicates were taken at a distance of five metres from each other, at approximately 400–500 m from the beach. The sampling area consisted of bare coral sand with patches of coral gravel and dead coral fragments, and was not located adjacent to any sea grass beds, seaweed culture or living coral patches. All material was collected during low tide under a water cover of 0.5 m. For each replicate, a round, metal core (diameter 30 cm) was placed onto the sediment to delimit the sampling area, in which coral sand, coral gravel and dead coral fragments (devoid of any algal covering) were present (see figure 2 in Raes et al., Reference Raes, De Troch, Ndaro, Muthumbi, Guilini and Vanreusel2007). One 10 cm2 sediment core for meiofauna was inserted in the coral sand as deep as possible, next to the coral fragments and the gravel patch. Then, coral fragments were taken out manually, coral gravel was gently scooped out with a spoon and each of these substrates was put directly in a plastic bag. Subsequently, the meiocore was collected and vertically subdivided into three different depth horizons (0–1 cm, 1–3 cm and the remaining sediment, ranging from 3–4 cm to 3–9 cm), to study harpacticoid sediment assemblage with changing sediment depth. An additional 10 cm2 core for granulometric analysis was also taken. Although it was aimed to sample coral fragments which were similar in structural complexity and morphology, the fragments at MAT were generally more eroded, structurally less complex and less protruding from the sediment surface than in MAK. Coral gravel is distinguished from coral sand because small pieces of coral can still be recognized in the former, whereas this is no longer true for the sediment. Abbreviations used in the text, figures and tables: cor, coral fragments; gra, coral gravel; sed1, sed2, sed3, upper, middle and bottom sediment layer, respectively.
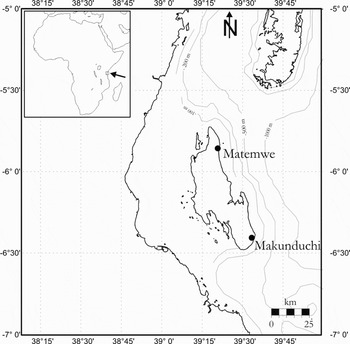
Fig. 1. Map of the study area indicating the sampling sites. The northernmost island is Pemba, the southernmost is Unguja (Zanzibar Island).

Fig. 2. Multidimensional scaling two-dimensional ordination plot of all samples. Stress value is indicated. The dashed line separates samples from the different locations (MAT: Matemwe; MAK: Makunduchi), the dotted line separates the different microhabitats (cor, coral; gra, gravel; sed1, upper; sed2, middle; and sed3, lower sediment layer) (except samples from gra and sed1).
After adding MgCl2 to stun the associated fauna, coral fragments and coral gravel were rinsed thoroughly with filtered seawater and sieved through a 1 mm and a 32 µm sieve to separate the macro- and meiofauna. The material was fixed with 4% buffered formalin. Meiofauna was extracted from the sediment by density gradient centrifugation, using Ludox HS40 (specific density 1.18) as a flotation medium (Heip et al., Reference Heip, Vincx and Vranken1985; Vincx, Reference Vincx and Hall1996). Meiofauna was stained with rose Bengal. From each sample (coral fragment, gravel and the three sediment layers), 200 copepods (or all copepods when less than 200 individuals were present) were randomly picked out and mounted in glycerine. Adult harpacticoids were identified to working species level using Lang (Reference Lang1948, Reference Lang1965), Boxshall & Halsey (Reference Boxshall and Halsey2004) and original descriptions. Assignment of working species to genera and families was in accordance with recent literature. The systematic status of Dactylopusiidae Lang, 1936, Pseudotachidiidae Lang, 1936, Rhynchothalestridae Lang, Reference Lang1948 and Thalestridae Sars, 1905 follows Willen (Reference Willen2000), the status of Miraciidae Dana, 1846 follows Willen (Reference Willen2000, Reference Willen2002) and the status of Tisbidae Stebbing, 1910 follows Seifried (Reference Seifried2003). Furthermore, each harpacticoid species has been designated to one of the nine body shapes as defined by Coull (Reference Coull1977).
Sediments were analysed with a particle size analyser (type Coulter LS100). The characteristics obtained were median grain size, per cent silt (<63 µm), per cent coarse sand (850–2000 µm), per cent gravel (>2000 µm), kurtosis and skewness.
Statistical analysis
A non-metric, multidimensional scaling, two-dimensional plot (MDS) was produced, using the Bray–Curtis similarity index. Per sample, data were standardized to relative abundance data and arcsin-transformed prior to analysis. The significance of the MDS (differences in copepod assemblage structure between the different groups) was tested through two-way crossed ANOSIM. Similarity of percentages (SIMPER) was used to identify the taxa contributing to the differences found in the ordination analysis. All multivariate tests were performed using the PRIMER5 software (Plymouth Marine Laboratory; Clarke & Gorley, Reference Clarke and Gorley2001).
Several biodiversity indices were calculated. The Shannon–Wiener index H′ and Pielou's evenness J (Pielou, Reference Pielou1975) were calculated for comparison with other studies. Hill's diversity numbers (Hill, Reference Hill1973) gradually change from indices of species richness to indices of dominance with increasing number: N0 is identical to the number of species, N1 = exp (H′) and Ninf reflects evenness. Rarefaction curves were constructed from values of the expected number of species (Hurlbert, Reference Hurlbert1971). Equitability of the copepod fauna was studied based on species' abundance distributions as k-dominance curves (Lambshead et al., Reference Lambshead, Platt and Shaw1983).
Parametric analysis of variance (ANOVA) was performed on untransformed or log (x + 1) transformed data if needed to meet the assumptions for ANOVA. Paired a posteriori comparisons were carried out with the Tukey test. For non-parametric data, Kruskal–Wallis ANOVA was employed. Post hoc testing of differences was carried out using pairwise Mann–Whitney U-tests. Bartlett's and Cochran's tests were used to verify the homogeneity of variances prior to the analysis. All univariate analyses were performed using STATISTICA6 software. Indicator species analysis (ISA) was performed using PC-ORD4 software (McCune & Mefford, Reference McCune and Mefford1999). Calculated indicator values were tested for significant values using a Monte Carlo test (Dufrêne & Legendre, Reference Dufrêne and Legendre1997). The additive partitioning of species diversity into measures of α- and β-diversity (Veech et al., Reference Veech, Summerville, Crist and Gering2002; Crist et al., Reference Crist, Veech, Gering and Summerville2003) was conducted with PARTITION software.
RESULTS
In total, 4177 copepods were identified. The bulk of the specimens belonged to the order Harpacticoida (79.5%) and Cyclopoida (20.3%). Calanoida were rarely encountered (0.2%, with 9 individuals). Of the 3319 harpacticoid individuals, 55.9% were adults. A total of 119 species, 60 genera and 23 families were recorded in this study (see Appendix). The families Paramesochridae Lang, 1944 (22.2%), Ameiridae Monard, 1927 (14.9%) and Miraciidae (14.9%) dominated and the latter two families showed the highest species number (Table 1). Eight genera (Ameira Boeck, 1865, Apodopsyllus Kunz, 1962, Kliopsyllus Kunz, 1962, Meiopsyllus Cottarelli & Forniz, 1994, Tisbe Lilljeborg, 1853, Diagoniceps Willey, 1930, Amphiascus Sars, 1905 and Parastenhelia Thompson & A. Scott, 1903) occurred with a relative abundance between 5% and 12.5% and together accounted for 56% of the relative abundance. Most genera (37) were poorly represented (each <1% of relative abundance). Altogether, 29 species accounted for 80% of the assemblage, with Ameira sp. 1, Kliopsyllus sp. 1, Apodopsyllus sp. 3 and Diagoniceps sp. 1 each constituting between 5.2% and 7.4% of relative abundance.
Table 1. Harpacticoid family percentage (%) abundance, number of genera and species in each family identified from the east coast of Zanzibar.

Sediment characteristics
At both locations, the lagoonal soft-sediments are medium to coarse sands with low silt contents (Table 2). Coarse sand percentage was significantly higher at MAK (17.7 ± 1.0% vs 10.8 ± 2.8%), while gravel percentage was significantly higher at MAT (41.2 ± 3.6% vs 12.7 ± 7.4%).
Table 2. Mean values and standard deviation, results of 1-way ANOVA and Mann–Whitney U-test evaluating differences in sediment characteristics between both locations (MAT, Matemwe; MAK, Makunduchi). Analyses performed on log (x + 1) transformed data. *, 0.01 < P ≤ 0.05.

sign. lev., significance level; NS, not significant.
Similarity analysis
The MDS ordination indicates that harpacticoid assemblages differ among microhabitats (cor, gra, sed1, sed2, sed3) and between locations (Figure 2). Samples are more separated according to location (averaged over all microhabitat groups), as confirmed by two-way crossed ANOSIM (global R = 0.379, P = 0.001 among microhabitats; global R = 0.485, P = 0.001 between locations). Pairwise tests (Table 3) indicated significant differences between cor samples and each of the other microhabitats (gra, sed1, sed2, sed3). Gra samples were significantly different from samples of sed2 and sed3, but not from sed1. Samples from sed2 and sed3 each formed scattered clusters, indicating high variability among replicates.
Table 3. Results of ANOSIM pairwise tests: values of the R-statistic and corresponding P levels are indicated. **, 0.001 < P ≤ 0.01; *, 0.01 < P ≤ 0.05; NS, not significant. (cor, coral; gra, gravel; sed1, upper; sed2, middle; and sed3, lower sediment layer).

Multidimensional scaling ordinations at genus and family level (not shown) produced the same pattern of a changing composition across the microhabitats and a clearer separation between locations (indicated by two-way crossed ANOSIM). Pairwise tests indicated significant differences for the same combinations, except that at the genus level there is also a significant difference between gra and sed1 (with R = 0.296, P = 0.05).
Average similarity among samples in terms of community composition (as indicated by SIMPER) is highest for gra (52.8%) at MAT, and highest for sed1 (48.3%) at MAK. At both locations, average dissimilarity between microhabitats is lowest between gra and sed1 (56.9% and 55%, at MAT and MAK, respectively). Cor samples from both locations are more comparable to each other (dissimilarity value: 64.7%), than they are to the other microhabitats within their respective location (dissimilarity cor–gra at MAT: 66.5%, all other values higher than 75%).
Characterization of the harpacticoid assemblages
At both study sites, four of the five most dominant families in coral fragments were Dactylopusiidae, Ectinosomatidae Sars, 1903, Tisbidae and Ameiridae (Figure 3). These families, together with Laophontidae T. Scott, 1905 and Miraciidae, explained over 90% of similarity among the cor samples and were important in explaining dissimilarity between cor and any other microhabitat (SIMPER). At MAK, the typically phytal family Tegastidae Sars, 1904 explained between 9.5% and 6.7% of the dissimilarity with every other microhabitat (SIMPER). In the gra samples, Ameiridae, Parastenheliidae Lang, 1944, Tisbidae (at both locations), Harpacticidae Sars, 1904 (at MAT) and Miraciidae (at MAK) are the dominant families, which agree well with those from sed1 (i.e. Ameiridae, Miraciidae and Parastenheliidae at both locations). Furthermore, Paramesochridae (20.8% relative abundance) at MAT, and Tetragonicipitidae Lang, 1944 (9.8% relative abundance) at MAK also predominate in sed1. At MAT, sed2 and sed3 are dominated by Paramesochridae (74.4% and 86.6% relative abundance, respectively). At MAK, sed2 is codominated by Tetragonicipitidae, Miraciidae and Ameiridae, while sed3 is dominated by Tetragonicipitidae (67.9% relative abundance).

Fig. 3. Harpacticoid family composition per microhabitat at Matemwe and at Makunduchi, based on pooled samples per microhabitat (cor, coral; gra, gravel; sed1, upper; sed2, middle; and sed3, lower sediment layer). Families with a relative abundance >2% in at least one microhabitat are given.
At both locations, the genera Dactylopusia Norman, 1903, Ectinosoma Boeck, 1865, Tisbe and Paradactylopodia Lang, 1944 (at MAT) predominated in cor (Table 4). At Makunduchi, dominant genera in both gra and sed1 are Paramphiascopsis Lang, 1944, Parastenhelia and Robertgurneya Lang, 1944. Both locations differ in dominant genera in sed1 and more distinctly in sed2 and sed3, with mainly paramesochrid genera at MAT, and Diagoniceps (Tetragonicipitidae) at MAK. At both locations, Dactylopusia and Ectinosoma had a significant preference for cor, as shown by indicator species analysis (Table 5). One genus (Zausodes C.B. Wilson, 1932) showed a significant preference for gra (at MAT).
Table 4. Relative abundances (%) of the dominant harpacticoid genera in each microhabitat (cor, coral; gra, gravel; sed1, upper; sed2, middle; and sed3, lower sediment layer), per location. Genera with a relative abundance >2% (calculated over all samples per microhabitat, per location) in at least one microhabitat (per location) are given.

Table 5. Indicator genera within each location, as specified by an indicator species analysis. Only taxa with a significant habitat preference are listed. Indicator values, preferred microhabitat (cor, coral; gra, gravel) and significance levels are provided. ***, P ≤ 0.001; **, 0.001 < P ≤ 0.01; *, 0.01 < P ≤ 0.05.

sign. lev., significance level.
Over the complete dataset, the dominant body shapes (as defined by Coull, Reference Coull1977) are fusiform prehensile (48.4% of the individuals) and vermiform (23.5%). Copepods with fusiform depressed, fusiform compressed and fusiform body shape occur with a relative abundance between 6.7% and 7.7%. The four remaining habitus shapes (depressed, fusiform not prehensile, compressed and cylindrical) are only rarely encountered (less than 4% of relative abundance each). Copepods with a fusiform prehensile body were dominant in cor, gra and sed1 at both locations (ranging between 33.1% and 87.6% of relative abundance), and also in sed2 and sed3 at MAK, due to the presence of Ameiridae, Miraciidae and Tetragonicipitidae (Figure 4). Vermiform copepods were especially dominant in sed2 and sed3 at MAT (over 75% of relative abundance) and increased in relative importance with increasing sediment depth. At MAT, the relative importance of fusiform depressed copepods was significantly higher in cor and gra than in the sediment layers (Kruskal–Wallis ANOVA and Mann–Whitney U-tests, P < 0.05). Fusiform compressed copepods were significantly more important in cor than in any sediment layer at MAT (Kruskal–Wallis ANOVA and Mann–Whitney U-tests, P < 0.05). At MAK, average relative abundance of fusiform copepods (comprising all ectinosomatid genera except Hastigerella) was significantly higher in cor than in any other microhabitat (Kruskal–Wallis ANOVA and Mann–Whitney U-tests, P < 0.05).
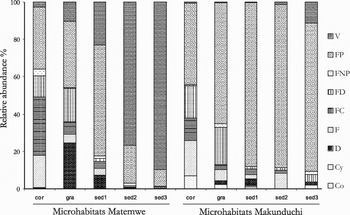
Fig. 4. Composition of body shapes for each microhabitat, per location. Body shapes as defined by Coull (Reference Coull1977). V, vermiform; FP, fusiform prehensile; FNP, fusiform non-prehensile; FD, fusiform depressed; FC, fusiform compressed; F, fusiform; D, depressed; Cy, cylindrical; and Co, compressed.
Biodiversity
There were significant differences in copepod diversity among microhabitats (Tables 6 & 7), as expressed by indices of species richness (H′, N0, N1). However, trends were different between locations. At MAT, diversity (H′) was significantly higher in cor, gra and sed1 than in sed3, and higher in cor than in sed2. At MAK however, cor was significantly more diverse than any other microhabitat, as shown by N1. At both locations, Ninf is significantly higher in cor and indicates low dominance.
Table 6. Biodiversity indices: Hill's diversity numbers N0, N1, Ninf, the expected number of species ES (50), the Shannon–Wiener diversity index H′and Pielou's evenness J. The average (Avg) value with standard deviation (SD) is given per microhabitat (cor, coral; gra, gravel; sed1, upper; sed2, middle; and sed3, lower sediment layer), per location.

Table 7. Results of 1-way ANOVA and Kruskal–Wallis tests for harpacticoid diversity indices between the different microhabitats (cor, coral; gra, gravel; sed1, upper; sed2, middle; and sed3, lower sediment layer), per location. **, 0.001 < P ≤ 0.01; *, 0.01 < P ≤ 0.05; NS, not significant.

sign. lev., significance level.
Overall, similar trends were found with K-dominance curves and rarefaction curves based on pooled samples per microhabitat (cor, gra, sed1, sed2, sed3), per location (Figures 5 & 6). At MAT, evenness and species diversity are similar in cor, gra and sed1 (Figures 5a & 6a). At MAK, there is a clear separation in which cor shows the most even distribution (Figure 5b) and the highest diversity (Figure 6b).

Fig. 5. K-dominance curves of pooled samples per microhabitat (cor, coral; gra, gravel; sed1, upper; sed2, middle; and sed3, lower sediment layer), (A) at Matemwe and (B) at Makunduchi.

Fig. 6. Rarefaction curves of pooled samples per microhabitat (cor, coral; gra, gravel; sed1, upper; sed2, middle; and sed3, lower sediment layer), (A) at Matemwe and (B) at Makunduchi.
Additive partitioning of diversity (Figure 7) indicates that total species richness (γ) is mainly attributed to differences between microhabitats (β1, 41.4%). Average diversity within microhabitats (α) and β-diversity due to turnover between locations (β2) contribute 28.8% and 29.8%, respectively. In contrast, 71% of the Shannon index is explained by α-diversity within microhabitats, while β1-diversity and β2-diversity contribute less (19.4% and 9.1%, respectively).
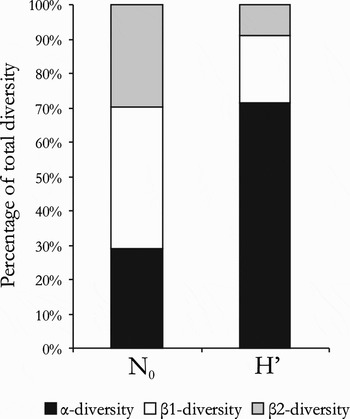
Fig. 7. Additive partitioning of total diversity for the number of species N0 and for Shannon–Wiener diversity H′. β1-diversity is the fraction of β-diversity resulting from differences in microhabitat. β2-diversity is the fraction of β-diversity resulting from differences between locations.
The sediment samples contained 69 species, 41 genera and 15 families. Eight families found exclusively in cor and/or gra constituted less than 0.5% of the total assemblage each. Also, 19 genera found exclusively in cor and/or gra samples were relatively rare and, of these, Heterolaophonte Lang, 1944 (in cor) and Laophonte Philippi, 1840 (in cor and gra) were the most important (with 0.5% and 0.6% of the total assemblage, respectively). Genera restricted to sediment, cor, or gra occurred sporadically, generally representing less than 0.3% of relative abundance (of the total assemblage). Thirteen out of 42 genera occurring in the cor samples are restricted to this microhabitat. Only 3 genera (each found with one individual) out of the 32 genera found in gra samples were restricted to gra. Twelve (of 41) genera were restricted to sediment, with Tapholeon Wells, Reference Wells1967 (with 0.6% of relative abundance), Apodopsyllus (with 8.6%) and Meiopsyllus (with 6.7%) as the most important. Fifty species were found exclusively in the cor and/or gra samples and, of these, Paradactylopodia sp. 3 (occurring in cor and gra) was the most abundant (with 1.9% of the total abundance). Species restricted to one of the microhabitats (35 out of 71 species in cor, 7 out of 51 in gra, 26 out of 69 in sediment) were rare (each constituting less than 1% of the total assemblage), with the exception of Apodopsyllus sp. 2 and Apodopsyllus sp. 3 (with 2.1% and 5.8%, respectively), and Meiopsyllus sp. 2 and Meiopsyllus sp. 3 (with 3.5% and 3.0%, respectively).
DISCUSSION
The results of this study indicate that the composition and diversity of the harpacticoid fauna is different in dead coral fragments, coral gravel, and layers (increasing depth into the sediment) of the nearby coral sand. At both locations, there is a trend of changing copepod composition across these microhabitats. Multivariate analysis showed that harpacticoid composition of the coral assemblage differs significantly from gravel and sediment layers. The copepod fauna of the gravel samples did not differ significantly from the upper sediment layer, and differed only slightly (but significantly) from middle and lower sediment layers. Furthermore, faunal composition changed with increasing sediment depth.
The harpacticoid fauna associated with the coral fragments was mainly composed of genera typically found in phytal assemblages, such as Tisbe, Paradactylopodia, Dactylopusia (=Dactylopodia Lang, Reference Lang1948) and Tegastes Norman, 1903 (at Makunduchi) (Hicks, Reference Hicks, Moore and Seed1985), along with genera often found among sediments and other epibenthic microhabitats, such as Ameira, Ectinosoma, Amphiascus and Paralaophonte Lang, 1944 (Hicks & Coull, Reference Hicks and Coull1983). Although species of certain genera (e.g. Ectinosoma) occur in a wide range of habitats and are not easily classified as phytal or sediment dwellers, it is not unlikely that sediment-bound forms are attracted by the sediment retained between the coral branches. The meiofauna (including harpacticoids) associated with the holdfasts of macroalgae is not strictly phytal, but a mixture of inhabitants from phytal, epibenthic and interstitial habitats, associated mainly with the sediment retained between the holdfast structure and the variety of niches and refuge provided by them (Moore, Reference Moore1972, Reference Moore1973; Hicks, Reference Hicks1977a; Arroyo et al., Reference Arroyo, Maldonado, Pérez-Portela and Benito2004, Reference Arroyo, Maldonado and Walters2006). Similarly, the sediment trapped by the coral fragments might provide a microhabitat for sediment-dwellers, while the complex microtopography of the coral branches might be a suitable substratum for true epibenthic or even ‘phytal’ harpacticoids. The rough surface of coral skeletons may favour copepods with strongly prehensile maxillipeds and first legs for efficient clinging, but is unsuitable for taxa such as Porcellidiidae Sars, 1904 and Peltidiidae Sars, 1904. These families have dorso-ventrally flattened bodies and adapted mouthparts to facilitate adhesion to the smooth, flat thalloid surface of algae (Noodt, Reference Noodt1971; Hicks, Reference Hicks1980, Reference Hicks, Moore and Seed1985). Klumpp et al. (Reference Klumpp, McKinnon and Mundy1988) and Preston & Doherty (Reference Preston and Doherty1994) examined the crustacean cryptofauna associated with dead coral substrata and reported Thalestridae and Peltidiidae as important harpacticoid constituents. In those studies, coral fragments were colonized by filamentous algae and other epiphytes which might explain the presence of a typical phytal family such as Peltidiidae.
Multivariate analysis proved that gravel is not significantly different from the upper sediment layer (sed1) in terms of community composition. Only one genus, Zausodes, showed a significant preference for gravel in Matemwe. Zausodes, with its depressed habitus, most likely has an epibenthic lifestyle. The sediment assemblages from both locations differ distinctly in composition, especially in the middle and lower sediment layers, by the occurrence of paramesochrid genera (Meiopsyllus, Kliopsyllus and Apodopsyllus) at Matemwe and of Tetragonicipitidae (especially Diagoniceps) at Makunduchi. The granulometric analysis revealed that the coarse sand fraction was significantly more important at Makunduchi, which explains the occurrence of Tetragonicipitidae, generally a conspicuous member of coarse shell-gravel assemblages (Hicks & Coull, Reference Hicks and Coull1983). Paramesochridae are typically known as interstitial inhabitants of fine to medium sands. Several studies of carbonate reef-associated sediments also identified sediment granulometry as controlled by reef hydrodynamics (with its effect on other environmental variables) as an important structuring factor of the associated harpacticoid (Coull, Reference Coull1970; Villiers & Bodiou, Reference Villiers and Bodiou1996) and nematode communities (Ólafsson et al., Reference Ólafsson, Johnstone and Ndaro1995; Boucher, Reference Boucher1997; Ndaro & Ólafsson, Reference Ndaro and Ólafsson1999; Netto et al., Reference Netto, Warwick and Attrill1999; de Jesús-Navarrete, Reference de Jesús-Navarrete2003). The finer sediment of Matemwe appears to favour vermiform harpacticoids (Paramesochridae and Hastigerella Nicholls, 1935), which are adapted to move through narrow spaces between the sand grains. Evidently, the interstitial spaces in the coarser sand at Makunduchi are larger and this explains the pronounced occurrence of harpacticoids with fusiform prehensile body shape (mainly Ameiridae, Miraciidae and Tetragonicipitidae). These harpacticoids are generally larger and have well developed swimming legs, with which they can move through the systems of spaces between the larger sediment particles. Copepods with fusiform and depressed/compressed body shapes (Noodt, Reference Noodt1971; Coull, Reference Coull1977) were more dominant in the coral and gravel samples.
The differences between communities associated with coral, gravel and upper sediment layer are based in particular on different contributions of the taxa that are present. The coral assemblage is not composed of unique, specific families or genera restricted to this microhabitat, as is often found in algae or hard substrates (containing low levels of deposited sediments) which are distinct (or even largely non-overlapping) from adjacent sedimentary habitats (Hicks, Reference Hicks, Moore and Seed1985; Atilla et al., Reference Atilla, Wetzel and Fleeger2003). Species restricted to one of the microhabitats occurred only sporadically, with the exception of representatives of Apodopsyllus and Meiopsyllus in the sediment. However, although dissimilarity between coral samples of both locations is rather high (64.7%), this value is consistently lower than dissimilarity between coral and every other microhabitat within each location. This indicates that coral assemblages from both locations are slightly more comparable to each other in terms of faunal composition than they are to gravel and sediment layers within their respective location.
The harpacticoid fauna associated with different microhabitats investigated in this study appears to be controlled by the structural differences between coral, and gravel and sediment, and by changes in sediment grain size. Not only the nature of the substrate, but also the conditions encountered in these particular microhabitats (e.g. with respect to hydrodynamical stress and food availability) could be important structuring factors. Copepod species living phytally, epibenthically, or in the water column are known to have ecological traits which differ from those of sediment-dwelling species (Marcotte, Reference Marcotte and Schram1983; Hicks, Reference Hicks, Moore and Seed1985). The structurally complex dead coral fragments might provide a variety of food resources and meet the feeding requirements of both sediment and phytal taxa, which could also explain their co-occurrence in the coral fragments. In a comparable study of the associated nematode assemblages of coral sand, coral gravel and coral fragments, Raes et al. (Reference Raes, De Troch, Ndaro, Muthumbi, Guilini and Vanreusel2007) found that microhabitat type is a major structuring factor. They concluded that nematode communities are even more affected by changes in sediment grain size than by the structural differences between sediment and coral fragments. The coral fragments were considered preferable habitats particularly for nematodes able to withstand the current's eroding effect, such as the epifaunal Epsilonematidae and Draconematidae. Also, current activity can erode detritus from the coral fragments which would explain the low abundance of non-selective deposit feeding nematodes (Raes et al., Reference Raes, De Troch, Ndaro, Muthumbi, Guilini and Vanreusel2007).
Despite similar changes in harpacticoid composition across microhabitats at both locations, trends in species diversity were different. At Makunduchi, coral fragments sustained a more diverse assemblage (both in terms of species richness and evenness) than gravel and the different sediment layers, whereas at Matemwe, coral was not significantly different from gravel and upper sediment layer.
For phytal assemblages, several studies indicated that an increase in habitat complexity allows for a linear increase in harpacticoid species number and diversity (Hicks, Reference Hicks1980; Gee & Warwick, Reference Gee and Warwick1994; Ólafsson et al., Reference Ólafsson, Ingolfsson and Steinarsdottir2001; Jenkins et al., Reference Jenkins, Walker-Smith and Hamer2002). Greater habitable space, increased nutritional resources and reduced levels of predation contribute to this relationship. Coral skeletons at Makunduchi were generally less eroded and structurally more complex than at Matemwe. Although not quantified, it is assumed that the observed differences in complexity might be responsible for the different trends in diversity. Several studies on macrocrustacean cryptofauna have demonstrated that spatial separation of the (living) coral branches influences species abundance and faunal composition (Lewis & Snelgrove, Reference Lewis and Snelgrove1990; Vytopil & Willis, Reference Vytopil and Willis2001). Vytopil & Willis (Reference Vytopil and Willis2001) found greater abundance and species richness of macro-epifauna in tightly branched coral species in comparison to their rarity or absence in open-branched species and related this to the higher protection afforded by the more complex habitat structure. Similarly, the level of structural complexity of certain coral fragments might be high enough for the associated meiofauna to provide refuge against predation. Furthermore, coral form may have implications for the associated epifauna, including increased potential for niche separation (Begon et al., Reference Begon, Harper and Townsend1990) and modification of the local hydrodynamical environment (Helmuth et al., Reference Helmuth, Timmerman and Sebens1997) with consequences for the nutritional resources available.
This is the first study that includes coral degradation products (such as coral fragments and coral gravel) as a habitat for harpacticoid copepods. It is clear that by including these additional microhabitats, total species diversity of the tropical lagoon is increased substantially. As indicated by additive partitioning of diversity, these added species, however, are generally rare.
In conclusion, microhabitat type is important in structuring the associated harpacticoid assemblages. The coral fragments support a specific assemblage composed of epibenthic or phytal taxa with an addition of sediment-dwelling species. The observed differences in growth form and complexity of the coral fragments, with implications for habitable space, nutritional resources and level of predation might be important in structuring diversity of the associated assemblages.
ACKNOWLEDGEMENTS
The authors wish to thank Dr A. Dubi, Dr D.C.P. Masalu and the staff from the Institute of Marine Sciences in Zanzibar (University of Dar es Salaam, Tanzania). Dr M. Raes, Drs K. Guilini and R. Teerlynck (Marine Biology Section, Ghent University, Belgium) helped during sampling. Special thanks go to B. Beuselinck, D. Schram and A. Van Kenhove (Marine Biology Section, Ghent University, Belgium) for technical support. Two anonymous referees and the Executive Editor are kindly thanked for critically reading the manuscript and providing constructive remarks. The first and second authors acknowledge grants, as aspirant and postdoctoral fellow respectively, from the Fund for Scientific Research (FWO-Flanders, Belgium). The sampling campaign in Zanzibar was organized in the frame of the research project G.0199.03 ‘A Comparative Study of the Meio-Epifauna Associated with Tropical and Cold-Water Coral Reefs’ sponsored by the Fund for Scientific Research (FWO-Flanders, Belgium). This study was partly conducted in the frame of UGent-BOF-GOA research project 01GZ0705 ‘Biogeography and Biodiversity of the Sea’.
APPENDIX
List of identified families and genera (with number of morphospecies in parentheses) from the eastern coast of Zanzibar.
Ameiridae Monard, 1927
Ameira Boeck, 1865 (9 sp.)
Nitokra Boeck, 1865 (3 sp.)
Praeleptomesochra Lang, Reference Lang1965 (1 sp.)
Psyllocamptus T. Scott, 1899 (1 sp.)
Stenocopia Sars, 1907 (1 sp.)
Ameirinae gen. 1 (1 sp.)
Ancorabolidae Sars, 1909
Laophontodes T. Scott, 1894 (1 sp.)
Canthocamptidae Sars, 1906
Mesochra Boeck, 1865 (2 sp.)
Canthocamptidae gen. 1 (1 sp.)
Canuellidae Lang, 1944
Brianola Monard, 1926 (1 sp.)
Cletodidae T. Scott, 1905
Enhydrosomella Monard, 1935 (1 sp.)
Dactylopusiidae Lang, 1936
Dactylopusia Norman, 1903 (5 sp.)
Paradactylopodia Lang, 1944 (3 sp.)
Dactylopusiidae gen. 1 (1 sp.)
Ectinosomatidae Sars, 1903
Ectinosoma Boeck, 1865 (5 sp.)
Halectinosoma Lang, 1944 (2 sp.)
Halophytophilus Brian, 1917 (1 sp.)
Hastigerella Nicholls, 1935 (1 sp.)
Pseudobradya Sars, 1904 (1 sp.)
Sigmatidium Giesbrecht, 1881 (3 sp.)
Harpacticidae Sars, 1904
Harpacticus Milne-Edwards, 1840 (1 sp.)
Perissocope Brady, 1910 (2 sp.)
Zausodes C.B. Wilson, 1932 (2 sp.)
Laophontidae T. Scott, 1905
Esola longicauda Edwards, 1891
Heterolaophonte Lang, 1944 (1 sp.)
Laophonte cornuta Philippi, 1840
Laophonte ciliata Noodt, 1964
Laophonte inornata A. Scott, 1902
Paralaophonte Lang, 1944 (3 sp.)
Paralaophonte congenera (Sars, 1908)
Tapholeon tenuis Gheerardyn & Fiers, 2007
Laophontinae gen. 1 (1 sp.)
Longipediidae Sars, 1903
Longipedia Claus, 1863 (1 sp.)
Louriniidae Monard, 1927
Lourinia Wilson, 1924 (1 sp.)
Metidae Sars, 1910
Metis Philippi, 1843 (2 sp.)
Miraciidae Dana, 1846
Amphiascoides Nicholls, 1941 (2 sp.)
Amphiascus Sars, 1905 (8 sp.)
Bulbamphiascus Lang, 1944 (1 sp.)
Haloschizopera Lang, 1944 (1 sp.)
Paramphiascella Lang, 1944 (1 sp.)
Paramphiascopsis Lang, 1944 (1 sp.)
Robertgurneya Lang, 1944 (4 sp.)
Robertsonia Brady, 1880 (1 sp.)
Stenhelia (Delavalia) Boeck, 1865 (3 sp.)
Typhlamphiascus Lang, 1944 (1 sp.)
Normanellidae Lang, 1944
Normanella Brady, 1880 (1 sp.)
Paramesochridae Lang, 1944
Apodopsyllus Kunz, 1962 (4 sp.)
Kliopsyllus Kunz, 1962 (1 sp.)
Kliopsyllus furcavaricatus (Kunz, 1974)
Meiopsyllus Cottarelli & Forniz, 1994 (3 sp.)
Scottopsyllus Kunz, 1962 (1 sp.)
Parastenheliidae Lang, 1944
Karllangia Noodt, 1964 (1 sp.)
Parastenhelia Thompson & A. Scott, 1903 (2 sp.)
Peltidiidae Sars, 1904
Peltidium Philippi, 1839 (1 sp.)
Pseudotachidiidae Lang, 1936
Sentiropsis Huys & Gee, 1996 (1 sp.)
Rhynchothalestridae Lang, 1948
Rhynchothalestridae gen. 1 (1 sp.)
Tegastidae Sars, 1904
Tegastes Norman, 1903 (1 sp.)
Tetragonicipitidae Lang, 1944
Diagoniceps Willey, 1930 (1 sp.)
Phyllopodopsyllus T. Scott, 1906 (4 sp.)
Thalestridae Sars, 1905
Eudactylopus A. Scott, 1909 (1 sp.)
Tisbidae Stebbing, 1910
Scutellidium Claus, 1866 (2 sp.)
Tisbe Lilljeborg, 1853 (3 sp.)
Tisbella Gurney, 1927 (2 sp.)
Tisbidae gen. 1 (1 sp.)


