


Introduction
Young children with type 1diabetes are particularly prone to experiencing extreme fluctuations in glucose levels at a time when the developing brain is undergoing wide ranging maturational changes (Giedd & Rapoport, Reference Giedd and Rapoport2010). White matter proliferation, neuronal pruning, and refining of neuronal networks are all actively occurring in childhood (Bullmore & Sporns, Reference Bullmore and Sporns2012). Several studies assessing cognition in youth with early onset diabetes (EOD) have shown worse outcomes across a variety of cognitive domains, principally IQ (Northam et al., Reference Northam, Anderson, Werther, Warne, Adler and Andrewes1998; Rovet, Ehrlich, & Hoppe, Reference Rovet, Ehrlich and Hoppe1987), executive functions (Bjorgaas, Gimse, Vik, & Sand, Reference Bjorgaas, Gimse, Vik and Sand1997; Flykanaka-Gantenbein, Reference Flykanaka-Gantenbein2004; Lin, Northam, Rankins, Werther, & Cameron, Reference Lin, Northam, Rankins, Werther and Cameron2010; Ly, Anderson, McNamara, Davis, & Jones, Reference Ly, Anderson, McNamara, Davis and Jones2011), learning and memory (Gaudieri, Chen, Greer, & Holmes, Reference Gaudieri, Chen, Greer and Holmes2008; Lin et al., Reference Lin, Northam, Rankins, Werther and Cameron2010), and processing speed (Lin et al., Reference Lin, Northam, Rankins, Werther and Cameron2010; Northam et al., Reference Northam, Anderson, Jacobs, Hughes, Warne and Werther2001; Ryan, Vega, & Drash, Reference Ryan, Vega and Drash1985).
Many, but not all studies of adults and children with childhood-onset type 1diabetes (T1D) have documented an association between severe hypoglycemia (with seizures or loss of consciousness) and either poorer cognitive outcomes (Blasetti et al., Reference Blasetti, Chiuri, Tocco, Giulio, Mattei, Ballone and Verrotti2011; Hershey, Craft, Bhargava, & White, Reference Hershey, Craft, Bhargava and White1997; Hershey, Lillie, Sadler, & White, Reference Hershey, Lillie, Sadler and White2003, Reference Hershey, Lillie, Sadler and White2004; Hershey et al., Reference Hershey, Perantie, Warren, Zimmerman, Sadler and White2005; Lin et al., Reference Lin, Northam, Rankins, Werther and Cameron2010; Naguib, Kulinskaya, Lomax, & Garralda, Reference Naguib, Kulinskaya, Lomax and Garralda2009; Northam et al., Reference Northam, Anderson, Jacobs, Hughes, Warne and Werther2001; Perantie et al., Reference Perantie, Lim, Wu, Weaver, Warren, Sadler and Hershey2008; Rovet & Ehrlich, Reference Rovet and Ehrlich1999) or brain changes (Ferguson et al., Reference Ferguson, Blane, Perros, McCrimmon, Best, Wardlaw and Frier2003; Haumont, Dorchy, & Pelc, Reference Haumont, Dorchy and Pelc1979; Hyllienmark, Maltez, Dandenell, Luvigsson, & Brismar, Reference Hyllienmark, Maltez, Dandenell, Luvigsson and Brismar2005; Musen et al., Reference Musen, Lyoo, Sparks, Weinger, Hwang, Ryan and Jacobson2006; Northam et al., Reference Northam, Rankins, Lin, Wellard, Pell, Finch and Cameron2009; Perantie et al., Reference Perantie, Koller, Weaver, Lugar, Black, White and Hershey2011, Reference Perantie, Wu, Koller, Lim, Warren, Black and Hershey2007; Perros, Deary, Sellar, Best, & Frier, Reference Perros, Deary, Sellar, Best and Frier1997). There is preliminary evidence to suggest that this association can be detected quite early in young children and youth with recent onset diabetes (Aye et al., Reference Aye, Reiss, Kesler, Hoang, Drobny, Park and Buckingham2011). On the other hand, results from the Diabetes Control and Complications Trial (DCCT) long-term follow-up study showed no effect of severe hypoglycemia history on cognitive function in adults with T1D, even in the youngest age subgroup (ages 13–18 at study entry), who were carefully followed for an average of 18 years [The Diabetes Control and Complications Trial/Epidemiology of Diabetes Interventions and Complications (DCCT/EDIC) Study Research Group, 2007]. However, the DCCT cohort may not be entirely representative of the T1D population. For example, approximately 83% of DCCT participants had no severe hypoglycemic episodes in their past, and, due to exclusion criteria, no subject had more than two severe episodes in the 2 years before enrollment or evidence of hypoglycemia unawareness.
Chronic hyperglycemia exposure may also affect the brain, targeting both grey and white matter. Compared to hypoglycemia, however, there is less information on the effects of hyperglycemia on the developing brain. Greater hyperglycemia exposure has been associated with abnormal grey and white matter volumes (Perantie et al., Reference Perantie, Koller, Weaver, Lugar, Black, White and Hershey2011, Reference Perantie, Wu, Koller, Lim, Warren, Black and Hershey2007), decrements in processing speed (Jacobson et al., 2011) and verbal intelligence (Perantie et al., Reference Perantie, Lim, Wu, Weaver, Warren, Sadler and Hershey2008).
This study was designed to investigate cognitive effects of T1D in young children (4 to <10 years old) as compared with healthy controls, and to characterize the influence of intensity and frequency of fluctuations in glucose levels (glycemic excursions) on cognitive functioning in children with T1D. Novel aspects of this study include capture of a young cohort with relatively recent disease duration, careful control of possible influencing factors including parental IQ and mood status, as well as concurrent collection and analysis of neuroimaging data including DTI and whole brain morphometry using voxel-based morphometry (VBM). The neuroimaging results are reported in full elsewhere (Barnea-Goraly N et al., Reference Barnea-Goraly, Raman, Mazaika, Marzelli, Hershery, Weinzimer and Reiss2013; Marzelli et al., Reference Marzelli, Barnea-Goraly, Mazaika, Hershey, Tsalikian, Tamborlane and Reiss2013)
Our cohort offers unique insights to the earliest impact of dysglycemia on cognition. We hypothesized that cognitive differences would be observed in all key domains: IQ, executive functions, memory, and processing speed. We hypothesized further that degree of cognitive differences would be associated with level of dysglycemia.
Research Design and Methods
This study was conducted across the five clinical centers of the Diabetes Research in Children Network (DirecNet) after review and approval by local Institutional Review Boards and the NIH-designated Data Safety Monitoring Board (DSMB). Parents or guardians provided written informed consent, and children of appropriate age (per local Institutional Review Board) also provided assent. These data represent a portion of baseline evaluation conducted as part of a larger longitudinal study that includes neuroimaging. Children between 4 and <10 years of age with T1D diagnosed before age 8 and healthy control participants were recruited. Eligibility criteria for the T1D participants included onset of T1D after 6 months of age and use of daily insulin therapy for at least 1 month. For all participants exclusion criteria were as follows: preterm birth before 34 weeks gestation, low birth weight (less than 2000 grams), intellectual or learning disability (based on parent-report), prior inpatient psychiatric treatment or any neurologic disease not related to diabetes. Control participants included siblings and community volunteers. Recruitment was monitored and suspended as needed to achieve a balance (within 10%) of T1D participants and control participants by the following age groups (4–<5, 5–<6, 6–<7, 7–<8, 8–<9, and 9–<10 years) and by gender. Eligibility criteria for the healthy controls included HbA1c< 6.0% (42 mmol/mol), fasting blood glucose (BG)<110 mg/dL, and for siblings of T1D participants, documented negative pancreatic autoantibodies (ICA, anti-insulin, anti-GAD). Target sample sizes after adjusting for attrition and missing data were 140 participants with T1D and 70 healthy controls to detect an effect size of 0.5 for each cognitive domain.
Participants
A total of 144 participants with T1D and 72 healthy controls participated in the study. Average age was 7 years for both groups (range, 4.0 to <10 years). The T1D and control groups had similar gender distributions, parent education, and income levels (Table 1). The T1D cohort had a median duration of diabetes of 2.5 years, ranging from 0.1 to 7.9 years. Among children with T1D 16% (n = 23) had a history of at least one episode of severe hypoglycemia and 36% (n = 51) had a history of diabetic ketoacidosis (DKA), mostly at the time of diagnosis.
Table 1 Demographics by group

aIncludes 18 participants with one episode, 3 with two, 1 with three, and 1 with five episodes.
bAmong 21 T1D participants, 11 reported T1D and 10 reported T2D; among 9 HC participants, 4 reported T1D and 5 reported T2D. Excludes 3 T1D participants for whom the biological parents’ information was not available.
cOnly HC participants were asked if they had relative with T1D. Eight participants reported T1D siblings who are not in the study, 3 reported parent, 1 reported grandparent and 1 reported first-cousin with T1D.
dHighest of primary and secondary care givers.
eExcludes 10 T1D and 6 HC participants who selected ‘do not know’ or ‘do not want to answer.’
fOne HC subject has missing IQ test.
Glycemic Control
For the T1D participants, available HbA1c levels were obtained from medical records. History of severe hypoglycemia since the time of diagnosis was obtained from parent report. Severe hypoglycemia was defined as requiring assistance of another person to actively administer carbohydrate, glucagon, or other resuscitative actions due to altered consciousness. T1D participants wore a continuous glucose monitor (CGM) to collect a minimum of 72 hr of glycemic data with at least 24 hr of overnight data collection. For those participants who were using a CGM for routine management of their diabetes, the CGM data were collected from their own CGM. For those not using a CGM for management purposes, an iPro2 (Medtronic MiniMed, Inc., Northridge, CA) or DexCom SEVEN Plus (DexCom, Inc., San Diego, CA) was provided to the participant at no cost. The study devices were blinded, meaning that the participant did not have access to the CGM results in real time. The median (interquartile range) of CGM use was 93 (83, 107) hr during daytime (6 am – 10 pm), and 48 (42, 56) hr during nighttime.
Neurocognitive Testing
An age-appropriate neurocognitive battery was administered by trained personnel certified by the DirecNet neurocognitive core (T. Hershey and A. Cato). Standard neuropsychological age-specific measures and behavioral questionnaires were used to derive cognitive, mood, and behavioral domains of interest. Domains assessed in the children included IQ, Executive Functions, Learning and Memory, Processing Speed, parent-reported executive functioning, externalizing behavior, and internalizing mood symptoms (Table 2). The assignment of tasks to each cognitive domain was based on clinical experience. A parent/guardian also completed an abbreviated IQ measure. On an a priori basis, the cognitive domains were considered primary outcomes; the parent-reported measures of mood and behavior were considered secondary outcomes; and parent IQ was selected as a planned covariate.
Table 2 Neurocognitive Test Battery: Domains and Measures

aThe z score was calculated for each measure using mean and SD from the current study pooling all participants (N = 214). For domains with more than one test, the average was taken giving equal weight to each z score.
bCMS = Children's Memory Scale (Cohen, Reference Cohen1997); CPT = Continuous Performance Test (Connors, Reference Connors1994); NEPSYII = Neuropsychological Battery for Children, Second Edition (Korkman, Kirk, & Kemp, Reference Korkman, Kirk and Kemp2007); WJIII Cognitive = Woodcock-Johnson Test of Cognitive Abilities, Third Edition (Woodcock, McGrew, & Mather, Reference Woodcock, McGrew and Mather2001); WPPSI3 = Wechsler Preschool and Primary Scales of Intelligence, Third Edition (Wechsler, Reference Wechsler2002); WASI = Wechsler Adult Scale of Intelligence (Wechsler, Reference Wechsler1999); BRIEF = Behavior Rating Inventory of Executive Functions (Gioia, Isquith, Guy, & Kenworthy, Reference Gioia, Isquith, Guy and Kenworthy2000); BASCII PRS = Behavior Assessment System for Children, Second Edition Parent Rating Scales (Reynolds & Kamphaus, Reference Reynolds and Kamphaus2004).
cSame version given regardless of age.
dAge-based standard score from WJIII Cognitive normative update (NU) sample.
eAge-based scaled score derived from Wechsler normative sample.
For T1D participants, at the time of neurocognitive testing BG concentrations needed to be between 70 and 300 mg/dL. During testing they were monitored for symptoms of hypoglycemia and BG levels were assessed at least twice at regular, planned intervals, by fingerstick on a home glucose meter. Insulin or food was given to titrate BG levels as needed. Ketones were evaluated in cases of BG > 300 mg/dL and if positive, testing was postponed. Testing was also suspended if BG dropped <70, and resumed only when BG again read within 70–300 mg/dL. Test protocols were double scored at a centralized location (Washington University in St. Louis), and the results were then analyzed at the DirecNet Coordinating Center (Jaeb Center for Health Research, Tampa, FL).
Statistical Methods
A Z-score was calculated for each measure using mean and SD from the current study pooling all participants (N = 214) (Manschot et al., Reference Manschot, Brands, van der Grond, Kessels, Algra, Kappelle and Biessels2006; van den Berg et al., Reference van den Berg, Reijmer, de Bresser, Kessels, Kappelle and Biessels2010). The calculations were based on ranks using van der Waerden scores to account for some skewness in the distributions. For domains with more than one measure, the composite Z-score was taken as an average giving equal weight to each Z-score. Domain scores were omitted in participants who did not complete all sub-domain measures. Repeated measures least squares regression models were used to account for the possibility that outcomes from siblings may be correlated. These models compared children with versus without T1D on each of the domains and subdomain measures adjusting for age, gender, and parent IQ. The parent-reported child depression score was used as an additional covariate for subdomain analyses as presence of depressive symptoms can have a deleterious effect on cognition (Murrough, Iacoviello, Neumeister, Charney, & Iosifescu, Reference Murrough, Iacoviello, Neumeister, Charney and Iosifescu2011).
Primary outcome domains were pre-defined as Delayed Memory, Executive Functions, Processing Speed and IQ. Secondary outcomes included parent ratings of executive functioning, externalizing behavior symptoms and internalizing mood symptoms. Upon inspection of the data, a ceiling effect was observed for the Delayed Memory domain. This domain was therefore replaced with the domain of Learning and Memory using subdomain measures that did not exhibit any ceiling effect in the results. Because this was not a pre-specified domain, it is considered a secondary outcome in this analysis. All p-values presented in this manuscript are nominal p-values without correction for multiple comparisons. For the four primary domains, the Hochberg step up approach (Hochberg, Reference Hochberg1988) was used to adjust the threshold defining statistical significance to account for multiple comparisons. No formal correction for multiple comparisons was made for the other secondary domains. Effect sizes were calculated for individual subdomains based on the estimated difference and standard error from a regression model adjusting for the factors mentioned above. Subdomain analyses were considered secondary and p-values were only calculated for the composite domains to mitigate the problem of multiple comparisons.
Within the T1D cohort, additional exploratory analyses were performed using variables specific to diabetes to characterize the influence of glycemic excursions on cognitive functioning. Hyperglycemia exposure was estimated by creating a hyperglycemic index from all available HbA1c measurements, calculating the incremental area under the curve (AUC) above an HbA1c level of 6.0% (42 mmol/mol) using the trapezoid rule. The median (interquartile range) for total number of HbA1c measurements was 11 (6, 18) overall and 4 (4, 6) measurements per year. CGM indices (mean glucose, % readings in target range, % readings in hypoglycemic range, coefficient of variation) were calculated giving equal weight to each of the 24 hr of the day (Diabetes Research in Children Network Study Group, 2007). Other diabetes-specific variables included age of onset, duration of diabetes, and presence or absence of severe hypoglycemia history. Spearman partial correlations were conducted between these variables and each of the cognitive domains, adjusting for age, gender and parent IQ. No formal correction was made for the large number of statistical comparisons arising from combinations of each of these factors with the cognitive data. All p-values above .01 were considered not statistically significant.
Results
Primary Outcomes
Covarying for age, gender, and parent IQ, there were trends for children with T1D to score lower than age-matched controls in the domains of IQ and Executive Functions (both p = .02, not statistically significant adjusting for multiple comparisons). There was no significant difference between groups for Processing Speed (p = .25, Table 3).
Table 3 Comparison of T1D and HC participants on cognition, behavior, and mood

aNominal p-value uncorrected for multiple comparisons. Obtained from repeated measures least squares regression models, adjusted for siblings from same family, age, gender, and parent IQ.
bHigher scores are better.
cHigher scores are worse.
Secondary Outcomes
Learning and memory (p = .46) did not differ between the groups. Parents reported more internalizing problems in children with T1D (p < .001). Level of externalizing problems (p = .73), parent-reported executive functioning problems (p = .26) did not differ between the groups.
Sub-domain Analyses
Within the internalizing domain, parents of children with T1D reported higher levels on sub-domains of depression, somatization, and anxiety (Figure 1). Subsequent sub-domain analyses included level of parent-reported child depression as an additional covariate to ensure that changes in cognitive function were not impacted by degree of depressive symptoms. Within the executive functions domain, additionally covarying for depression, all sub-domain measures but one (CMS Numbers) differed between the groups. In children with T1D, scores trended lower on measures of visual sustained attention (effect size = 0.34), auditory sustained attention (effect size = 0.31) and novel concept formation (effect size = 0.30). Scores also trended lower in children with T1D for both verbal (effect size = .38) and performance IQ (effect size = .17) as well as verbal (effect size = 0.24) but not visual learning and memory (effect size = −0.001).
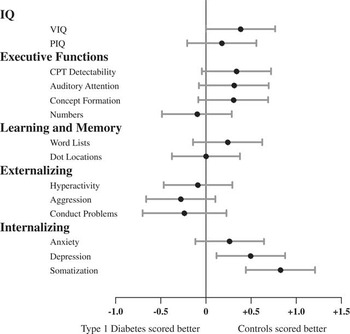
Fig. 1 Estimated effect sizes for cognitive subdomains. The dot represents the point estimate and the width of the bars represents a 99% confidence interval. The confidence intervals are not otherwise corrected for multiple comparisons. For the domains of Executive Functions, IQ, and Learning and Memory, effect sizes to the right of the vertical line indicate that the control group scored higher. For Externalizing and Internalizing domains, scores are reversed such that effect sizes to the right of the vertical line indicate that the control group had less symptoms.
Relationship to Glycemic Variables
Within the T1D group, children with a history of DKA and severe hypoglycemia (DKA & SH, N = 12) trended as having lower scores on the IQ measure (p = .06) relative to those with no history of either DKA or SH (Table 4). Trends were also observed across several indices in the direction of a deleterious effect of hyperglycemia on IQ, Executive Functions, and Learning and Memory. Trends included the hyperglycemic index based on all HbA1c values. Chronic hyperglycemia indexed by averaged A1c AUC above 6.0% (see methods) was associated with lower Child IQ (p = .05) and Learning and Memory (p = .05) domain scores (Table 5). From the CGM data, T1D cases with a higher percentage of euglycemia (glucose values between 71 and 180 mg/dL) had higher scores within the Executive Functions domain (p = .01) (Table 6). Trends included that hyperglycemia was associated with lower scores on the Executive Functions domain, such that the percentage of time blood glucose values were above 180 mg/dL was associated with a lower Executive Functions domain score (p = .04). A final trend was that a higher mean glucose score was associated with a lower Executive Functions domain score (p = .03).
Table 4 Cognitive outcomes by DKA and severe hypoglycemia

a p-Value from generalized least square regression models, adjusted for age, gender, and parent IQ, diabetes duration, and incremental AUC above HbA1c level of 6.0%. Statistical comparison is made between the two most extreme groups (i.e., severe vs. none for DKA history, seizure/coma vs. none for SH history, DKA & SH vs. No DKA/SH for combination).
Table 5 Cognitive outcomes by diabetes history among T1D subjectsFootnote a

a Results from Spearman partial correlations controlling for age, gender, and parent IQ.
Table 6 Cognitive outcomes by glycemic indices measured by CGM data among T1D subjectsFootnote a

a Results from Spearman partial correlations controlling for age, gender, and parent IQ.
Discussion
In this cohort of young children with T1D, trends toward cognitive differences were observed relative to controls in the areas of intellectual ability and executive functions (both p = .02) after accounting for parent IQ and level of parent-reported depression. These findings are subtle and did not meet our threshold for statistical significance. The clinical significance of the findings is uncertain, given the modest effects. Nonetheless, the findings are in keeping with Aye et al. (Reference Aye, Reiss, Kesler, Hoang, Drobny, Park and Buckingham2011). Together, results suggest that cognitive differences may emerge in young children with T1D, even after relatively short disease duration. Mood differences were identified in the form of more somatic, depressive, and anxious symptoms. The mood differences observed in this young cohort are consistent with extant literature, particularly during the time around diagnosis (Kovacs, Goldston, Obrosky, & Bonar, Reference Kovacs, Goldston, Obrosky and Bonar1997).
One could surmise that we did not find more pronounced cognitive differences because of the high functioning nature of our cohort. Baseline IQ findings in the Lin et al. Reference Lin, Northam, Rankins, Werther and Cameron2010 study, however, were quite similar (Average FSIQ of 108 for T1D patients and 110 for Controls). That said, it is possible that cognitive differences might be identified earlier or in a more pronounced manner in the overall population of children with type 1 diabetes. An additional possibility is that our test battery was not sufficiently sensitive to detect cognitive differences. Tests in wide clinical use were selected for this protocol. It is possible that use of tasks from the experimental or cognitive literature (e.g., Hershey's spatial delayed memory task) might have yielded more robust findings.
In keeping with the benefits of euglycemia on the developing brain, T1D youth in this cohort who spent more time in euglycemia performed better on measures of executive functions. Furthermore, trends in the data suggested a deleterious effect of hyperglycemia on executive functions. Overall, however, associations between dysglycemia and cognition did not meet our threshold for statistical significance. We suspect that the relationship between cognitive findings and glycemic variables may become more easily detectable after longer disease duration or in children of an older age. Indeed, in other prospective studies in which a relationship between glycemic variables and cognitive functions were reported, the cohorts included older children. Northam, Anderson, Werther, Warne, and Andrewes (Reference Northam, Anderson, Werther, Warne and Andrewes1999), who studied children at the time of diagnosis and 2 years following disease onset, found significant relationships between cognitive findings (executive functions of auditory attention, working memory; and verbal and visual learning and memory) and both chronic hyperglycemia and recurrent severe hypoglycemia. It is important to note, however, that these associations were confined to the older children in the cohort within the age range of 7 to 14. Likewise, Hershey et al. (Reference Hershey, Perantie, Warren, Zimmerman, Sadler and White2005) reported a relationship between repeated (⩾3 episodes) severe hypoglycemia and spatial memory performance. This combined cohort consisted of an older age group, ages 6–18. Hershey and colleagues reported the finding once more in a prospective study (Perantie et al., Reference Perantie, Lim, Wu, Weaver, Warren, Sadler and Hershey2008) with a cohort ranging in age from 5 to 16 with similar findings of relationship between spatial memory and hypoglycemia. In these reports, findings were most pronounced in older children with early diabetes onset (< 5years) and longer disease duration.
With longer disease duration, a larger variety of cognitive differences have been reported by Northam and by Hershey, among others, including the domains of verbal intellectual ability, working memory, and processing speed. After 12 years of disease duration, risk factors of EOD, severe hypoglycemia and poor metabolic control (hyperglycemia) were found to be additive, particularly for verbal IQ subtests and executive functioning tasks (Lin et al., Reference Lin, Northam, Rankins, Werther and Cameron2010). These previous findings related to verbal IQ are particularly interesting in light of trends toward lower verbal IQ and lower verbal learning and memory functioning in our cohort of young children with T1D.
It is possible that early central nervous system (CNS) insult in the form of either severe DKA or SH (with seizure/coma) could have a delayed impact on cognition such that with time, the disparity in cognitive scores could grow larger. Likewise, individuals with less severe CNS insult but with glycemic dysregulation may show cumulative impact over time or delayed onset of cognitive deficits. A clinical correlate is noted in young children treated with cranial radiation therapy (RT). The cumulative impact of RT and chemotherapy on young children's cognitive outcomes emerges over time as revealed in the late effects literature (Yeates, Ris, Taylor, & Pennington, Reference Yeates, Ris, Taylor and Pennington2010).
One purported mechanism to explain these conclusions is that damage to white matter development and proliferation results in neurocognitive deficits. Likewise, CNS insult to children with EOD may have a delayed, progressive and cumulative impact on cognition over time. Concurrent baseline neuroimaging analysis performed by our DirecNet study group with this cohort supports the hypothesis that white matter disruption has occurred at this early stage in disease progression. Using DTI, white matter integrity differences were found such that in our cohort, children with T1D had reduced axial diffusivity (AD) in multiple widespread brain regions when compared with controls. Within the T1D group, earlier onset of diabetes, longer disease duration, and higher HbA1c values significantly influenced white matter findings (Barnea-Goraly et al., Reference Barnea-Goraly, Raman, Mazaika, Marzelli, Hershery, Weinzimer and Reiss2013). In addition, our group used whole brain structural analysis (VBM) to reveal group differences in this young cohort including decreased gray matter volume (GMV) in several posterior regions and increased GMV in regions within the temporal and prefrontal cortices. Again, dysglycemia was significantly related to the observed brain structure differences (Marzelli et al., Reference Marzelli, Barnea-Goraly, Mazaika, Hershey, Tsalikian, Tamborlane and Reiss2013).
In summary, cognitive differences are subtle in young children with T1D at relatively short disease duration (2.5 years on average). These results lead us to hypothesize that the identified trends toward group differences are likely related to the impact of glycemic variability on the developing brain, and over time, the effects become more pronounced and thus, more easily detected. Longitudinal follow up of this cohort will better characterize any association of these cognitive changes with dysglycemia.
Important next steps in our cohort of young children are to determine whether these differences become more pronounced over time and to determine whether stronger relationships emerge between observed cognitive differences and glycemic variables. Furthermore, cognitive testing along with concurrent neuroimaging studies over time will help reveal if dynamic changes in brain systems, such as perturbations in white matter proliferation during this time frame, relate to the observed cognitive findings in children with T1D.
Acknowledgments
We thank all the participants and their families for their participation. This research was supported by funding from Jaeb Center for Health Research and the NIH (DIRECNET U01 HD41890, HD41890-10, HD41906-10, HD41908-10, HD41915, HD41918, HD56526) and UL1 RR024992. A.Cato, N. Mauras, C. Kollman, P. Cheng, R. Beck, K. Ruedy, J. Ambrosino and T. Aye, have no relevant conflict of interest to disclose. T. Hershey reports receiving payment for consultancy for an NIH grant review, payment from Washington University as a faculty member, and payment for work on the Scientific Advisory board for the Tourette Syndrome Association. She also reports money paid to her institution from the NIH for a pending grant. A. Reiss reports money paid to his institution from the NIH for a pending grant. A. Conrad reports receiving payment from the University of Iowa for time conducting evaluations. N. White reports receiving payment for consultancy from Novo Nordisk and Daiichi Sankyo. Prior presentation of study data occurred at the American Diabetes Association meeting in Philadelphia in June, 2012. The information in this manuscript has never been published either electronically or in print.
The DirecNet Study Group: Clinical Centers: (Personnel are listed as (PI) for Principal Investigator, (I) for co-Investigator and (C) for Coordinators.) Department of Pediatrics, University of Iowa Carver College of Medicine, Iowa City, IA: Eva Tsalikian, MD (PI); Michael J. Tansey, MD (I); Julie Coffey, MSN (C); Joanne Cabbage (C); Sara Salamati (C); Nemours Children's Clinic, Jacksonville, FL: Nelly Mauras, MD (PI); Larry A. Fox, MD (I); Allison Cato, PhD; (I); Kim Englert, RN, BSN, CDE (C); Kaitlin Sikes, ARNP, MSN (C); Tina Ewen (C); Division of Pediatric Endocrinology and Diabetes, Stanford University, Stanford, CA: Bruce A. Buckingham, MD (PI); Darrell M. Wilson, MD (I); Tandy Aye, MD (I); Kimberly Caswell, ARNP (C); Department of Pediatrics, Yale University School of Medicine, New Haven, CT: Stuart A. Weinzimer, MD (PI); William V. Tamborlane, MD (I); Amy Steffen, BS (C); Kate Weyman, MSN (C); Melinda Zgorski, BSN (C) ; Washington University in St. Louis, St. Louis, MO: Neil H. White, MD, CDE (PI); Ana Maria Arbelaez, MD, (I); Lucy Levandoski, PA-C (C); Angie Starnes, RN, BSN, CDE (C), Tamara Hershey, PhD (I); Coordinating Center: Jaeb Center for Health Research, Tampa, FL: Roy W. Beck, MD, PhD; Katrina J. Ruedy, MSPH; Craig Kollman, PhD; Peiyao Cheng, MPH; Beth Stevens; Image Coordinating Center: Allan L. Reiss, MD; Naama Barnea-Goraly, MD; Matthew J. Marzelli, BS; Paul M. Mazaika, PhD; Cognitive Core: Tamara Hershey, PhD; Colleen Considine; Aiden Bondurant; Michaela Cuneo; Emily Bihun; Sarah June Grafeman, PhD.


