


The Kütahya province of Turkey has been known as a significant ceramic production centre in Anatolia since the early Bronze Age (Bilgen, Reference Bilgen2015). Therefore, several geological studies have been conducted on the Neogene sediments in this region (Ataman & Baysal, Reference Ataman and Baysal1978; Yalçın, Reference Yalçın1984; Yalçın & Gündoğdu, Reference Yalçın, Gündoğdu, Gündoğdu and Aksoy1985; Işık et al., Reference Işık, Yanık and Aykul1997, Reference Işık, Göçmez, Yanık and Ceylantekin2004; Çolak et al., Reference Çolak, Helvacı and Maggetti2000; Göçmez et al., Reference Göçmez, Ceylantekin, Yanık, Işık and Ediz2004; Sayın, Reference Sayın2007, Türkmenoğlu & Yavuz-Işık, Reference Türkmenoğlu and Yavuz-Işık2008; Yanık, Reference Yanık2011; Yanık et al., Reference Yanık, Ceylantekin, Taşçı and Özçay2012). The clay deposits of this region and their reserves have been studied by Türk (Reference Türk1975), Okut et al. (Reference Okut, Demirhan and Köse1978) and Işıklar and Demirhan (Reference Işıklar and Demirhan1982). The kaolin occurrences with total reserves of 1,000,000 tonnes might economically be exploited by the ceramic industry in the region (Sayın, Reference Sayın2007). The regional geological setting of the Gümüşköy area was reported by Fischbach (Reference Fischbach1900), Kalafatçıoğlu (Reference Kalafatçıoğlu1962), Ildız (Reference Ildız1967), Aksan and Urgancıoğlu (Reference Aksan and Urgancıoğlu1970), Özker (Reference Özker1970), Aksan (Reference Aksan1971), Eraslan (Reference Eraslan1971) and Vıcıl (Reference Vıcıl1982). These research studies, which were mostly focused on silver exploration, did not adequately address the clay deposits. This study examines the Gümüşköy red firing clay deposit (Kütahya, Turkey) and aims to identify the bulk and clay mineralogy and determine its ceramic properties.
GEOLOGICAL SETTING
The investigated area is located 40 km northwest of Kütahya province, western Anatolia (Fig. 1). The Palaeozoic metamorphic Şahin Formation comprises the oldest basement rocks in the Gümüşköy region. The Şahin Formation contains low-grade mica schist, chlorite schist, calc-silicate schist and marbles. The Miocene Tavşanlı volcanites (tuff, tuffite and agglomerate) uncomformably overlie the basement rocks. The Early Pliocene Çokköy Formation (alternations of limestone, sandstone, conglomerate and tuffite) is transitional laterally and vertically with the Late Miocene Emet Formation (marl, limestone and dolomitic limestone). Finally, the Bozyer Formation (slightly consolidated clastic sediments) unconformably overlies the previous rocks in the study area (Fig. 1) (Yanık et al., Reference Yanık, Ceylantekin, Taşçı and Özçay2012).
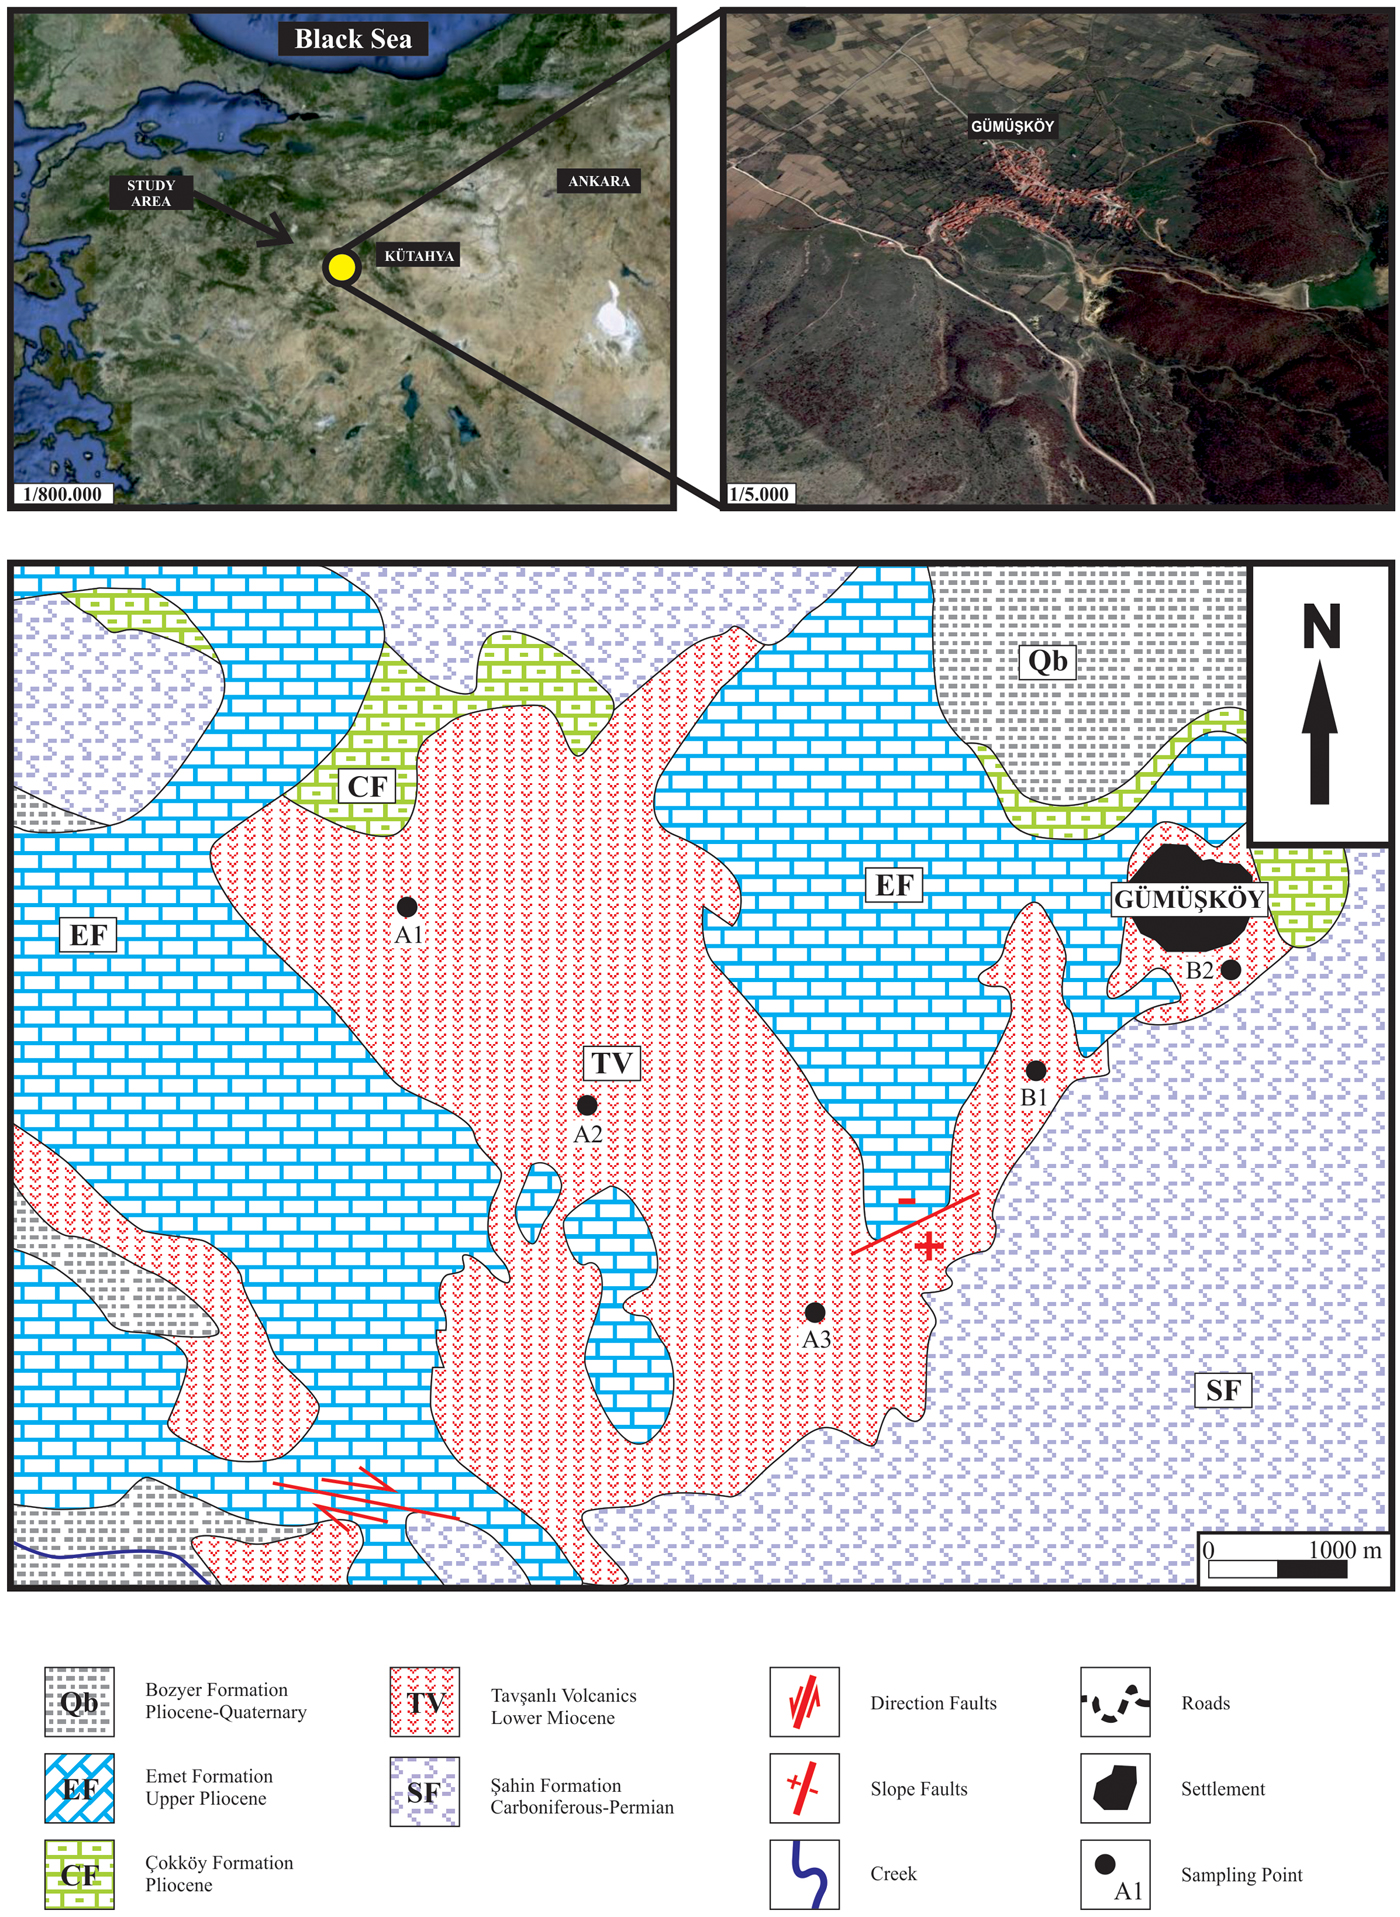
Fig. 1. Location and geological map of studied area (modified from Arık, Reference Arık2002).
The Miocene volcanism in western Turkey yielded Neogene tuffs and tuffaceous rocks in the investigated area (Vıcıl, Reference Vıcıl1982). The volcanism in the Kütahya basin is associated with the tectonic activities of western Turkey and more specifically with north–south-directed shortening and compression related to the collision of the Pontides and the Anatolide–Tauride platform (Şengör & Yılmaz, Reference Şengör and Yılmaz1981; Şengör, Reference Şengör, Erol and Oygür1982; Şengör et al., Reference Şengör, Görür, Şaroğlu, Biddle and Christie-Blick1985). This activity continued until the Late Miocene and was followed later by north–south-oriented extension (Sayın, Reference Sayın2007).
MATERIALS AND METHODS
Five representative clay samples, #A1, #A2, #A3, #B1 and #B2, were collected from the Tavşanlı volcanites in the study area corresponding to the two different-coloured vertical layers, homogeneously distributed within the deposit. Samples #A1, #A2 and #B1 were whitish and #A3 and #B2 were reddish in colour. Sample locations are shown in Fig. 1. The kaolin zone overlays the basement rocks, and its thickness ranges from 20 to 35 m.
The petrographical and mineralogical studies were performed by optical microscopy (OM), X-ray powder diffraction (XRPD), differential thermal analysis (DTA) and scanning electron microscopy (SEM).
The mineralogical study was carried out on random bulk samples and the <2 µm clay fraction. The clay fraction was obtained by sedimentation after ultrasonic disaggregation in distilled water for ~15 s (Elma P120H Sonifier), followed by centrifugation using a Hettich Universal 320 super-speed centrifuge at 6000 rpm for 6 min. Sodium pyrophosphate was added to the clay/water suspension as a dispersing agent (Moore & Reynolds, Reference Moore and Reynolds1997).
The <2 μm size fraction was siphoned off and centrifuged for 1 h at 6000 rpm. XRPD traces of oriented slide samples that had been air-dried, glycolated and heated at 550°C for 1 h were used for mineralogical analysis.
A PANalytical Empyrean (ILTEM-Dumlupınar University, Turkey) high-resolution XRPD (Cu-Kα radiation, Ni β filter) was used for the mineralogical analysis of the bulk sample and the <2 μm clay fraction fractions. The device parameters throughout the data collection were 45 kV and 40 mA, scanning range 2–70°2θ with a step size of 0.026°. The sample stage was of a reflection–transmission spinner type (transmission mode).
The mineral phases in the clay and fired samples were identified with HighScore Plus V.4.5 (PANalytical) software in combination with the Inorganic Crystal Structure Database (ICSD) and Crystallography Open Database (COD; version 2016). Quantification of the samples was done using HighScore Plus software, based on the Rietveld method (Degen et al., Reference Degen, Sadki, Bron, König and Nénert2014).
The DTA and thermogravimetric analysis (DTA-TG) of the clay samples was performed in the temperature range from ambient to 1200°C with a ramp of 10°C min–1, using a Setaram-labsys Evo analyser (ILTEM-Dumlupınar University, Turkey). A total of 40 mg of powdered clay samples was used for the analysis.
The chemical composition of the samples was determined with an Axios (PANalytical) X-ray fluorescence spectrometer (ILTEM-Dumlupınar University, Turkey). The bulk clay samples were ground to fine powder mixed with lithium tetraborate and melted to form fusion beads. The loss of ignition (LOI) was determined by calcination at 1050°C.
An FEI Nova Nano 650 scanning electron microscope with an energy dispersive X-ray spectrometer (SEM-EDX) was used for mineral identification (ILTEM-Dumlupınar University, Turkey). The micro-morphological properties of gold-coated, fired samples were defined with Zeiss Supra 50 VP SEM at Anadolu University.
The samples were analysed for their particle size distribution, plasticity, water absorption, apparent porosity, linear shrinkage, bulk density (TS EN ISO 10545-3, 2000) and dry and fired bending strengths (TS EN ISO 10545-4, 2014). The plasticity of the clay specimens was identified by the Pfefferkorn plasticity test method (Modesto & Bernardin, Reference Modesto and Bernardin2008).
The clay samples were ground in aqueous media in a porcelain jar using alumina balls. Powdered clay samples were humidified and shaped into bars (110 × 55 × 5 mm) with a hydraulic pressure of 30 MPa. These bars were dried at 105°C and fired at 1200°C for 2 h, with a heating and cooling rate of 10°C min–1. The samples were characterized by total shrinkage and dry bending strength (TS EN ISO 10545-4). Total shrinkage (100 × [L G – L T] × L G–1) was determined considering the length of the green and fired bars, L G and L T, respectively. The colour parameters L*, a* and b* (L* = lightness, a* = redness and b* = yellowness) of fired samples at 1200°C were measured using a Konica Minolta spectrophotometer. Finally, particle-size distribution measurements were performed with a Malvern Mastersizer 3000 particle size analyser.
RESULTS AND DISCUSSION
Mineralogical characterization
The kaolin clay levels were recognized in the rhyolitic and silicified rhyodacitic tuffs/tuffaceous rocks in the field (Tavşanlı volcanites). The rhyolitic tuffs start with green clay levels at the bottom and contain gravels of the basement schist at the lower levels. The same level is composed of a grey–white kaolinized tuff. The rhyolitic tuffs continue upwards with argillized and kaolinized levels, which encompass silicified tuff lens. The kaolin tuffs consist mainly of quartz, andesine plagioclase, sanidine and biotite embedded in a fine-grained kaolinitic matrix.
The silicified rhyodacitic tuffs consist primarily of quartz, andesine, sanidine, scarce biotite and opaque minerals. The kaolin clayey levels are typically strataform and whitish and pinkish in colour, with a thickness of 15–20 m.
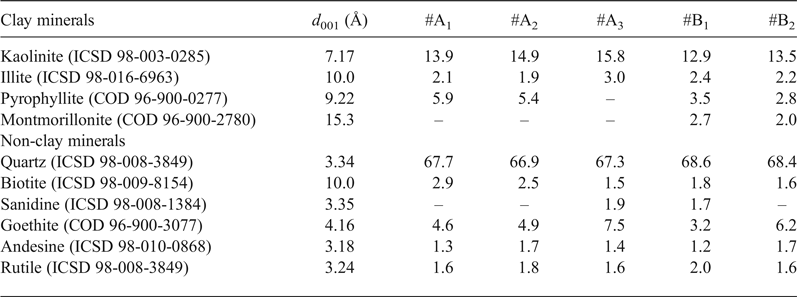
The bulk mineralogy of the tuffaceous rocks consists of quartz (67.3–68.6 wt.%), andesine (1.2–1.7 wt.%), biotite (1.5–2.9 wt.%), sanidine (0–1.9 wt.%), rutile (1.6–2.0 wt.%), goethite (3.2–7.5 wt.%) and clay minerals (Fig. 2; Table 1). The clay minerals present are kaolinite (12.9–15.8 wt.%), illite (1.9–2.4 wt.%), pyrophyllite (2.8–5.9 wt.%) and montmorillonite (0–2.7 wt.%). Tubular halloysite crystals 300–400 nm long and 30–70 nm wide were detected under SEM in some samples (e.g. #A2; Fig. 3).
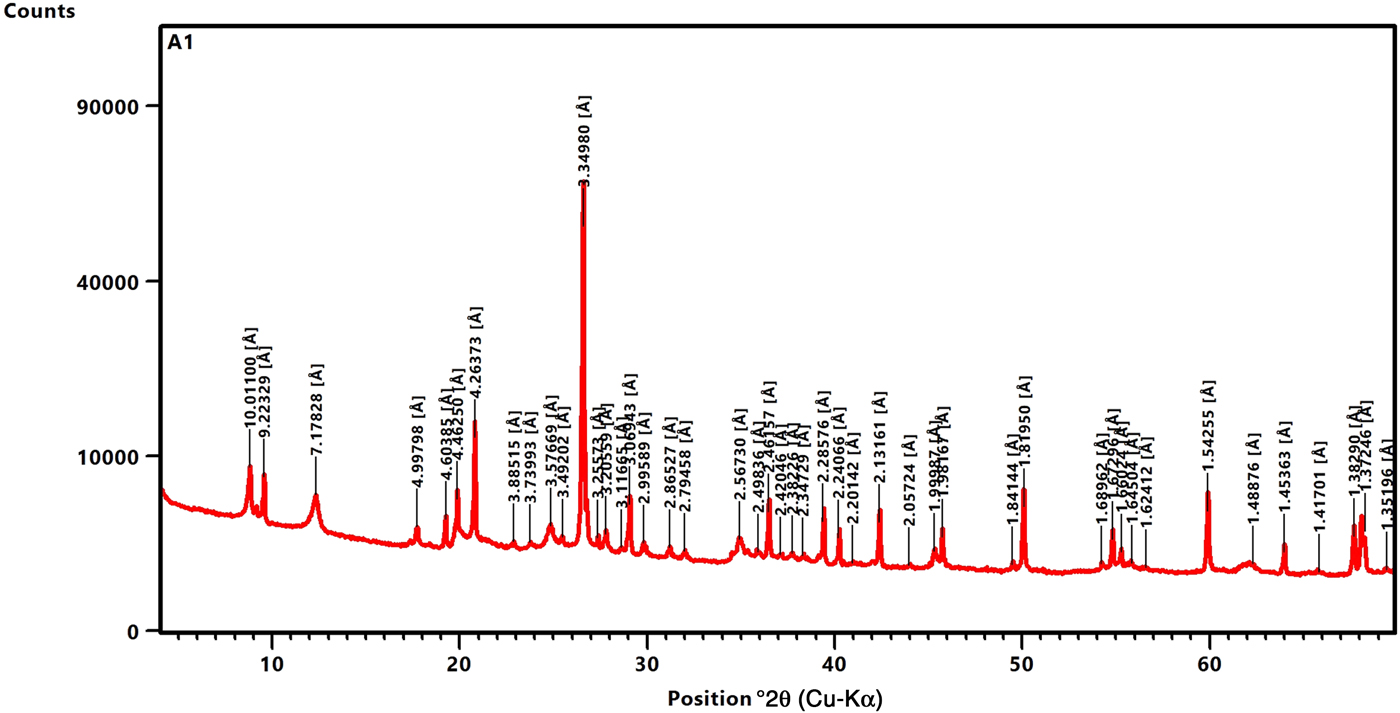
Fig. 2. XRD pattern of sample #A1.
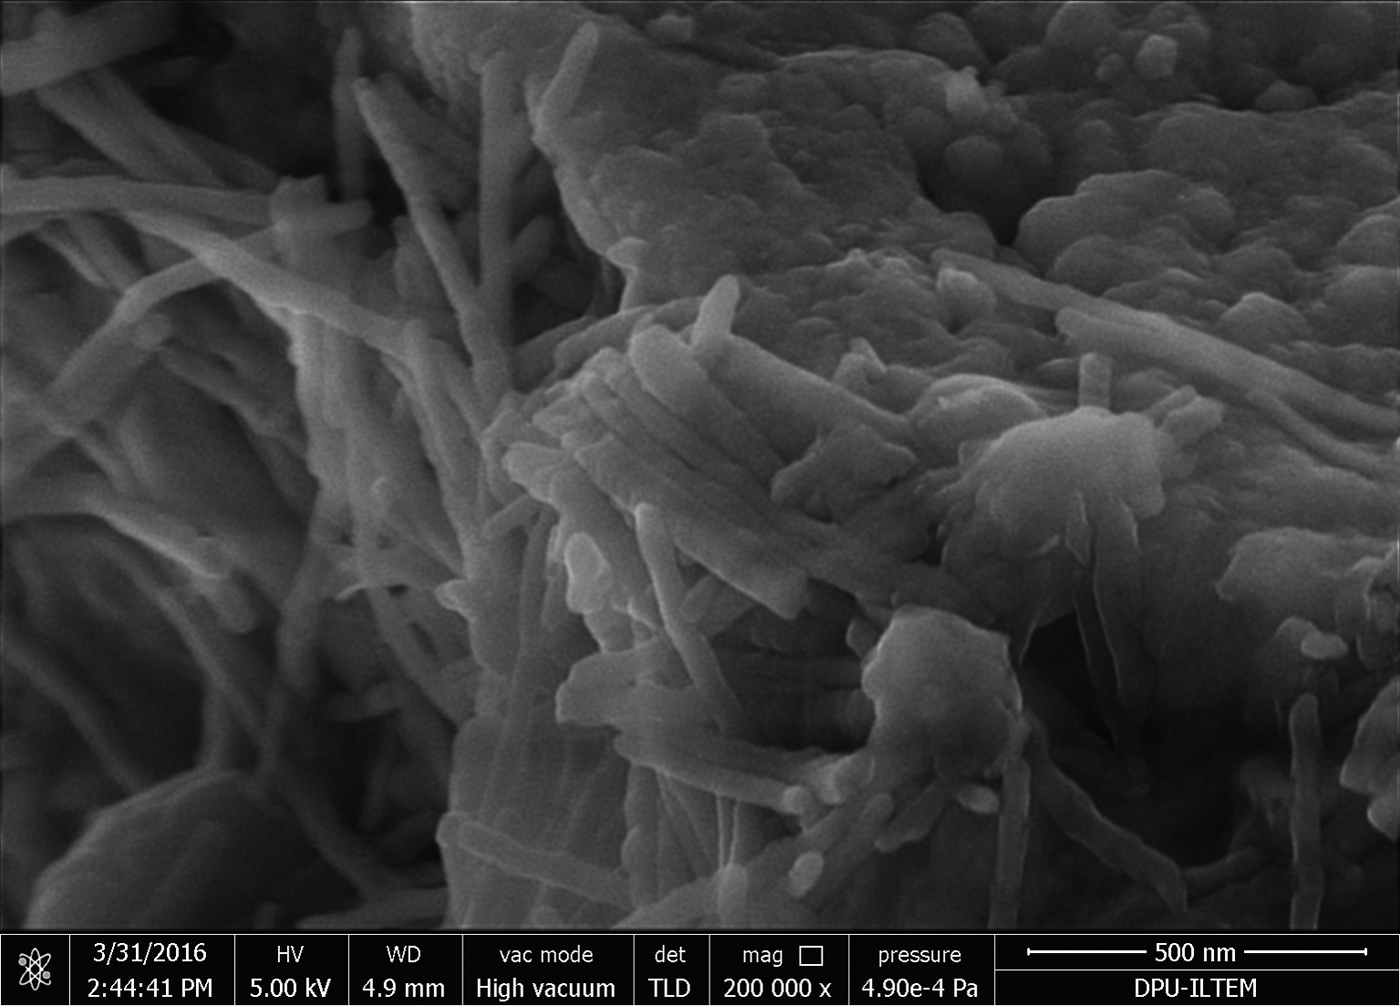
Fig. 3. SEM image of tubular halloysite in sample #A2 (diameter: ~30–70 nm, length: 300–400 nm).
Table 1. Quantitative mineral analyses (wt.%) of the clay samples
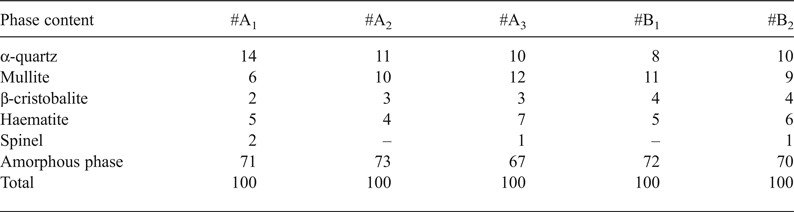
After firing at 1200°C, both α-quartz and β-cristobalite coexist together with well-developed mullite, relic quartz and an X-ray amorphous phase (Fig. 4). Only four major crystalline phases were identified after firing at 1200°C, namely mullite (6.0–12.0 wt.%), β-cristobalite (2.0–4.0 wt.%), α-quartz (8.0–14.0 wt.%) and haematite (4.0–7.0 wt.%), along with an X-ray amorphous phase (67.0–73.0 wt.%) (Table 4).

Fig. 4. Well-developed mullite crystals with quartz for sample #B2, after firing at 1200°C.
Mullite crystallizes from kaolinite and illite at high temperatures (Bohor, Reference Bohor1963). The formation of mullite in the investigated clays contributed to the mechanical strength of the fired bodies. Complete wetting of the crystalline phases and the lack of cracks due to the volume expansion of the crystalline and the glassy phase had a positive effect on strength development (Yanık et al., Reference Yanık, Esenli, Uz, Esenli, Uz and Külah2010). In addition to mullite, minor spinel (up to 2 wt.%) was detected in samples #A1, #A3 and #B2 fired at 1200°C (Table 4). The presence of spinel indicates either that minor chlorite was present in the samples #A1, #A3 and #B2 or that there was a considerable amount of Mg2+ or Fe2+ substituting for Al3+ in the octahedral sheet of illite.
Chemical characterization
The Chemical Index of Alteration (CIA; Nesbitt & Young, Reference Nesbitt and Young1982, Reference Nesbitt and Young1984) was recommended as a method of examining the intensity of chemical weathering in the sediment source area. A CIA value close to 100 indicates intense weathering. The index is calculated as follows:
 $$\eqalign{\hbox{CIA}\!:{\rm} \lpar {\lsqb {\hbox{A}\hbox{l}_2{\rm O}_3 / \lpar {\hbox{A}\hbox{l}_2\hbox{O}_3 + \hbox{CaO}{^\ast} + \hbox{N}\hbox{a}_2\hbox{O} + \hbox{K}_2\hbox{O}} \rpar } \rsqb } \rpar \times 100}$$
Molar proportions are used for the equation above, and CaO* represents Ca in silicate minerals as opposed to phosphate and carbonates. Generally, CIA values of 45–55 express lack of weathering, values of 56–60 indicate low chemical weathering, values of 61–80 indicate moderate chemical weathering and values of >80 represent strong chemical weathering conditions (Singh et al., Reference Singh, Sharma and Tobschall2005). The CIA values determined ranged between 83.79 (#B2) and 91.64 (#A3). The average CIA value for Gümüşköy clay samples (87.27) indicates strong chemical weathering (Table 2).
Table 2. Chemical composition (%), Chemical Index of Alteration (CIA) and Plagioclase Index of Alteration (PIA) values of the clay samples.

LOI = loss on ignition.
Moreover, the Plagioclase Index of Alteration (PIA) reflects intensive chemical weathering (Fedo et al., Reference Fedo, Nesbitt and Young1995). The index is calculated as follows:
 $$\eqalign{& {\rm PIA : }([{\rm A}{\rm l}_2{\rm O}_3-{\rm K}_2{\rm O}/({\rm A}{\rm l}_2{\rm O}_3 + {\rm CaO}^* + {\rm N}{\rm a}_2{\rm O} \cr & \,\,\,\,\,\,+ {\rm K}_2{\rm O])} \times 100} $$
The maximum value of PIA is 100 for completely altered materials, and weathered plagioclase has a PIA value of 50. The PIA values for the Gümüşköy clay samples range from 72.25 (#B2) to 87.29 (#A3) (average: 78.47), which suggest moderate–intense plagioclase weathering in the study area. Hence, the CIA and PIA values indicated that the plagioclase was almost entirely altered. These values are common along the kaolinization path of rhyolites in the study area.
Table 2 presents the chemical compositions of the main constituents of the five kaolin clays. The major element compositions of the five representative samples were characterized by large amounts of SiO2 and moderate amounts of Al2O3. Due to the abundant mineral impurities, mainly quartz, the SiO2 values of the clays reach up to 68.28%. The Al2O3 values were in the range 17.07–21.07%. These Al2O3 contents indicate moderate kaolinization of the parent rock.
The CaO and MgO content is relatively low in samples #A1, #A2 and #A3 (Table 2). The alkaline earth oxides Na2O and K2O are present mainly in plagioclase and illite, respectively. These oxides are active fluxes, contributing to the formation of the liquid phase. Sample #A3 has the lowest K2O content (1.03 wt.%), with the remaining samples containing 1.5–2.5 wt.% K2O. The Na2O and K2O contents are expected for this type of clay, indicating the possibility of firing these clays at relatively high temperatures to obtain products with low porosity. In all studied samples, the Na2O content varied from 0.39 wt.% (#B2) to 0.57 wt.% (#A3).
The abundance of Fe and Ti minerals varies considerably in the clay samples and these variations might affect the colour after firing (Ferrari & Gualtieri, Reference Ferrari and Gualtieri2006). The colouring oxides, mainly TiO2 and Fe2O3, are relatively abundant, especially in the #A3 and #B2 clays (Table 2). The total TiO2 + Fe2O3 content, which ranged from 3.98 to 9.91%, was mainly related to the biotite and goethite present.
LOI values varied from 6.28% to 8.40% and the sulfide content ranged from 0.19% to 0.28%. The presence of sulfide is related to organic matter in the samples (Yanık, Reference Yanık, Ceylantekin, Taşçı and Özçay2012).
Thermal behaviour of the clay samples (DTA)
The DTA-TG curves of the #B2 sample are given in Fig. 5. The weight loss between 0 and 200°C indicates the removal of adsorbed water from clay minerals, and the weight loss at 450–600°C is associated with the dehydroxylation of kaolinite and illite, causing structure collapse and higher reaction capability. A wide exothermic peak at 250–400°C is attributed to decomposition of the organic matter present in the clays. The endothermic peak at 292°C is linked to the decomposition of sulfates (i.e. Na2SO4 or MgSO4) and the dehydroxylation of goethite. The evolution of gases such as SOx from CaSO4 might cause efflorescence in a CaO-rich environment. However, SOx was not detected in the samples.
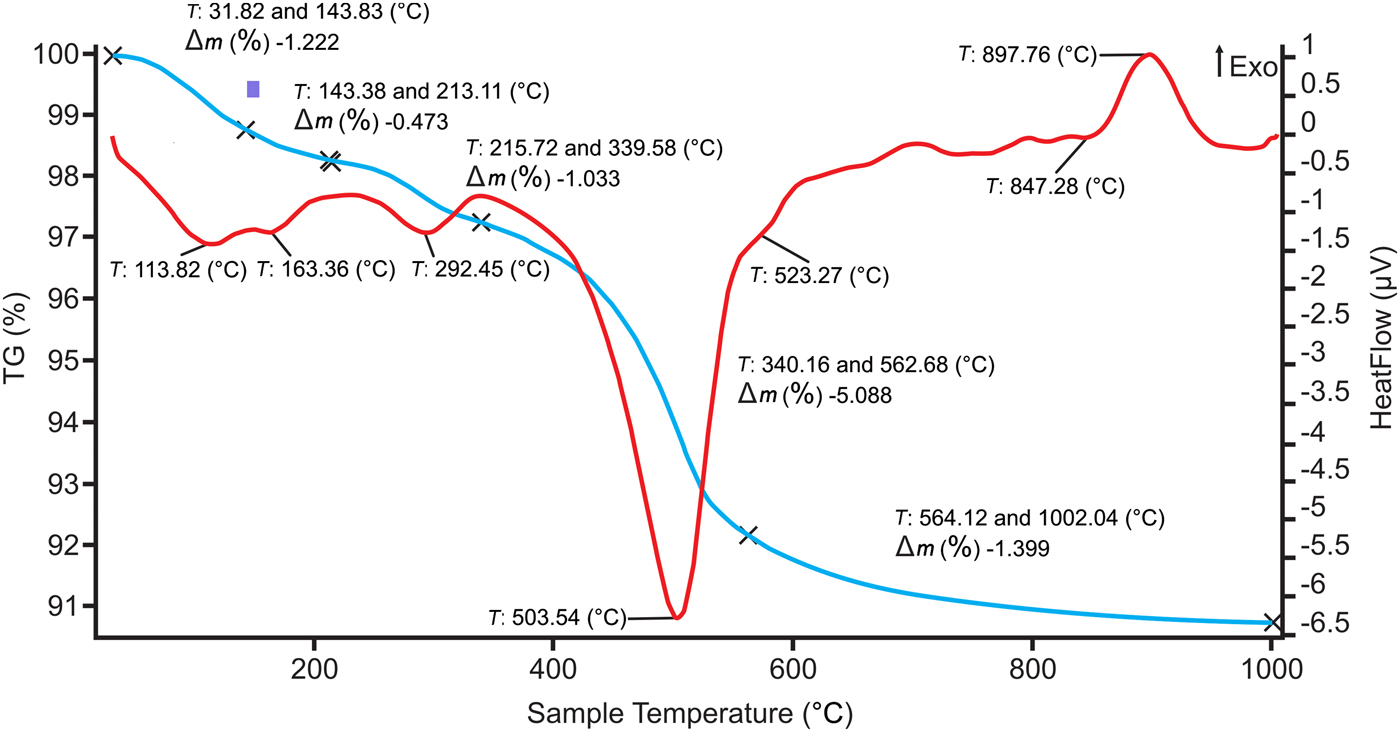
Fig. 5. DTA/TG curves of sample #B2.
Moreover, the two endothermic reactions above 500°C are associated with clay minerals; the endothermic peak at 503°C is intense in sample #A1 containing abundant quartz and is due to dehydroxylation of kaolinite. The second endothermic event at 527°C might be attributed to the dehydroxylation of pyrophyllite and/or illite. Due to the change in the stacking of the layers with different clay minerals or polytypes, the process of the removal of OH is different (Földvári, Reference Földvári2011).
The endothermic reaction at 573°C corresponds to the structural transition of trigonal α-quartz to hexagonal β-quartz (Fig. 5). As the inversion is reversible, it is possible to detect the quartz peak, even in the case of overlapping with other phases, because the overlapping events are generally the result of irreversible processes and they do not appear on the cooling curves or in the case of repeated heating.
The exothermic reaction at 897°C indicates the formation of Si–Al spinel with a mullite-like composition formation (primary mullite or pseudomullite). For the clays that lack alkaline oxides or alkaline earth oxides, the only phase to develop at 1000°C would be mullite.
Technological tests
The technological properties of clay raw materials depend mainly on the properties of the clay minerals present, the bulk mineralogical composition, the size distribution, the degree of consolidation and the processing conditions. Their assessment is always fundamental. Many properties of clay minerals are largely derived from their crystal structures and crystal chemistries (Konta, Reference Konta1995).
Particle-size analysis of the Gümüşköy kaolin clay deposit showed that the samples are dominated by the silt fraction (10–45 µm). The silt fraction ranged from 44.98% (#A1) to 52.09% (#A2). The clay fraction ranged from 5.61% (#A3) to 8.37% (#A1) (Table 3).
Table 3. Technical properties of the representative clay samples.
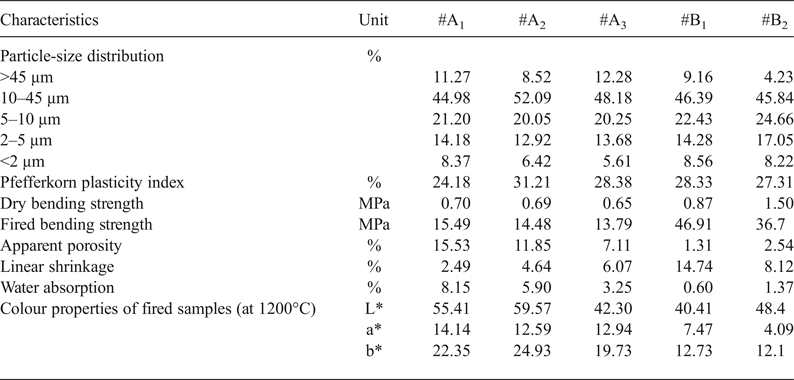
Table 4. Quantitative phase analyses (wt.%) of the representative clay samples.
Particle-size distribution is fundamental for characterizing the clay types for ceramic production (Göçmez et al., Reference Göçmez, Ceylantekin, Yanık, Işık and Ediz2004). Clay fraction is of technological importance because it is related to the plasticity of the clay body. It directly influences several properties such as shaping ability, drying shrinkage and porosity (Monteiro & Vieira, Reference Monteiro and Vieira2002). The plasticity of a clay mixture is the likely means through which the clay mineralogy controls the porosity of clay compacted under similar conditions.
The samples display variable Pfefferkorn plasticity, ranging from 24.18% (#A1) to 31.21% (#A2) (Table 3). According to their plasticity properties, the samples might be used in ceramic products and shaped through the extrusion method.
The technological properties of the Gümüşköy clay samples display variation. Dry bending-strength values varied between 0.7 and 1.5 MPa and the fired bending strength of the samples at 1200°C ranged from 13.79 to 46.91 MPa. The variation in the firing properties is due to the mineralogical rather than the chemical composition. For example, fired bending strength values were maximum in #B1, whereas #A2, with the highest kaolinite content, had low values. This approach reveals that increasing illite composition reflects an increase in flexural strength (Özdamar et al., Reference Özdamar, Ece, Kayacı and Küçüker2007).
Water absorption, apparent porosity and linear shrinkage values are listed in Table 3. The water absorption value is lowest in #B1 and #B2 and highest in #A1 (8.15%). The water absorption varies only slightly in relation to the firing temperature. Above 1150°C, open pores begin to close, reducing water absorption (Ece & Nakagawa, Reference Ece and Nakagawa2002). In addition, the increase in density is attributed to the elimination of pores during sintering (Dondi et al., Reference Dondi, Guarini, Ligas, Palomba and Raimondo2001). High density and modifications in the microstructure increased the strength of the ceramic materials and reduced water absorption and porosity.
Illite yields a higher percentage of the glass phase and lower water absorption because of its lower melting point. Linear shrinkage decreases with illite content because of pyroplastic deformation. The presence of illite slows down the formation of mullite and cristobalite, because silica and alumina tend to form alkaline glass (Ferrari & Gualtieri, Reference Ferrari and Gualtieri2006).
Pyrophyllite was determined in varying proportions (2.5–5.7 wt.%) in most clay samples (#A1, #A2, #B1 and #B2). Pyrophyllite has excellent thermal stability; therefore, it is added to clay to reduce thermal expansion during firing. However, it has many other industrial uses when combined with other compounds, such as in insecticides and brick production (Kumar & Rajkumar, Reference Kumar and Rajkumar2014).
The iron oxide (Fe2O3) content in Gümüşköy kaolin clay samples was rather high (3.20–8.07%), which reduced the whiteness of the samples fired at 1200°C. The colour parameters (L*, a* and b* parameters) of the fired samples from the Gümüşköy area are listed in Table 3. Lightness (L*) values of the fired samples ranged from 40.41 to 59.57, redness (a*) values ranged from 7.47 to 14.14 and yellowness (b*) values ranged from 12.10 to 24.93. These values indicate that the colour of the samples was dark brown.
Iron is generally present in clay minerals that yield mullite during firing. The brownish colour is attributed to iron oxides eventually formed at the expense of Fe oxyhydroxides (e.g. goethite, α-FeO[OH]), following the reaction 2FeOOH → Fe2O3 + H2O (Ferrari & Gualtieri, Reference Ferrari and Gualtieri2006). The presence of iron/ferrous minerals and the resulting strong colouration render these materials unsuitable for the paper industry and for applications where whiteness is required. However, they may be used in other applications (Sei, Reference Sei, Morato, Kraa, Staunton, Quiquampoix, Jumas and Olivier-Fourcade2006).
The results of the technological tests and the particle size and plasticity analysis coupled with literature data (Konta, Reference Konta1995; Strazzera et al., Reference Strazzera, Dondi and Marsigli1997; Dondi, Reference Dondi1999, Reference Dondi, Domínguez, Mas and Cravero2003; Carretero et al., Reference Carretero, Dondi, Fabbri and Raimondo2002; Ferrari & Gualtieri, Reference Ferrari and Gualtieri2006; Yanık et al., Reference Yanık, Esenli, Uz, Esenli, Uz and Külah2010, Reference Yanık, Ceylantekin, Taşçı and Özçay2012; Dondi et al., Reference Dondi, Mariarosa and Zanelli2014, Bennour et al., Reference Bennour, Mahmoudi, Srasra, Hatira, Boussen, Ouaja and Zargouni2015; Mahmoudi et al., Reference Mahmoudi, Bennour, Srasra and Zargouni2017) suggest the use of the studied clays for the production of wall tiles, floor tiles and kiln wares, such as bricks, ceiling bricks, roofing bricks, roofing tiles and drain pipes that are shaped by dry pressing and extrusion.
SUMMARY AND CONCLUSION
The Gümüşköy (Kütahya, Turkey) kaolin clays occur in rhyolitic and silicified rhyodacitic tuffs/tuffaceous rocks (Tavşanlı volcanites). According to the CIA and PIA, the clay levels were formed by strong chemical alteration of the Tavşanlı volcanites. The average CIA and PIA values for the clay samples were 85.87 and 77.25, respectively.
The kaolinitic clay samples consist of kaolinite, illite, pyrophyllite, montmorillonite, halloysite, quartz, plagioclase, muscovite, sanidine, rutile and goethite. The Fe oxide content ranged from 3.20 to 8.07 wt.%.
According to the mineralogical, chemical, thermal behaviour and technological test results and the comparison with the previous literature, the Gümüşköy clays might be used for the production of ceramic bodies by dry pressing and extrusion. As this material does not possess appropriate casting properties, it is not suitable for ceramic production, in which forming is mainly done by casting. The clays studied showed similar properties to clays that are currently used in the ceramics industry.
The sintering interval of K-feldspar in the clays is shorter than that of Na-feldspar, so it is suggested that they be used in the production of fast-fired ceramics. The clay samples might be used as sintering agents in wall- and floor-tile production.


