INTRODUCTION
The East Asian summer monsoon (EASM) is a major component of the global atmospheric circulation system with significant effects on Earth's energy and hydrological cycles (Dykoski et al., Reference Dykoski, Edwards, Cheng, Yuan, Cai, Zhang, Lin, Qing, An and Revenaugh2005; Peng et al., Reference Peng, Xiao, Nakamura, Liu and Inouchi2005; Wang et al., Reference Wang, Cheng, Edwards, Kong, Shao, Chen, Wu, Jiang, Wang and An2008). The monsoon climate is critically important for human societies and controls the distribution and dynamics of vegetation in monsoonal Asia (Webster, Reference Webster2006; Zhou et al., Reference Zhou, Song, Burr, Jull, Lu, Yu and Cheng2007; Cai et al., Reference Cai, Tan, Cheng, An, Edwards, Kelly, Kong and Wang2010). Exploring past monsoon system variability, particularly during the Holocene, is a prerequisite not only for a detailed understanding of global climate processes but also for improving climate prediction (Ran and Feng, Reference Ran and Feng2013; Yu, Reference Yu2013; Caley et al., Reference Caley, Roche and Renssen2014; Stebich et al., Reference Stebich, Rehfeld, Schlütz, Tarasov, Liu and Mingram2015).
In recent decades, significant advances in our understanding of Holocene monsoon evolution have been made based on numerous studies of lake sediments, cave deposits, peat deposits and aeolian sequences (Wang et al., Reference Wang, Cheng, Edwards, He, Kong, An, Wu, Kelly, Dykoski and Li2005, Reference Wang, Cheng, Edwards, Kong, Shao, Chen, Wu, Jiang, Wang and An2008; Hong et al., Reference Hong, Hong, Lin, Shibata, Hirota, Zhu, Leng, Wang, Wang and Yi2005; Dallmeyer et al., Reference Dallmeyer, Claussen, Wang and Herzschuh2013; Jin et al., Reference Jin, Schneider, Park, Latif, Khon and Zhang2014; Xia et al., Reference Xia, Jia, Li, Zhao, Wei and Chen2014), but quantitative evaluations are limited. Thus, to better understand the trends and amplitude of Holocene monsoon rainfall variations, more specific proxies and high-resolution quantitative reconstructions are needed.
Most areas of northeastern China are dominated by the East Asian monsoon (EAM). In recent years, with the increasing number of geological records and model simulations, a dispute has arisen regarding Holocene precipitation trends, especially about the timing of the Holocene summer monsoon maximum (HSMM) in the region. Broadly, two different patterns are evident. Pollen-based records from Bayanchagan Lake (Jiang et al., Reference Jiang, Guo, Sun, Wu, Chu, Yuan, Hatté and Guiot2006, Reference Jiang, Guiot, Chu, Wu, Yuan, Hatté and Guo2010) and Qigai Nurr Lake (Sun and Feng, Reference Sun and Feng2013) show an early- to mid-Holocene EASM rainfall maximum from 10,000–6500 cal yr BP and from 9200–4000 cal yr BP, respectively. A quantitative lake-level record from Dali Lake in northeastern China also shows the same pattern (Goldsmith et al., Reference Goldsmith, Broecker, Xu, Polissar, deMenocal, Porat, Lan, Cheng, Zhou and An2017). These records are all consistent with high-resolution and well-dated stalagmite δ18O records from central-southern China, which broadly follow Northern Hemisphere summer insolation (Wang et al., Reference Wang, Cheng, Edwards, He, Kong, An, Wu, Kelly, Dykoski and Li2005; Chen et al., Reference Chen, Rao, Liu, Huang, Feng, Dong, Hu, Xu and Chen2016). However, other quantitative rainfall records from northeastern China exhibit a mid- to late-Holocene EASM maximum. The reconstructed mean annual precipitation (Pann) records from the sediments of both Daihai Lake (Xu et al., Reference Xu, Xiao, Li, Tian and Nakagawa2010) and Dali Lake (Xiao et al., Reference Xiao, Fan, Zhai, Wen and Qin2015) indicate that the HSMM did not occur before 8000 cal yr BP; however, reconstructed precipitation at Sihailongwan Lake increased continuously until approximately 4000 cal yr BP (Stebich et al., Reference Stebich, Rehfeld, Schlütz, Tarasov, Liu and Mingram2015). Such striking discrepancies, together with the paucity of high-resolution reconstructions for the region, hinder our understanding of the timing and forcing mechanisms of the HSMM. Thus, new quantitative records from northeastern China are essential.
Here we present fossil pollen spectra and pollen-based quantitative reconstructions of temperature and precipitation for the past 10,300 years derived from the sediments of Tianchi Crater Lake in northeastern China. We then compare our results with other paleoclimate records to assess the timing of the HSMM in the region and to gain improved insights into the possible forcing mechanisms.
MATERIALS AND METHODS
Regional setting and sampling
Nangelaqiu Hill (126°E, 48°44′N) is a 149.9-m-high volcano with an elevation of 596.9 m located in the Wudalianchi Global Geopark, Heilongjiang Province, China. The volcano erupted at ~0.8 Ma (Gong, Reference Gong1997) and ~0.46 Ma (Liu, Reference Liu1987). Tianchi Crater Lake (Fig. 1), at the summit of Nangelaqiu Hill, is a typical crater lake with a diameter of ~250 m. The lake was used for irrigation in the 1970s and consequently today is swampy, with abundant growth of aquatic plants. The modern vegetation around Tianchi Crater Lake is categorized as temperate mixed conifer-broad-leaved forest dominated by Betula platyphylla, Populus davidiana, Larix gmelinii, Corylus and Quercus mongolica; typical herbs include Artemisia annua and Chenopodiaceae (Shen et al., Reference Shen, Wang and Dong2011; Zhao, Reference Zhao2015).
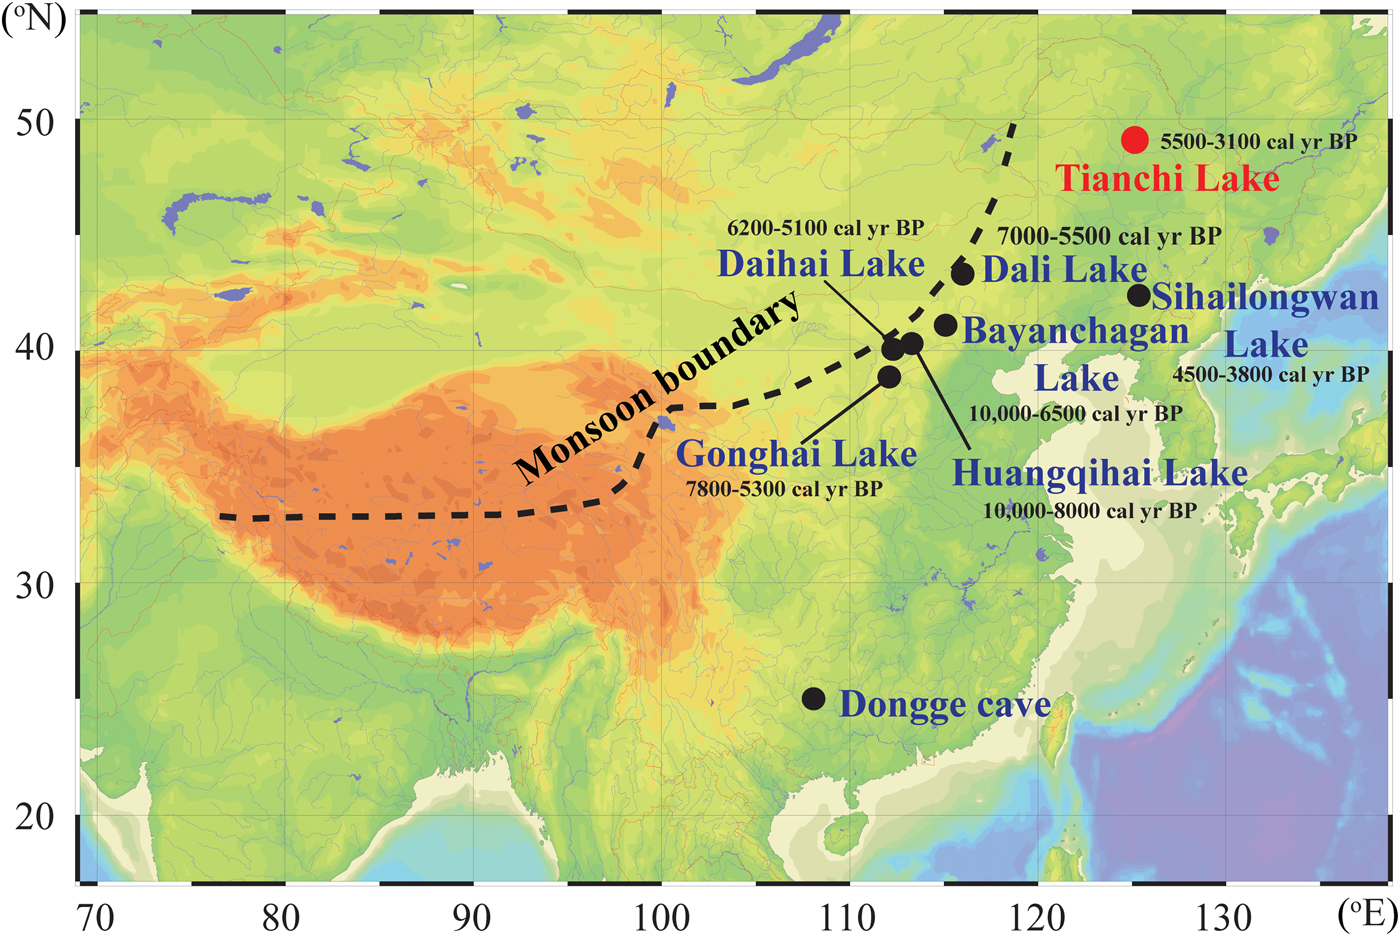
Figure 1. Location of Tianchi Crater Lake (The base map was produced using Ocean Data View software). The black dashed line indicates the modern monsoon boundary (Chen et al., Reference Chen, Huang, Jin, Chen, Chen and Chen2018; An et al., Reference An, Porter, Kutzbach, Wu, Wang, Liu, Li and Zhou2000). The red dot shows the study site and the black dots are sites mentioned in the text. (For interpretation of the references to color in this figure legend, the reader is referred to the web version of this article.)
The area experiences a typical cold temperate monsoon climatic regime with long cold winters and short cool summers. The annual average air temperature is 0–0.5 °C and the average precipitation is ~470 mm, falling mainly during June to August; the mean annual evaporation of the region is ~1260 mm. The ratio of the catchment area to lake area is about 2.8. There are no inflows or outflows and therefore the sediments of Tianchi Crater Lake are well suited for studying the evolution of the EAM.
Two sediment cores, TC1 and TC2, were collected from Tianchi Crater Lake in October 2011 and November 2012, respectively, using a 55-mm-diameter percussion corer. Core TC1 was 309 cm in length, compressed to 197 cm in length. Core TC2 was 500-cm long and only the upper 306 cm was used in this study.
Dating method, n-alkane analysis and pollen analysis
Sixteen accelerator mass spectrometry (AMS) 14C dates of bulk sedimentary organic matter, leaves, and seeds from core TC1 were obtained at the University of Georgia and the University of Ottawa (Table 1). The results were calibrated to calendar ages using the IntCal13 calibration curve (Reimer et al., Reference Reimer, Bard, Bayliss, Beck, Blackwell, Ramsey and Buck2013). The organic content of 764 samples was measured by weight loss-on-ignition (LOI). Samples from core TC1 were measured at approximately 0.5-cm intervals, and those from core TC2 were measured at 0.5-cm and 1-cm intervals above and below 103 cm, respectively. The samples were homogenized using a mortar and pestle and passed through a 120-μm sieve. Samples weighing 0.5–1.0 g were heated to 105°C for 12 h to constant weight and then combusted at 550°C for approximately 2 h to constant weight, from which LOI550°C was calculated. The analytical error is <1%.
Table 1. Radiocarbon dates for core TC1.

a Measured at the University of Ottawa; all other dates were measured at the University of Georgia.
b Not provided by the laboratory.
Thirty-seven sediment samples were freeze-dried and finely ground with an agate mortar for n-alkane analysis. Approximately 2 g of each sample were extracted with dichloromethane for three cycles of 10 minutes each, using an Accelerated Solvent Extractor (Dionex ASE 350). The extracted total lipids were further separated through silica gel chromatography. The n-alkane fraction, eluted with 4 ml n-hexane, was analyzed on an Agilent 7890 Gas Chromatography (GC), equipped with a flame ionization detector, at the University of Hong Kong. The n-alkanes were identified and quantified by comparing with the retention time of known n-alkane standards and the external standard of C36 n-alkane, respectively (Liu et al., Reference Liu, Zhang, Sun, Liu, Liu and Quan2014). More details of sample preparation and lipid analysis can be found in Sun et al. (Reference Sun, Zhang, Liu, He, Song, Liu and Liu2012). The n-alkane-based proxy Paq was used to assess the inputs of submerged/floating macrophytes relative to those from emergent aquatic and terrestrial plants. Calculation of Paq was based on the relative proportion of mid-chain (C23, C25) to long-chain (C29, C31) n-alkane homologues (Paq = (C23 + C25)/(C23 + C25 + C29 + C31) (Ficken et al., Reference Ficken, Li, Swain and Eglinton2000).
A total of 48 pollen samples from core TC2 were obtained at 5-cm intervals. The samples were processed using heavy liquid separation (Moore and Webb, Reference Moore and Webb1978) and acetolysis (Erdtman, Reference Erdtman1960). Lycopodium tablets were added to the samples to calculate pollen concentrations (Peck, Reference Peck1974). At least 300 pollen grains were counted for each sample.
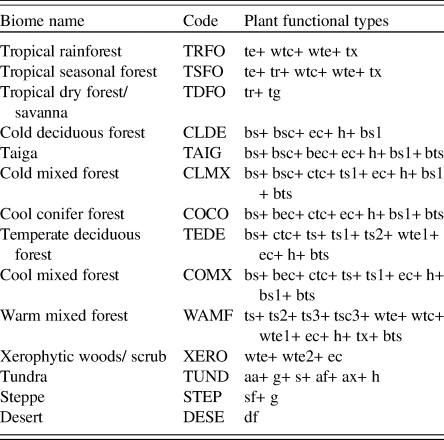
The plant functional type-modern analogue technique (PFT-MAT) (Peyron et al., Reference Peyron, Guiot, Cheddadi, Tarasov, Reille, de Beaulieu, Bottema and Andrieu1998) was applied to the fossil pollen data to quantitatively reconstruct annual precipitation and temperature. This method produces the best results among other quantitative methods applied in northern China, including the MAT, pollen response surface (PRS), and transfer function (TF) approaches (Jiang et al., Reference Jiang, Guo, Sun, Wu, Chu, Yuan, Hatté and Guiot2006; Sun and Feng, Reference Sun and Feng2013;). In the procedure, fossil pollen data were assigned to PFTs and then compared with PFTs derived from modern pollen data (Table 2), with the climatic parameters of the best modern analogues used to provide climate values for the fossil pollen spectra via an artificial neural network technique (Peyron et al., Reference Peyron, Guiot, Cheddadi, Tarasov, Reille, de Beaulieu, Bottema and Andrieu1998). For biome reconstruction, the PFTs were classified into vegetation biomes based on the known ecology and biogeography of modern plants (Table 3) (Prentice et al., Reference Prentice, Guiot, Huntley, Jolly and Cheddadi1996). In this study, both the quantitative reconstruction and biome reconstruction were accomplished based on a modern pollen dataset featuring 211 surface pollen spectra from north China (Tables 2 and 3) (Members of China Quaternary Pollen Data Base, 2000, 2001).
Table 2. Plant functional types and the corresponding assigned major pollen taxa (Members of China Quaternary Pollen Data Base, 2001)

RESULTS AND DISCUSSION
Chronology and lithology
The 16 AMS 14C dates from core TC1 are in stratigraphic order, with the exception of the bottom of the core, where two samples from 197 cm have different ages: 12,600 cal yr BP for leaves and 13,700 cal yr BP for bulk sediment (Table 1, Fig. 2). The date for the leaves is out of stratigraphic order, and it is possible that this is the result of downward movement of material during coring. Thus, the bulk sediment sample was used in the age-depth model. The chronology of core TC2 was obtained by correlating its LOI550°C record with that of TC1 (Fig. 3). For core TC2, the calculated sedimentation rates for the depth intervals 0–145.5 cm, 145.5–239 cm, and 239–cm to the base are 0.02 cm yr−1, 0.03 cm yr−1 and 0.01 cm yr−1, respectively.
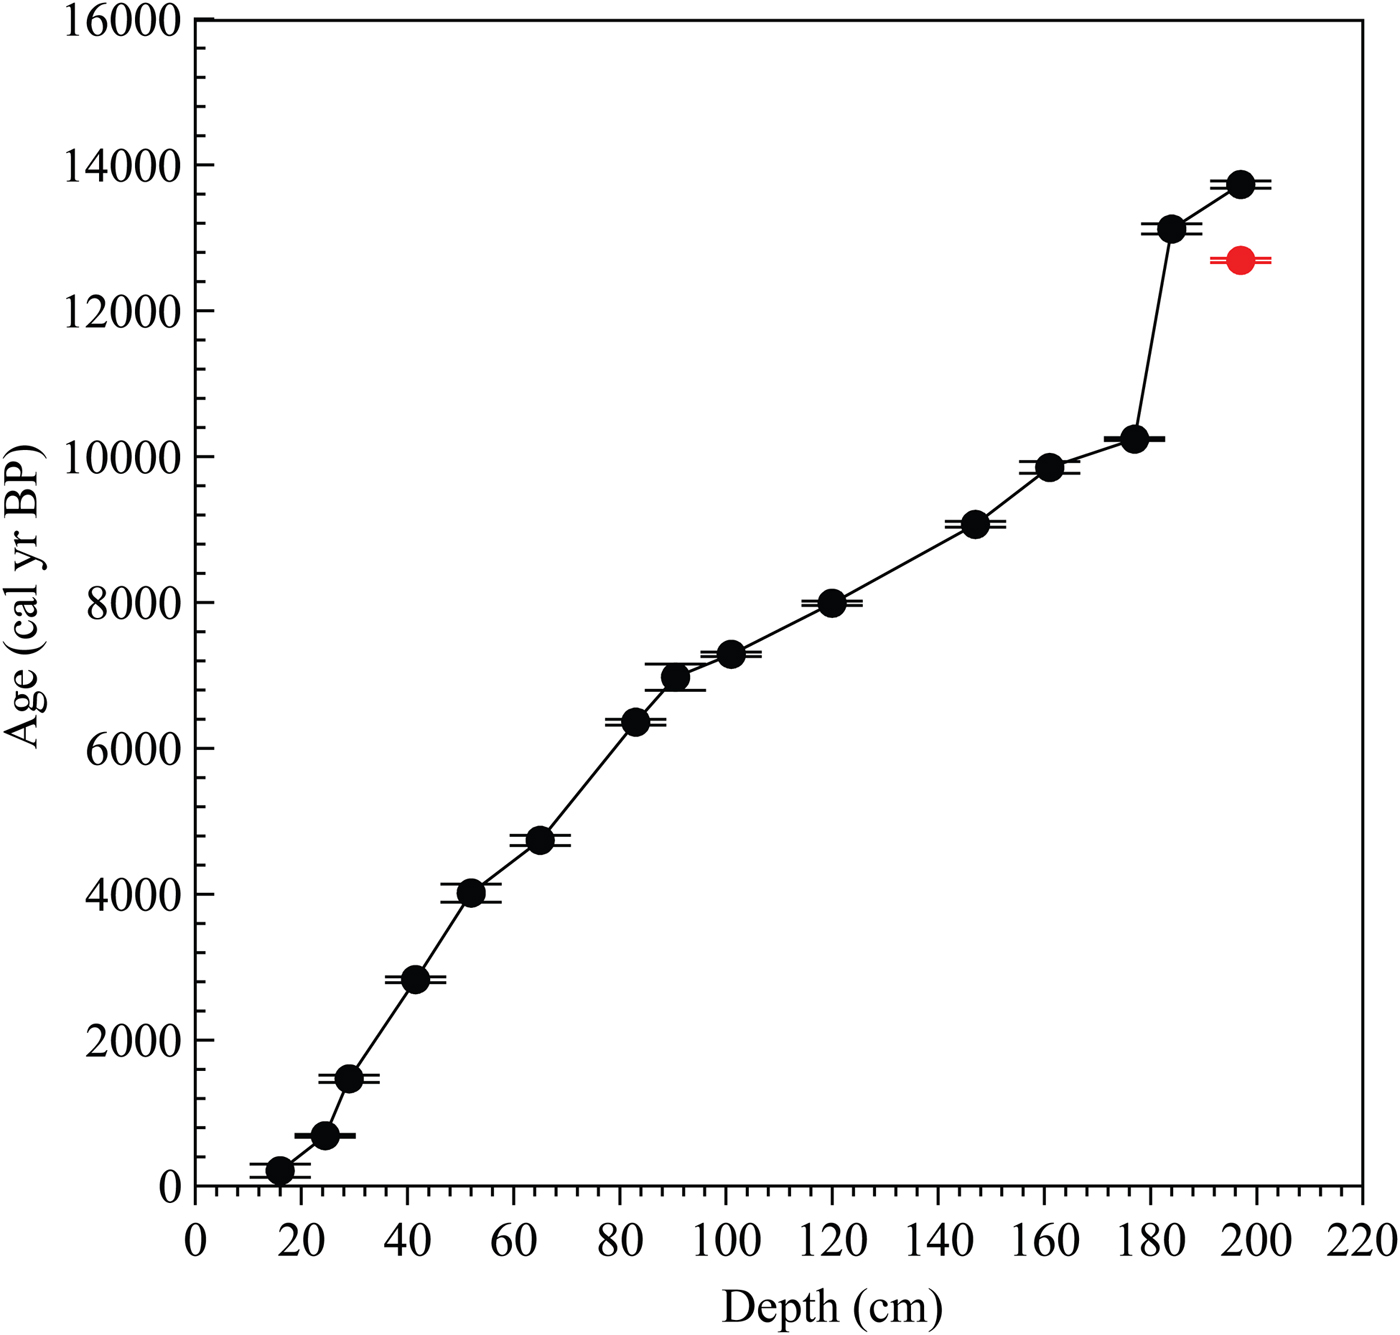
Figure 2. Age-depth relationship for core TC1. The red dot represents a date that was excluded in the construction of an age-depth model. (For interpretation of the references to color in this figure legend, the reader is referred to the web version of this article.)

Figure 3. (color online) Lithology and correlation of the LOI550°C records of cores TC1 and TC2 (Paq values: unpublished data. The values of Paq are generally higher than 0.4, suggesting typical lake condition).
The upper 125 cm of core TC1 is greyish yellow in color with substantial organic residues; the interval below 125 cm is black, and that below 187 cm contains numerous red particles of volcanic material that are <2 mm in diameter (Fig. 3). The lithology of core TC2 is similar to that of core TC1. Although the LOI550°C values of the sediments are high, reaching ~80% at 50–70 cm in core TC1 (Fig. 3), the sediments are classified as lake sediments based on the Paq record. Paq values in sediments of core TC1 are generally higher than 0.4 (Fig. 3), suggesting important inputs from submerged/floating plants to the sedimentary organic matter (Ficken et al., Reference Ficken, Li, Swain and Eglinton2000; Xu and Jaffé, Reference Xu and Jaffé2009).
Pollen evidence for changes in vegetation and climate
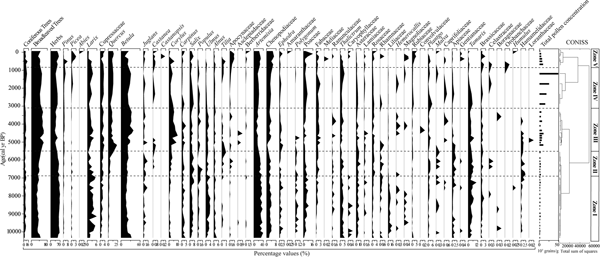
The pollen assemblage of the surface sediment layer is characterized by high percentages of Betula, Larix, Corylus, and Quercus, reflecting the temperate mixed conifer-broad-leaved forest present in the study area today (Fig. 4). Five pollen assemblage zones were defined by stratigraphically constrained cluster analysis (CONISS) (Grimm, Reference Grimm1987) of the major pollen taxa (Fig. 4).

Figure 4. Pollen percentage diagram for Tianchi Crater Lake.
Zone I (10,300–6900 cal yr BP): This zone is characterized by high percentages of herb pollen (51%–69%, average of 62%, the same below, with the parenthetical percentages referring to a range and an average for Zone I and Zone III), most of which is Artemisia (24%–40%, 31%), Liliaceae (0%–14%, 5.2%), Poaceae (1%–9%, 4.5%), Tamarix (2%–11%, 4.4%), Asteraceae (2%–7%, 4.0%), Chenopodiaceae (2%–5%, 3.1%) and Thalictrum (1%–5%, 2.8%). The individual percentages of Ephedra, Brassicaceae, Apiaceae, Plantago, Rosaceae, and other herbs are <1% on average. The total percentages of broad-leaved trees (mainly Betula, Ulmus, Salix and Carpinus) are ~25%–46% (Fig. 4), and thus sparse forest steppe-vegetation type is indicated in this zone (Table 4). During this period, herbs were dominant and the pollen percentages of typical drought-tolerant herbs (Artemisia and Chenopodiaceae) are well represented, indicating a relatively dry climate (Fig. 4); in addition, the relatively high pollen percentages of thermophilic plants (e.g., Ulmus japonica) suggest a relatively warm climate. The higher desert (DESE) and steppe (STEP) biome scores and lower cool conifer forest (COCO) and taiga (TAIG) biome scores (Fig. 5) also confirm the occurrence of a warm and dry climate.
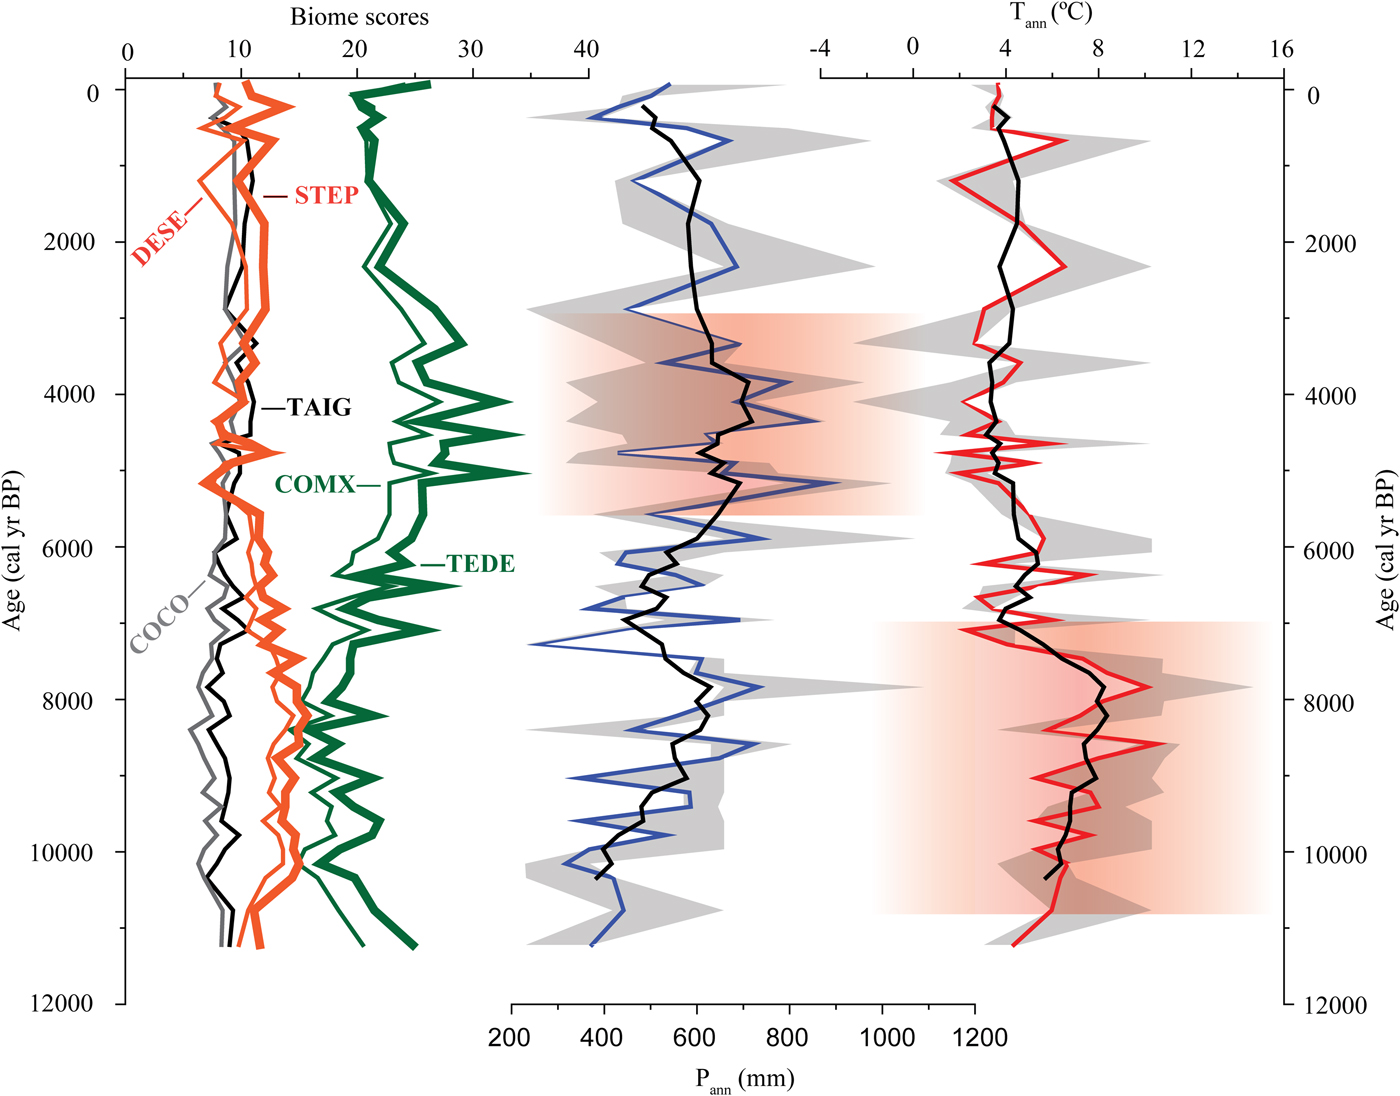
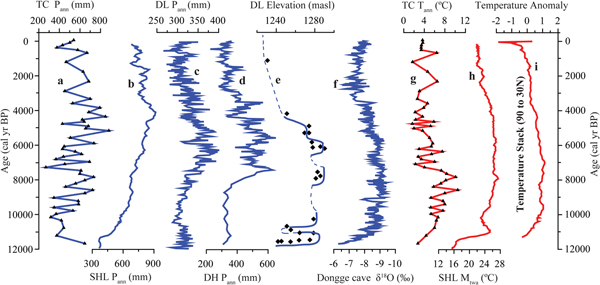
Figure 5. (color online) PFT-MAT-based reconstructed annual precipitation (Pann), annual temperature (Tann) and biome scores for Tianchi Crater Lake. The black smoothed curves are five point running averages; the grey shaded bands indicate the level of uncertainty; and the pink shading indicate Holocene temperature and precipitation maxima.
Table 4. Summary of the vegetation history of Tianchi Crater Lake.

Zone II (6900–5500 cal yr BP): The pollen percentages of herbaceous taxa (Artemisia, Poaceae, and Ephedra) decreased considerably in this zone, whereas those of broad-leaved trees (Quercus, Betula, Salix, and Corylus) increased steadily; in addition, the pollen percentages of Ulmus decreased slightly (Fig. 4). These characteristics, in accord with the decreasing DESE and STEP biome scores and the increasing COCO and TAIG biome scores (Fig. 5), indicate that the vegetation type was typical forest steppe (Table 4) and that the climate had become cooler and wetter.
Zone III (5500–3100 cal yr BP): This zone is characterized by high tree pollen percentages (50%–70%, 62%), most of which are broad-leaved trees (42%–62%, 56%), including Betula (21%–39%, 29%), Quercus (7%–23%, 12%), and Corylus (2%–9%, 6%). The pollen percentages of broad-leaved trees pollen reached a maximum in the zone (Fig. 4). We infer that Tianchi Crater Lake area was occupied by Quercus- and Betula-dominated deciduous broad-leaved forest vegetation during this period (Table 4). During the mid- Holocene (5500–3100 cal yr BP), the pollen percentages of broad-leaved trees, especially Quercus, Betula, and Corylus, increased substantially and reached a maximum, while pollen percentages of the drought-tolerant herbs (e.g., Artemisia and Chenopodiaceae) decreased. A previous study showed that Quercus mongolica was an important component of the forest in northeastern China during the Holocene (Ren and Zhang, Reference Ren and Zhang1998). At present, Quercus mongolica forest is generally distributed in regions of northeastern China with an annual average temperature of 3–6°C and annual average precipitation of 600–757 mm (Xia, Reference Xia1988). Therefore, we infer that this interval corresponds to the Holocene rainfall maximum, with the highest Holocene lake level.
Zone IV (3100–800 cal yr BP): The pollen percentages of trees and broad-leaved trees decreased to average values of 54% and 47%, respectively, and reached their minima at ~2300 cal yr BP, which are lower than in both Zone III and Zone II. Forest steppe with increasing canopy density is suggested by the high percentage of broad-leaved tree pollen (Table 4). In this zone, the decreasing pollen percentages of broad-leaved trees (e.g., Corylus and Carpinus) and the increasing herb-pollen percentages, including Artemisia, Chenopodiaceae, and Tamarix (Fig. 4), suggest the occurrence of a relatively dry climate, which is confirmed by the decreasing temperate deciduous forest (TEDE) and cool mixed forest (COMX) biome scores (Fig. 5).
Zone V (800 cal yr BP to present): Herb-pollen percentages show a sustained increase to an average of 52%, reaching a peak of ~60% at 230 cal yr BP. In particular, Poaceae percentages increase substantially after ~300 cal yr BP. After ~800 cal yr BP, tree pollen percentages decreased substantially, but those of some cold-resistant taxa, such as Picea, increased at ~400–200 cal yr BP, indicating a cold climate, which is temporally correlated with the Little Ice Age (Mann et al., Reference Mann, Zhang, Hughes, Bradley, Miller, Rutherford and Ni2008). During this period, typical sparse forest steppe was dominant in the Tianchi Crater Lake area (Table 4). Notably, the abrupt increase in Poaceae after ~300 cal yr BP may indicate intensive human activity (Tarasov et al., Reference Tarasov, Jin and Wagner2006; Zhao et al., Reference Zhao, Yu, Chen, Zhang and Yang2009), which is confirmed by the onset of widespread dune remobilization in the deserts of northeastern China (Guo et al., Reference Guo, Xiong, Ding, Jin, Wu and Ye2018). Furthermore, archaeological sites dating to the late Holocene are uncommon in this region (Li, Reference Li2016), suggesting that human disturbance was low for most of the Holocene but was higher after ~300 cal yr BP.
Quantitative climate reconstructions
The PFT-MAT-based reconstructed Pann record for Tianchi Crater Lake has a similar trend of variation to that of the pollen percentage diagram (Fig. 5). The ranges of Pann and Tann are 268–881 mm and 1.7–10.5°C, respectively. Pann increased gradually during the early Holocene and then increased abruptly at ~6500 cal yr BP, with the most humid phase from ~5500–~3100 cal yr BP. In accord with the interpretation of the changes in the pollen spectra, the Pann record clearly indicates that the wettest climate occurred during the mid- to late Holocene (Fig. 5) when annual precipitation exceeded 600 mm. However, variations in Tann exhibit a different pattern with a marked rise from the beginning of the early Holocene and a peak at 9000–8000 cal yr BP.
The trend of the PFT-MAT-based reconstruction of Tann for Tianchi Crater Lake is consistent with that of other temperature records from northeastern China and with a temperature anomaly record for high latitudes of the Northern Hemisphere (Fig. 6). This suggests the similar forcing of Holocene temperature changes, probably due to changes in Northern Hemisphere summer insolation (Laskar et al., Reference Laskar, Robutel, Joutel, Gastineau, Correia and Levrard2004; Wen et al., Reference Wen, Xiao, Chang, Zhai, Xu, Li and Itoh2010). The above-mentioned decoupling of precipitation and temperature has been observed in other paleoclimatic studies (Peterse et al., Reference Peterse, Prins, Beets, Troelstra, Zheng, Gu, Schouten and Sinninghe Damsté2011; Nie et al., Reference Nie, Song, King, Zhang and Fang2013) and was attributed to various mechanisms, including latent heat export from the Southern Hemisphere Indian Ocean (Clemens and Prell, Reference Clemens and Prell2007), glacial boundary conditions (Liu et al., Reference Liu, Liu, Kutzbach, Clemens and Prell2006), and cold temperature anomalies reconstructed from North Atlantic sediments (Cheng et al., Reference Cheng, Edwards, Broecker, Denton, Kong, Wang, Zhang and Wang2009).
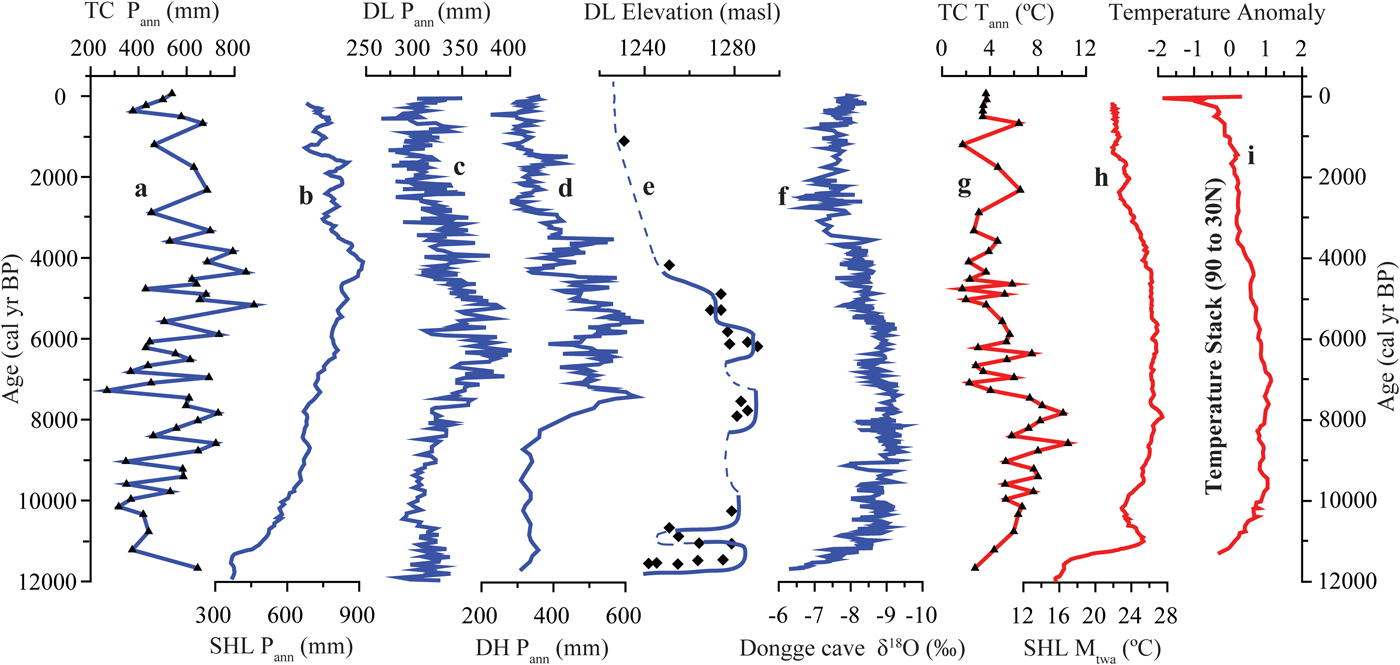
Figure 6. (color online) Comparison of regional climate records from northeastern China, southern China and high latitudes of the Northern Hemisphere. (a) Reconstructed Pann record from Tianchi Crater Lake; (b) Reconstructed Pann record from Sihailongwan Lake (Stebich et al., Reference Stebich, Rehfeld, Schlütz, Tarasov, Liu and Mingram2015); (c) Reconstructed Pann record from Dali Lake (Xiao et al., Reference Xiao, Fan, Zhai, Wen and Qin2015); (d) Reconstructed Pann record from Daihai Lake (Xu et al., Reference Xu, Xiao, Li, Tian and Nakagawa2010); (e) Lake-level record from Dali Lake (Goldsmith et al., Reference Goldsmith, Broecker, Xu, Polissar, deMenocal, Porat, Lan, Cheng, Zhou and An2017); (f) δ18O record from Dongge cave (Dykoski et al., Reference Dykoski, Edwards, Cheng, Yuan, Cai, Zhang, Lin, Qing, An and Revenaugh2005); (g) Reconstructed Tann record from Tianchi Crater Lake; (h) Reconstructed mean temperature of the warmest month (Mtwa) from Sihailongwan Lake (Stebich et al., Reference Stebich, Rehfeld, Schlütz, Tarasov, Liu and Mingram2015); (i) Temperature anomaly record for high latitudes of the Northern Hemisphere (Marcott et al., Reference Marcott, Shakun, Clark and Mix2013).
Holocene monsoonal precipitation changes in northeastern China
The Pann records from Daihai Lake (Xu et al., Reference Xu, Xiao, Li, Tian and Nakagawa2010), Sihailongwan Lake (Stebich et al., Reference Stebich, Rehfeld, Schlütz, Tarasov, Liu and Mingram2015), and Dali Lake (Xiao et al., Reference Xiao, Fan, Zhai, Wen and Qin2015) all show a mid-Holocene rainfall maximum, which is also confirmed by the record of effective precipitation from the Hani peatland reconstructed from biomarker lipid composition (Zhou et al., Reference Zhou, Zheng, Meyers, Jull and Xie2010). A pollen record from Gonghai Lake, in the adjacent region, reveals a monsoon precipitation maximum from 7800–5300 cal yr BP (Chen et al., Reference Chen, Xu, Chen, Birks, John, Liu, Zhang and Jin2015), which was confirmed by a long-chain n-alkanes δ13C record (Rao et al., Reference Rao, Jia, Li, Chen, Xu and Chen2016) and is a little earlier than records from northeastern China. In general, the reconstructed monsoon precipitation maxima in northeastern China are temporally consistent, with slight differences between the onset times.
However, the mid-Holocene rainfall maximum recorded from Tianchi Crater Lake in the above-mentioned records is much later compared with that recorded from Bayanchagan Lake (Jiang et al., Reference Jiang, Guiot, Chu, Wu, Yuan, Hatté and Guo2010) and with the lake-level highstands at Dali Lake (Goldsmith et al., Reference Goldsmith, Broecker, Xu, Polissar, deMenocal, Porat, Lan, Cheng, Zhou and An2017) and Huangqihai Lake (Zhang et al., Reference Zhang, Tsukamoto, Jia and Frechen2016). The earlier maxima may be unreliable due to differences in methods and to the influence of hydrological factors other than monsoon precipitation. The pollen-based Pann record from Bayanchagan Lake (Jiang et al., Reference Jiang, Guiot, Chu, Wu, Yuan, Hatté and Guo2010) contains an early- to mid-Holocene monsoon precipitation maximum, which may be attributed to differences between the numerical reconstruction methods (Jiang et al., Reference Jiang, Guo, Sun, Wu, Chu, Yuan, Hatté and Guiot2006, Reference Jiang, Guiot, Chu, Wu, Yuan, Hatté and Guo2010). The early-Holocene lake-level highstand at Huangqihai Lake was thought to be controlled by other factors in addition to monsoon precipitation (Zhang et al., Reference Zhang, Tsukamoto, Jia and Frechen2016). The lake-level record for Dali Lake may also have been controlled by other factors (Liu et al., Reference Liu, Chen, Chen, Zhang and Chen2017; Wen et al., Reference Wen, Xiao, Fan, Zhang and Yamagata2017), including runoff from snow/ice melting in the Da Hinggan Range (Xiao et al., Reference Xiao, Si, Zhai, Itoh and Lomtatidze2008; Liu et al., Reference Liu, Chen, Chen, Zhang and Chen2017), the underground water supply, and underestimation of the drainage area of Dali Lake (Wen et al., Reference Wen, Xiao, Fan, Zhang and Yamagata2017).
Causal mechanisms of Holocene monsoon precipitation in northeastern China
Low-latitude summer insolation changes are generally considered to be the main external forcing mechanism of changes in monsoon precipitation (Dykoski et al., Reference Dykoski, Edwards, Cheng, Yuan, Cai, Zhang, Lin, Qing, An and Revenaugh2005; Chen et al., Reference Chen, Yu, Yang, Ito, Wang, Madsen and Huang2008). However, the trend of Holocene monsoon precipitation records in northeastern China differs from that of low-latitude Northern Hemisphere summer insolation (Fig. 7), suggesting that internal forcing factors within the Earth system were also important. Such internal factors include shrinkage of the Northern Hemisphere ice sheets (Wen et al., Reference Wen, Xiao, Chang, Zhai, Xu, Li and Itoh2010; Chen et al., Reference Chen, Xu, Chen, Birks, John, Liu, Zhang and Jin2015) and related sea-level variations (Li et al., Reference Li, Wu, Yu, Sun, Marković and Guo2014; Wen et al., Reference Wen, Xiao, Fan, Zhang and Yamagata2017), changes in the east-west thermal gradient in the equatorial Pacific (Rao et al., Reference Rao, Jia, Li, Chen, Xu and Chen2016), sea surface temperature (SST) variations (Chu et al., Reference Chu, Sun, Xie, Lin, Shang, Zhu and Shan2014), and variations in sea-ice extent in the Okhotsk Sea (Stebich et al., Reference Stebich, Rehfeld, Schlütz, Tarasov, Liu and Mingram2015).
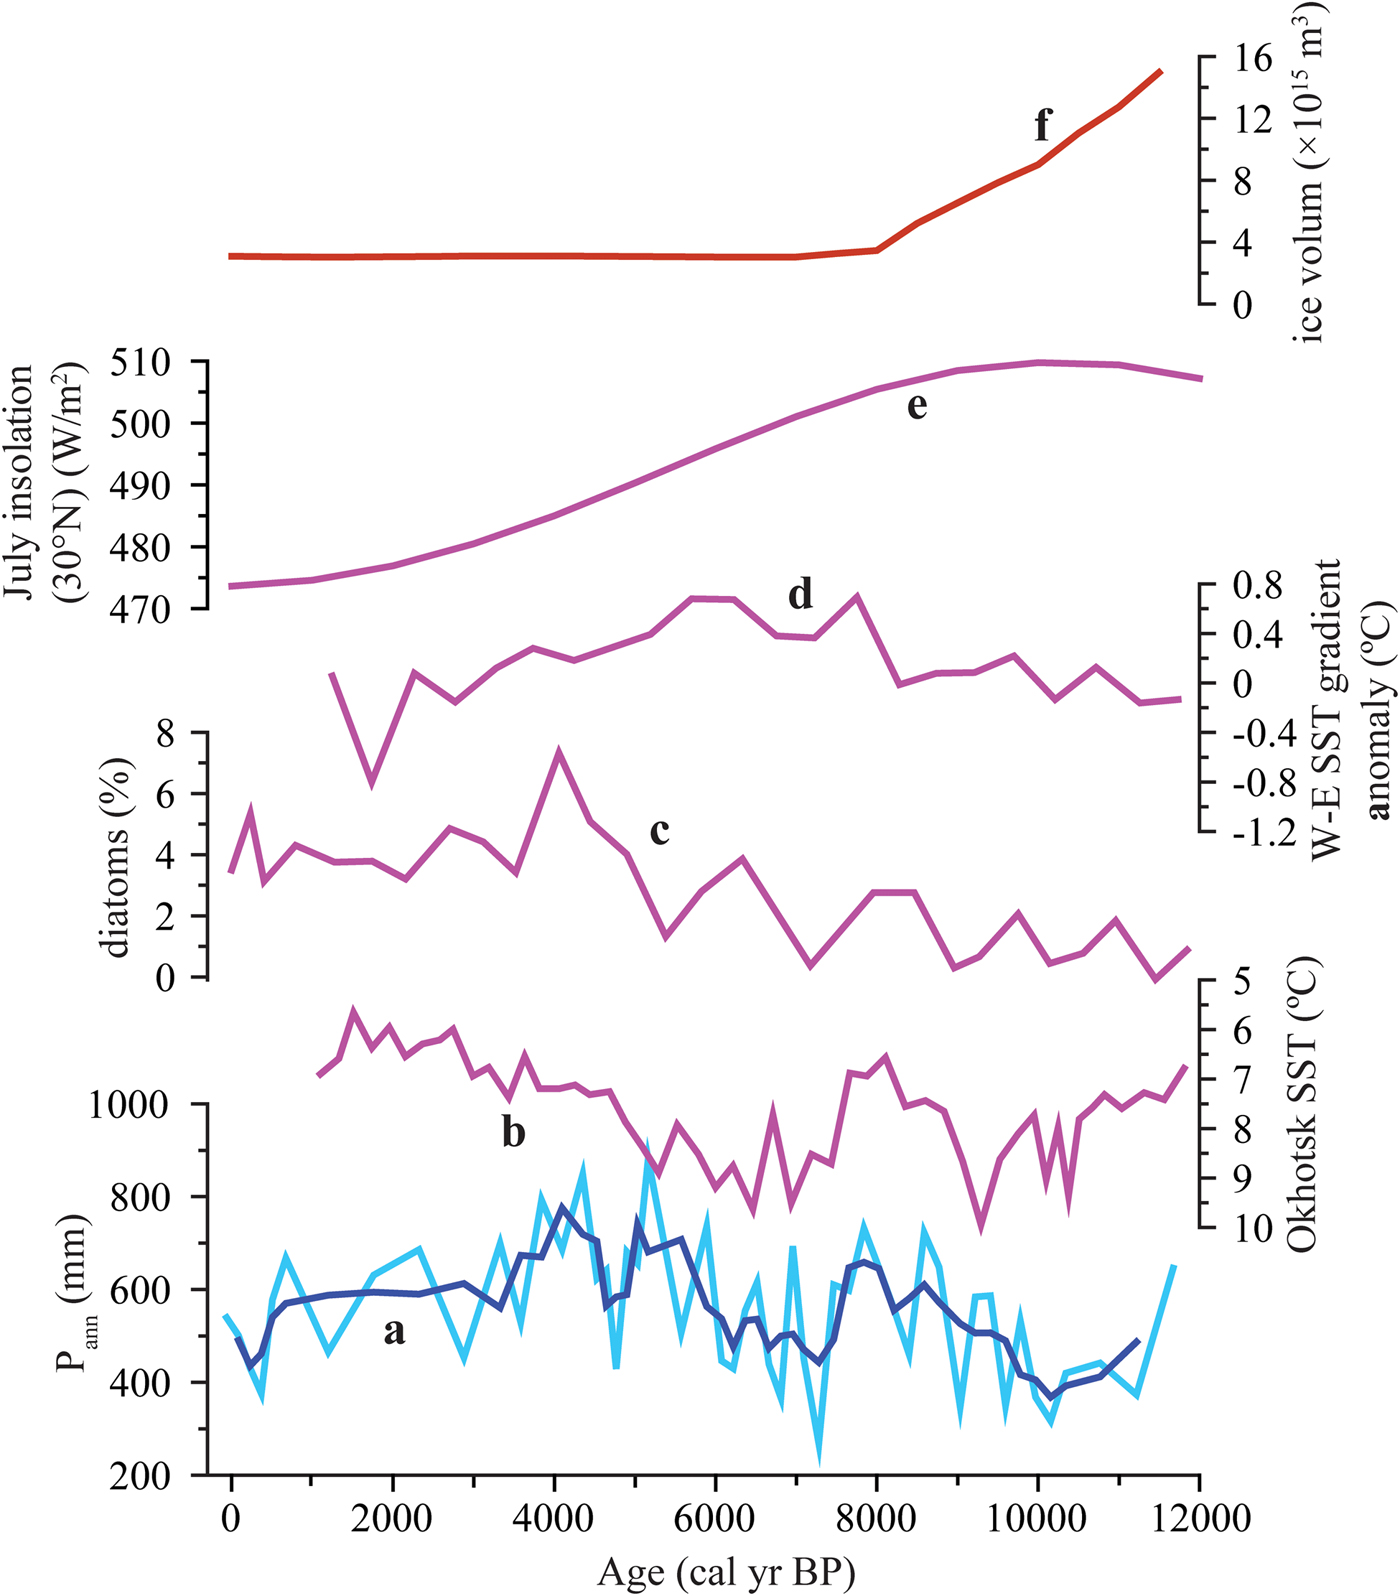
Figure 7. Comparison of the pollen-derived quantitative precipitation record (Pann) for Tianchi Crater Lake with other paleoclimatic records; (a) Reconstructed Pann from Tianchi Crater Lake (light blue curve) and the five points running average (dark blue curve); (b) Okhotsk SST (Max et al., Reference Max, Riethdorf, Tiedemann, Smirnova, Lembke-Jene, Fahl, Nürnberg, Matul and Mollenhauer2012); (c) Relative abundance of sea-ice-related diatoms from the western Okhotsk Sea (Harada et al., Reference Harada, Katsuki, Nakagawa, Matsumoto, Seki, Addison, Finney and Sato2014); (d) East-west SST gradient anomalies in the equatorial Pacific (Koutavas and Joanides, Reference Koutavas and Joanides2012); (e) North Hemisphere summer (July) insolation at 30°N (Laskar et al., Reference Laskar, Robutel, Joutel, Gastineau, Correia and Levrard2004); (f) Northern Hemisphere ice volume (Peltier et al., Reference Peltier2004). (For interpretation of the references to color in this figure legend, the reader is referred to the web version of this article.)
The Northern Hemisphere ice sheets retreated continuously between 12,000–8000 cal yr BP (Fig. 7f) when EASM precipitation gradually increased, as shown by several records from northern China (Xu et al., Reference Xu, Chen, Zhang, Cao, Li, Li, Li, Chen, Liu and Wang2016), including the precipitation record from Tianchi Crater Lake. The clearly synchronous changes in ice volume and EASM precipitation support the significant influence of Northern Hemisphere ice sheets on EASM strength via shifts in the westerlies (Chen et al., Reference Chen, Xu, Chen, Birks, John, Liu, Zhang and Jin2015) or changing sea level (Li et al., Reference Li, Wu, Yu, Sun, Marković and Guo2014; Sun et al., Reference Sun, Guo, Wu, Li, Yu, Luo, Jiang and Li2017). In a previous study on reconstructing moisture levels using aeolian deposits and vegetation in the dry lands of northern China, Li et al. (Reference Li, Wu, Yu, Sun, Marković and Guo2014) proposed that ice volume-controlled sea-level rise may have shortened the moisture transport distance from the ocean to the continental interior, thus causing the monsoon rainfall belt to migrate northwards. However, the continuous increase in monsoon precipitation after ~8000 cal yr BP is inconsistent with the relative stability of the Northern Hemisphere ice sheets. Moreover, the shrinkage of these ice sheets in the early to mid-Holocene occurred mainly in North America (Peltier, Reference Peltier2004; Törnqvist and Hijma, Reference Törnqvist and Hijma2012), which has been suggested to have had little influence on EASM strength (Sundaram et al., Reference Sundaram, Yin, Berger and Muri2012). However, additional numerical simulations are needed, because analysis of instrumental data records indicates that climate variations around North America do significantly impact EASM strength (Lu et al., Reference Lu, Dong and Ding2006).
The coupled Pacific Ocean–Atmosphere System, which directly transports moisture from the tropical Pacific to the Asian interior and regulates the position of the subtropical monsoon stationary front (Jiang et al., Reference Jiang, He, Shen, Kong, Li and Chang2012; Chu et al., Reference Chu, Sun, Xie, Lin, Shang, Zhu and Shan2014), is considered a key factor influencing rainfall distribution in the EAM region (Ding and Chan, Reference Ding and Chan2005; Stebich et al., Reference Stebich, Rehfeld, Schlütz, Tarasov, Liu and Mingram2015). From a comparison of n-alkane and compound-specific carbon isotope records from Xiaolongwan Lake in northeastern China with an SST record from the southern margin of the Okhotsk High, Chu et al. (Reference Chu, Sun, Xie, Lin, Shang, Zhu and Shan2014) revealed that decreasing SSTs in the Okhotsk Sea may have strengthened the Okhotsk High and thereby supplied more moisture to northeastern China during the Holocene. The consistency of the SST and precipitation records from Tianchi Crater Lake during the early to mid-Holocene supports the reality of this forcing mechanism. However, at Tianchi Crater Lake, precipitation decreased during the late Holocene, while there was a decrease in the Okhotsk SST record (Fig. 7), and this divergence may be attributed to other factors.
In addition to temperature variations, the Okhotsk Sea ice extent is considered a major regulator of EASM rainfall in northern China (Harada et al., Reference Harada, Katsuki, Nakagawa, Matsumoto, Seki, Addison, Finney and Sato2014). There is a strong similarity between the quantitative rainfall record from Sihailongwan Lake and the relative abundance of sea-ice-related diatoms from the western Okhotsk Sea, with both records exhibiting an early to mid-Holocene increase with a maximum at ~4000 cal yr BP (Stebich et al., Reference Stebich, Rehfeld, Schlütz, Tarasov, Liu and Mingram2015). This linkage is supported by the precipitation record from Tianchi Crater Lake (Fig. 5). However, in view of the complex spatiotemporal variability of marine records (Harada et al., Reference Harada, Katsuki, Nakagawa, Matsumoto, Seki, Addison, Finney and Sato2014), more precise dating and more robust data interpretation are still needed (Stebich et al., Reference Stebich, Rehfeld, Schlütz, Tarasov, Liu and Mingram2015).
Modern instrumental evidence indicates that tropical climate features such as the El Niño–Southern Oscillation (ENSO) are closely connected with the EASM. When an ENSO event occurs, a negative anomaly may appear in the western tropical Pacific Ocean and thus convective activity may be strong around East Asia (Huang and Wu, Reference Huang and Wu1989; Thompson et al., Reference Thompson, Conroy, Collins, Hlohowskyj, Overpeck, Riedinger-Whitmore and Cole2017). The west-east thermal gradient in the equatorial Pacific Ocean, serving as a proxy for ENSO variations, is strongly coherent with the EASM record from Gonghai Lake (Chen et al., Reference Chen, Xu, Chen, Birks, John, Liu, Zhang and Jin2015). Paleo-reconstruction and simulation of ENSO both indicate that El Niño events increased in frequency during the late Holocene, favoring a weak EASM (Chen et al., Reference Chen, Xu, Chen, Birks, John, Liu, Zhang and Jin2015) and confirming the plausibility of an ENSO influence on variations in EASM precipitation. Nevertheless, peaks in precipitation in northeastern China seem to have occurred later than those at Gonghai Lake in northern China (Chen et al., Reference Chen, Xu, Chen, Birks, John, Liu, Zhang and Jin2015). The relationship between ENSO-like oscillations and precipitation in northeastern China is thus different from that in northern China and needs further study.
It is clear from the results of this and other studies that rainfall in the EASM region is affected by a complex range of factors and there is no consensus regarding the cause of the delayed onset of the HSMM in northeastern China; it is possible that no single factor was principally responsible. Spatial differences in the timing of the onset of the HSMM, especially those revealed by pollen records (Zhou et al., Reference Zhou, Sun, Zhan, Huang, Zhou, Hao and Wang2016), clearly need further study to identify the forcing mechanisms. Numerical climate modelling, which can integrate the effects of many factors, may be a useful approach for resolving the issue.
CONCLUSIONS
Changes in vegetation, precipitation, and temperature in northeastern China during the Holocene were reconstructed from the pollen spectra of a sediment core from Tianchi Crater Lake. The fossil pollen data reveal a vegetation transition in the study area from sparse forest steppe to typical forest steppe at ~6500 cal yr BP. The reconstructed precipitation record also features increasing precipitation during the early to mid-Holocene and yields a peak at ~5500–3100 cal yr BP. The trend of reconstructed precipitation is roughly consistent with other pollen-based reconstructions from northeastern China, with slight differences between the onset times. However, the temperature record exhibits a divergent pattern with a marked rise since the early Holocene and a decrease after ~8000 cal yr BP. Plausible forcing mechanisms for precipitation changes in northeastern China include summer insolation, Northern Hemisphere ice volume, the east-west SST gradient in the tropical Pacific Ocean, and SST and sea-ice changes in the Okhotsk Sea. However, no single factor appears to fully explain the delayed occurrence of the HSMM in northeastern China, indicating the complexity of the forcing of regional rainfall in the EAM region. Further studies, such as simulations and the use of robust proxies, are needed to improve our understanding of the spatiotemporal pattern of the HSMM in the EAM region.
ACKNOWLEDGMENTS
We thank two anonymous reviewers, Senior Editor Nicholas Lancaster, and Associate Editor Wyatt Oswald for constructive comments that greatly improved this manuscript. This study was jointly supported by the National Basic Research Program of China (Grant No. 2015CB953802), the National Science Foundation of China (Grant Nos. 41672159, 41472149, and 41301040), the Ministry of Land and Resources (Grant No. 201311137), and the Youth Innovation Promotion Association CAS (Grant No. 2018498). We thank Shouli Yang, Chunlai Yang, and Guoqiang Chu for their invaluable assistance in the field and with core sampling.