


Introduction
Animal African trypanosomiasis (AAT) is a life-threatening disease in cattle caused by trypanosome parasites (Trypanosoma congolense, Trypanosoma brucei and Trypanosoma vivax) (Alingu et al., Reference Alingu, Muhanguzi, MacLeod, Waiswa and Fyfe2014; Muhanguzi et al., Reference Muhanguzi, Picozzi, Hatendorf, Thrusfield, Welburn, Kabasa and Waiswa2014). Trypanosomes are transmitted by the tsetse fly, and occur widely in sub-Saharan Africa (SSA) (Wenzler et al., Reference Wenzler, Schumann Burkard, Schmidt, Maser, Bergner, Roditi and Brun2016). Tsetse flies are widely distributed in Kenya, and can be found in 38 of the 47 counties occupying approximately 138 000 km2 (23% of the country), putting approximately 11 million people at risk of infection (KENTTEC, 2017). Each year, this huge AAT burden results in approximately 5 billion US dollars in losses to rural SSA economies, and up to 60 million cattle are at risk of disease (Brun and Balmer, Reference Brun and Balmer2006). Chemotherapy and chemoprophylaxis remain the most viable ways of managing AAT, in the absence of sustainable vector control strategies, and lack of a vaccine (FAO, 1998b). In Nguruman, a high AAT disease burden area in Narok county Kenya, chemoprophylaxis of the non-trypanotolerant cattle breed, Boran, increased productivity by 35% compared with the trypanotolerant, N'Dama, cattle breed of West and Central Africa under similar conditions without chemoprophylaxis (Maichomo et al., Reference Maichomo, Ndungu, Ngare and Ole-Mapenay2005). Each year, an estimated 70 million doses are purchased for AAT management (Giordani et al., Reference Giordani, Morrison, Rowan, HP and Barrett2016). There is increasing concern over the rapidly developing, widespread, multi-drug resistance to the few available trypanocidal drug classes (isometamidium, homidium and diminazene) that have been in use for over 60 years increasing treatment failure and livestock mortality rates (Geerts et al., Reference Geerts, Holmes, Eisler and Diall2001; Delespaux et al., Reference Delespaux, Geysen, Van den Bossche and Geerts2008; Giordani et al., Reference Giordani, Morrison, Rowan, HP and Barrett2016). At present, resistance to at least one of the three commonly used trypanocide classes (isometamidium, homidium and diminazene) has been reported in 17 countries including: Kenya, Ethiopia, Uganda, Tanzania, Sudan, Somalia, Burkina Faso, Chad, Ivory Coast, Central African Republic, Mali, Cameroon, Nigeria, Guinea, Zimbabwe, Zambia and Mozambique (Delespaux et al., Reference Delespaux, Geysen, Van den Bossche and Geerts2008). Previous studies in Kwale county, Kenya, have found a high prevalence (33.9%) of bovine trypanosomiasis (Mbahin et al., Reference Mbahin, Affognon, Andoke, Tiberius, Mbuvi, Otieno, Muasa and Saini2013), and a high incidence of AAT calf morbidity (29.1%) compared with other vector-borne infections (Muraguri et al., Reference Muraguri, McLeod, McDermott and Taylor2005). Widespread trypanocide resistance, although variable across eastern and southern Africa, is remarkably severe in coastal regions of Tanzania and Kenya, which have high prevalence of multi-drug resistance associated with a history of high drug usage (Geerts et al., Reference Geerts, Holmes, Eisler and Diall2001). This is in contrast to western Kenya and eastern Zambia, where only single-drug trypanocide resistance has been reported (Geerts et al., Reference Geerts, Holmes, Eisler and Diall2001).
Limited access to affordable veterinary care by smallholder farmers in these trypanosomiasis endemic, resource poor settings aggravates the situation (Holt et al., Reference Holt, Selby, Mumba, Napier and Guitian2016). Poor compliance to prescribed trypanocide regimens, unsuitable trypanocide choice and unfavourable dosing are driving increased annual treatment failure rates. Optimal trypanocide use, which restricts widespread multi-drug resistance, is crucial for disease management. There has been a lot of focus on antibiotics and not on antifungals, nor on antivirals, nor on antiprotozoals, because antibiotics are thought to be more widely prescribed, sold and used compared with other antimicrobials, particularly for animal treatment (G7 2017 ITALIA, 2017). The relatively limited market in Africa, compared with the high costs associated with developing and licensing new trypanocides has discouraged development of new drugs and led to over-reliance on old existing drugs (Geerts et al., Reference Geerts, Holmes, Eisler and Diall2001). Emerging resistance has hampered AAT control, and results from: underestimation of animal body weight, over diluting drugs, administering incorrect dose volumes and incorrect and therefore ineffective injections (Leak, Reference Leak1998). Optimal use of trypanocides makes emphasis on administering dosages based on live body weight, and following the manufacturer's instructions (FAO, 1998a). It is critical that the weight of the animal to be treated is determined or estimated as accurately as possible, but weighing-scales and balances are unavailable at most treatment facilities, and inaccessible to small-holder farmers due to low socioeconomic status. There have been efforts to develop simple to use diagnostic tools for accurate detection of trypanosome infections by healthcare personnel prior to trypanocide administration or prescription, but slow integration into health care systems still remains the main impediment (Kuzoe, Reference Kuzoe1993). Thus, there is lack of sufficient evidence on efficacious trypanocide use that would lead to changes in veterinary public health policies. Studies on the efficacy of repeat treatments of T. congolense infections using diminazene aceturate suggest that the length of exposure and drug concentration are crucial during treatment, but there is uncertainty on whether this is replicable for other trypanocides (Melaku and Bekele, Reference Melaku and Bekele2013). The laborious nature and the huge expenses associated with extensive field and laboratory studies have gravely prohibited prospective evaluation of the optimal trypanosomiasis prevention strategies resulting from trypanocide use (Giordani et al., Reference Giordani, Morrison, Rowan, HP and Barrett2016). For example, it is still unclear: (i) in what order to use the available trypanocides from different classes to achieve the most optimal treatment in trypanosomiasis endemic locales, (ii) what proportion of animals in an exposed population should be treated to restrict trypanocide resistance and (iii) whether combination therapy (simultaneous use of two trypanocides) would be better than single-drug treatment. To address these three challenges, we use mathematical models to generate verifiable, quantitative predictions on the appropriate use of trypanocides to restrict the spread of multi-drug resistant trypanosomes indiscernible solely by intuition. The motivation is to use baseline data on trypanosomiasis prevalence and trypanocide use, to highlight treatment regimens that significantly improve therapeutic outcomes, thereby impeding widespread resistance to multiple trypanocides.
We implement these strategies using information from previous studies (see Materials and methods), and prospectively collected data from smallholder farmers in the resource poor settings of Kwale, Kenya. In Kenya, Shimba Hills in Kwale county has the highest trypanosomiasis prevalence (33.9%) compared with other counties, and a huge burden of multi-drug resistance associated with a record of high trypanocide usage (Geerts et al., Reference Geerts, Holmes, Eisler and Diall2001; Muraguri et al., Reference Muraguri, McLeod, McDermott and Taylor2005; Mbahin et al., Reference Mbahin, Affognon, Andoke, Tiberius, Mbuvi, Otieno, Muasa and Saini2013). We envisage that our results forecasting trypanocide resistance will inform on the best treatment regimens, which minimize treatment failure rates.
Materials and methods
Study site and data collection
We collected data on trypanosomiasis incidence and history of trypanocide use from smallholder farmers (n = 47), and county veterinary health officers (n = 3) in Shimba Hills (latitude −4.174°S and longitude 39.4602°E), Kwale County, Kenya. The farmers were from two villages of Kizibe and Mbegani. We collected data using questionnaires and bovine blood samples to establish AAT point prevalence, over the month of December 2015. Cases were confirmed using blood samples collected from cattle presenting malaise and trypanosomiasis symptoms by using polymerase chain reaction to detect trypanosome positive samples. The point prevalence of AAT was 4 and 11% in Kizibe and Mbegani villages, respectively.
Mathematical model and assumptions
We implemented a deterministic trypanosome transmission model. The model has two main parts that depict trypanosome transitions in the tsetse fly (vector) and cattle (host) populations (Supplementary Fig. S1). Each part is further sub-divided into compartments representing trypanosome transitions across different vector (susceptible, exposed and infectious) (Supplementary Fig. S1A and B), and host (susceptible, exposed, infectious, treated and withdrawn) states plus resistant sub-populations (Supplementary Fig. S1C and D). The susceptible compartments contain uninfected cattle and tsetse sub-populations that are at risk of infection when exposed to trypanosomes. The exposed compartment contains those cattle and tsetse sub-populations that are exposed to trypanosomes, but are not infectious. Tsetse flies do not recover after trypanosome infection during their lifespan (Franco et al., Reference Franco, Simarro, Diarra and Jannin2014), and therefore a ‘withdrawn’ compartment was omitted. The withdrawn compartment consists of the cattle sub-population that had been treated and recovered. Cattle could have recovered naturally or as a result of treatment (Supplementary Fig. S1). We used field-collected and publicly available data as parameters for the deterministic model (Supplementary Table S1). We assume that trypanosomiasis infection rate remains uniform throughout the year, and is not affected by environmental factors such as rainfall and temperature (Moore et al., Reference Moore, Shrestha, Tomlinson and Vuong2012). Smallholder farmers use trypanocides to treat a wide range of perceived symptoms; and we assume that treated infectious cattle had trypanosome infection. Since cattle (hosts) acquire infection through bites from infected tsetse flies (vector), we assume a constant bite rate and similitude between tsetse fly species. We defined a single parameter to account for migration into the population, and reproduction rate for both the host and vector population. Currently, there are three main trypanocides used to treat cattle, which were introduced at different times (homidium – 1952, diminazene – 1955 and isometamidium – 1960) (Giordani et al., Reference Giordani, Morrison, Rowan, HP and Barrett2016). However, information of when and in what order they were introduced in disease endemic locales is unavailable. Our model therefore assumes that trypanosomes are most resistant to drug 1, least resistant to drug 3 and that drug 2 is intermediate between them, for these drug classes. We assumed that we have a single drug from each of the three different, widely used trypanocides drugs (isometamidium, homidium and diminazene). The rate at which the trypanosomiasis-induced death rate increases due to resistance to drugs 1, 2 and 3 was also determined based on the assumption that drug 1 is the least effective by virtue of having the most extended use, while drug 3 is the most effective, and drug 2 is intermediate between them. Thus, we also established from analysis of the collected questionnaire data that the highest death rate after treatment was 30%, and the lowest was 10%. Hence, drug 1 failure is associated with 30% of the deaths and drug 3 with 10% of the deaths (Supplementary Table S1).
The 47 farmers interviewed had a total of 630 cattle, an average of 13 cattle per farmer. The total number of cattle rearing farmers from the two villages was estimated to be 373 from the veterinary health records. Hence our model uses an estimate of 5000 for the cattle population. Tsetse fly density varies both across and within countries in SSA (FAO, 1992). In Kenya, it is estimated that endemic regions are infested with up to 1000 tsetse flies per square kilometre (Sum, Reference Sum2014; KENTTEC, 2017). The endemic regions in this study, Mbegani and Kizibe, are close to the Shimba Hills National Reserve and cover a total area of approximately 40 km2. Thus, we use 40 000 flies for our model. It was also assumed that initially there was no treatment occurring with approximately 5% of the cattle population being exposed and approximately 29% infected. All assumptions are listed in the supplementary materials (Supplementary Materials 1).
We evaluate trypanosome drug resistance using three different transmission rates (low 4%, medium 7.5% and high 11%) that reflect differences in drug resistant disease point prevalence values established at two different endemic sampling locales (Kizibe 4%, and Mbegani 11%), which are distant and proximal to the Shimba Hill National Reserve, Kwale – Kenya, respectively. Pathogen transmission and prevalence are strongly correlated; with pathogen prevalence increasing commensurately with transmission (Lipsitch and Moxon, Reference Lipsitch and Moxon1997; Kajita et al., Reference Kajita, Okano, Bodine, Layne and Blower2007; Weinberger et al., Reference Weinberger, Dagan, Givon-Lavi, Regev-Yochay, Malley and Lipsitch2008). Simulations with discrete time-steps of one day for a period of 3 years highlight differences in a range of drug regimens, and changes in compartment size for host and vector population infected with resistant trypanosomes.
Trypanosomes are transmitted at a constant rate, β. Fitness cost associated with resistance to drugs 1, 2 and 3 are denoted λ 1, λ 2 and λ 3, respectively (Supplementary Table S1 and Fig. S1). The ordinary differential equations for the host (cattle) population are described below.
The susceptible host sub-population is given by:
 $${S}^{\prime}_{\rm h}(t)\, = \,\lambda _{\rm h}-\displaystyle{{\beta _{\rm h}CI_{\rm v}(t)} \over {N_{\rm h}\,(t)S_{\rm h}(t)}}\, + \,\rho \,W_{\rm h}(t) - \mu _{\rm h}S_{\rm h}(t)$$
where β h is the host transmission rate; C is a coefficient of infection that satisfies 0 < C < 1; I v(t) infectious vector population at a given time, t and N h(t) is the total host population at a given time, t. S h′(t) is the derivative with respect to time of the susceptible cattle population, S h(t); λ h is the combined birth rate and immigration of the host population; W h(t) is the recovered or withdrawn cattle population at a given time, t; ρ is the rate at which withdrawn population become susceptible and μ h is the death rate of the susceptible host population.
The exposed host sub-population is given by:
 $${E}^{\prime}_{\rm h}(t) = \displaystyle{{\beta _{\rm h}CI_{\rm v}(t)} \over {N_{\rm h}(t)S_{\rm h}(t)}}-\psi _{\rm h}E_{\rm h}(t)-\mu _{\rm h}E_{\rm h}(t)$$
where E h′(t) is the derivative with respect to time of the exposed host population, E h(t); and ψ h is the rate at which the exposed cattle population become infectious.
The infectious host sub-population is given by:
 $${I}^{\prime}_h(t) = \psi _{\rm h}E_{\rm h}(t) - \theta I_{\rm h}(t)-\eta _{\rm I}I_{\rm h}(t)-\delta _{\rm h}I_{\rm h}(t)-\mu _{\rm h}I_{\rm h}(t)$$
where I h′(t) is the derivative with respect to time of the infectious host population, I h(t); θ is the proportion of the infectious population subjected to treatment; η I is the proportion of the infectious cattle that naturally recovers from AAT and δ h is the AAT-induced death rate, the deaths that occur as a result of trypanosomiasis infection.
The treated host sub-population is given by:
 $$\eqalign{{T}^{\prime}_{\rm h}(t) & = \theta I_{\rm h}(t)-\lambda _1T_{\rm h}(t)-\lambda _2T_{\rm h}(t)-\lambda _3T_{\rm h}(t)-\lambda _{1,2}T_{\rm h}(t) \cr & \qquad -\lambda _{2,1}T_{\rm h}(t)-\lambda _{1,3}T_{\rm h}(t)-\lambda _{3,1}T_{\rm h}(t)-\lambda _{2,3}T_{\rm h}(t) \cr & \qquad -\lambda _{3,2}T_{\rm h}(t)-\eta _{\rm T}T_{\rm h}(t)-\delta _{\rm h}T_{\rm h}(t)-\mu _{\rm h}T_{\rm h}(t)}$$
where T h′(t) is the derivative with respect to time of the treated cattle population, T h(t); λ 1, λ 2 and λ 3 are the rates of resistance acquired as a result of treatment by drugs 1, 2 and 3, respectively; and is the proportion of the treated cattle population that recovers as a result of treatment.
The host sub-population resistant to drug 1 is given by:
 $$\eqalign{{R}^{\prime}_{{\rm h1}}(t) & = \lambda _1T_{\rm h}(t)-\lambda _2R_{{\rm h}1}(t)-\lambda _3R_{{\rm h}1}(t)-\eta _1R_{{\rm h1}}(t) \cr & \qquad -a_1\delta _{\rm h}R_{{\rm h}1}(t)-\mu _{\rm h}R_{{\rm h}1}(t) + \lambda _1R_{{\rm h2}}(t) + \lambda_1 R_{{\rm h}3}(t) \cr & \qquad -\lambda_{2,1}R_{{\rm h}1}(t)-\lambda _{3,1}R_{{\rm h}1}(t)}$$
where R h1′(t) is the derivative with respect to time of the cattle population that become resistant to drug 1, R h1(t); λ 2R h1(t) and λ 3R h1(t) are the proportion cattle resistant to drug 1 that develop resistance after treatment with drugs 2 and 3, respectively; λ 1R h2(t) and λ 1R h3(t) are the proportion of cattle resistant to drugs 2 and 3, respectively that develop resistance after treatment with drug 1; η 1 is the proportion of cattle population resistant to drug 1 that recovers naturally and a 1 is the proportion of AAT-induced cattle that die due to resistance to drug 1.
The host sub-population resistant to drug 2 is given by:
 $$\eqalign{{R}^{\prime}_{{\rm h}2}(t) & = \lambda _2T_{\rm h}(t)-\lambda _1R_{{\rm h}2}(t)-\lambda _3R_{{\rm h}2}(t)-\eta _2R_{{\rm h2}}(t) \cr & \qquad -a_2\delta _{\rm h}R_{{\rm h}2}(t)-\mu _{\rm h}R_{{\rm h}2}(t) + \lambda _2R_{{\rm h}1}(t) + \lambda_2 R_{{\rm h}3}(t) \cr & \qquad -\lambda _{1,2}R_{{\rm h}2}(t)-\lambda _{3,2}R_{{\rm h}2}(t)}$$
where R h2′(t) is the derivative with respect to time of the cattle population that become resistant to drug 2, R h2(t); η 2 is the proportion of cattle population resistant to drug 1 that recovers naturally and a 2 is the proportion of AAT-induced cattle that die due to resistance to drug 2.
The host sub-population resistant to drug 3 is given by:
 $$\eqalign{{R}^{\prime}_{{\rm h3}}(t) & = \lambda _3T_{\rm h}(t)-\lambda _1R_{{\rm h}3}(t)-\lambda _2R_{{\rm h}3}(t)-\eta _3R_{{\rm h}3}(t) \cr & \qquad -a_3\delta _{\rm h}R_{{\rm h}3}(t)-\mu _{\rm h}R_{{\rm h}3}(t) + \lambda _3R_{{\rm h}1}(t) + \lambda _3R_{{\rm h}2}(t)) \cr & \qquad - \lambda _{1,3}R_{{\rm h}3}(t)-\lambda _{2,3}R_{{\rm h}3}(t)}$$
where R h3′(t) is the derivative with respect to time of the cattle population that become resistant to drug 3, R h3(t); η 3 is the proportion of cattle population resistant to drug 1 that recovers naturally and a 3 is the proportion of AAT-induced cattle that die due to resistance to drug 3.
The host sub-population resistant to both drugs 1 and 2 is given by:
 $$\eqalign{{R}^{\prime}_{{\rm h}1,2}(t) & = (\lambda _{1,2} + \lambda _{2,1})T_{\rm h}(t) + \lambda _{1,2}R_{{\rm h}2}(t) + \lambda _{2,1}R_{{\rm h1}}(t) \cr & \quad -(\eta _{1,2} + a_{1,2}\delta h{\rm} + \mu _{\rm h})R_{{\rm h}1,2}(t)}$$
where R h1,2′(t) is the derivative with respect to time of the cattle population that become resistant to both drugs 1 and 2, R h1,2(t); λ 1,2 is the proportion of cattle resistant after successive treatment with drug 1 followed by drug 2, and eventually non-susceptible to both (λ 1,2 = λ 1 × λ 2); λ 2,1 is the proportion of cattle resistant after successive treatment with drug 2 followed by drug 1, and eventually non-susceptible to both (λ 2,1 = λ 2 × λ 1). Similar definitions follow for λ 1,3, λ 3,1, λ 2,3 and λ 3,2. η 1,2 is the proportion of cattle population resistant to treatment with both drugs 1 and 2 that recovers naturally; and a 1,2 is the proportion of AAT-induced cattle that die due to resistance to both drugs 1 and 2.
The host sub-population resistant to both drugs 1 and 3 is given by:
 $$\eqalign{{R}^{\prime}_{{\rm h}1,3}(t) & = (\lambda _{1,3} + \lambda _{3,1})T_{\rm h}(t) + \lambda _{1,3}R_{{\rm h}3}(t) + \lambda _{3,1}R_{{\rm h}1}(t) \cr & \quad -(\eta _{1,3} + a_{1,3}\delta h + \mu _{\rm h})R_{{\rm h1,3}}(t)}$$
where R h1,3′(t) is the derivative with respect to time of the cattle population that become resistant to both drugs 1 and 3, R h1,3(t); η 1,3 is the proportion of cattle population resistant to treatment with both drugs 1 and 3 that recovers naturally and a 13 is the proportion of AAT-induced cattle that die due to resistance to both drugs 1 and 3.
The host sub-population resistant to both drugs 2 and 3 is given by:
 $$\eqalign{{R}^{\prime}_{{\rm h}2,3}(t) & = (\lambda _{2,3} + \lambda _{3,2})T_{\rm h}(t) + \lambda _{2,3}R_{{\rm h}3}(t) + \lambda _{3,2}R_{{\rm h}2}(t) \cr & \qquad -(\eta _{2,3} + a_{2,3}\delta h + \mu _{\rm h})R_{{\rm h}2,3}(t)}$$
where R h2,3′(t) is the derivative with respect to time of the cattle population that become resistant to both drugs 2 and 3, R h2,3(t); η 2,3 is the proportion of cattle population resistant to treatment with both drugs 2 and 3 that recovers naturally and a 2,3 is the proportion of AAT-induced cattle that die due to resistance to combination of drugs 2 and 3.
The withdrawn host sub-population is given by:
 $$\eqalign{{W}^{\prime}_{\rm h}(t) & = \eta _{\rm I}I_{\rm h}(t) + \eta _{\rm T}T_{\rm h}(t) + \eta _1R_{{\rm h}1}(t) + \eta _2R_{{\rm h}2}(t) \cr & \qquad + \eta_3R_{{\rm h3}}(t) + \eta _{1,2}R_{{\rm h1,2}}(t) + \eta _{1,3}R_{{\rm h}1,3}(t) \cr & \qquad + \eta_{2,3}R_{{\rm h}2,3}(t)-((\rho + \mu _{\rm h})W_{\rm h}(t))}$$
where W h′(t) is the derivative with respect to time of the cattle population that recover naturally or after treatment by trypanocides as already described.
The ordinary differential equations for the vector (tsetse fly) population are described below.
The susceptible vector sub-population is given by:
 $${S}^{\prime}_{\rm v}(t) = \lambda _{\rm v} - \displaystyle{{\beta _{\rm v}CI_{{\rm TR}}} \over {N_{\rm h}(t)S_{\rm v}(t)}}-\mu _{\rm v}S_{\rm v}(t)$$
where I TR = η II h(t) + η TT h(t) + η 1R h1(t) + η 2 R h2(t) + η 3 R h3(t) + η 12R h1,2(t) + η 1,3 R h1,3(t) + η 2,3 R h2,3(t); β v is the vector transmission rate while C is a coefficient of infection that satisfies 0 < C < 1 and I h(t) infectious host population at a given time, t. The other parameters have similar definitions to those of the host differential equations. S v′(t) is the derivative with respect to time of the susceptible tsetse population, S v(t); λ v is the combined birth rate and immigration of the vector population and μ v is the death rate of the susceptible tsetse fly population.
The exposed vector sub-population is given by:
 $${E}^{\prime}_{\rm v}(t) = {\rm} f_{\rm v}(t)S_{\rm v}(t)-\psi _{\rm v}E_{\rm v}(t)-\mu _{\rm v}E_{\rm v}(t)$$
where E v′(t) is the derivative with respect to time of the exposed vector population, E v(t); and ψ v is the rate at which the exposed tsetse fly population become infectious.
The infectious vector sub-population is given by:
 $${I}^{\prime}_{\rm v}(t) = \psi _{\rm v}E_{\rm v}(t)-\mu _{\rm v}I_{\rm v}(t)$$
where I v′(t) is the derivative with respect to time of the infectious vector population, I v(t).
Modelling appropriate use of trypanocides
First, to establish efficacious trypanocide regimens for a series of trypanosomiasis episodes in a disease endemic setting, where trypanosomes display varying resistance to different drug classes. We evaluated the ordinal use of three trypanocides from different classes, that is, changing drugs after each disease episode starting with drugs displaying the least resistance, and successively using another displaying more parasite resistance, and eventually a final one with the most resistance to trypanocides (increasing resistance order), or the reverse (decreasing resistance order) in the subsequent analysis. Next, we examined the optimal proportion of a disease-exposed population subject to chemotherapy that would not markedly increase drug resistance over time. Finally, to assess our intuition that combination therapy would be a significant improvement of monotherapy for AAT, we determine differences in resistance magnitudes for distinct regimens by comparing effect sizes. The treatment regimens compared are: a single-drug treatment vs another single-drug treatment, single-drug treatment vs combination therapy, or one combination therapy vs another combination therapy.
Differences in trypanocide resistance magnitudes between two treatment regimens is established using effect size (ES):
 $${\rm ES} = \displaystyle{{({\rm Mean} 2-{\rm Mean} 1)} \over {({\rm Standard\ deviation} 1)}}{\rm} $$
The larger the difference in effect size the greater the variance in resistance magnitude between the two treatment regimens.
The model was implemented in MATLAB version R2017a. Numerical simulations applied in this study are presented in the supplementary materials section (Supplementary Materials 2 and 3).
Results
The absence of evidence-based approaches on the appropriate trypanocide has in the past made it difficult to select the appropriate drugs for treatment of successive disease episodes. To establish the appropriate order in which trypanocides that already exhibit resistance should be used to ensure efficacy, in an endemic setting. We assessed changes in the total number of cattle with resistant trypanosome infection from each of the host (cattle) resistant compartments when using the increasing resistance order compared with decreasing resistance order treatment strategies (see Materials and methods). Our findings suggest that using drugs in decreasing resistance order results in a negligible increase in number of cattle with resistant infection, in contrast to a more pronounced increase from trypanocide use in increasing resistance order (Fig. 1). In both treatment strategies, using a combination of two trypanocides performs better than single-drug treatment.
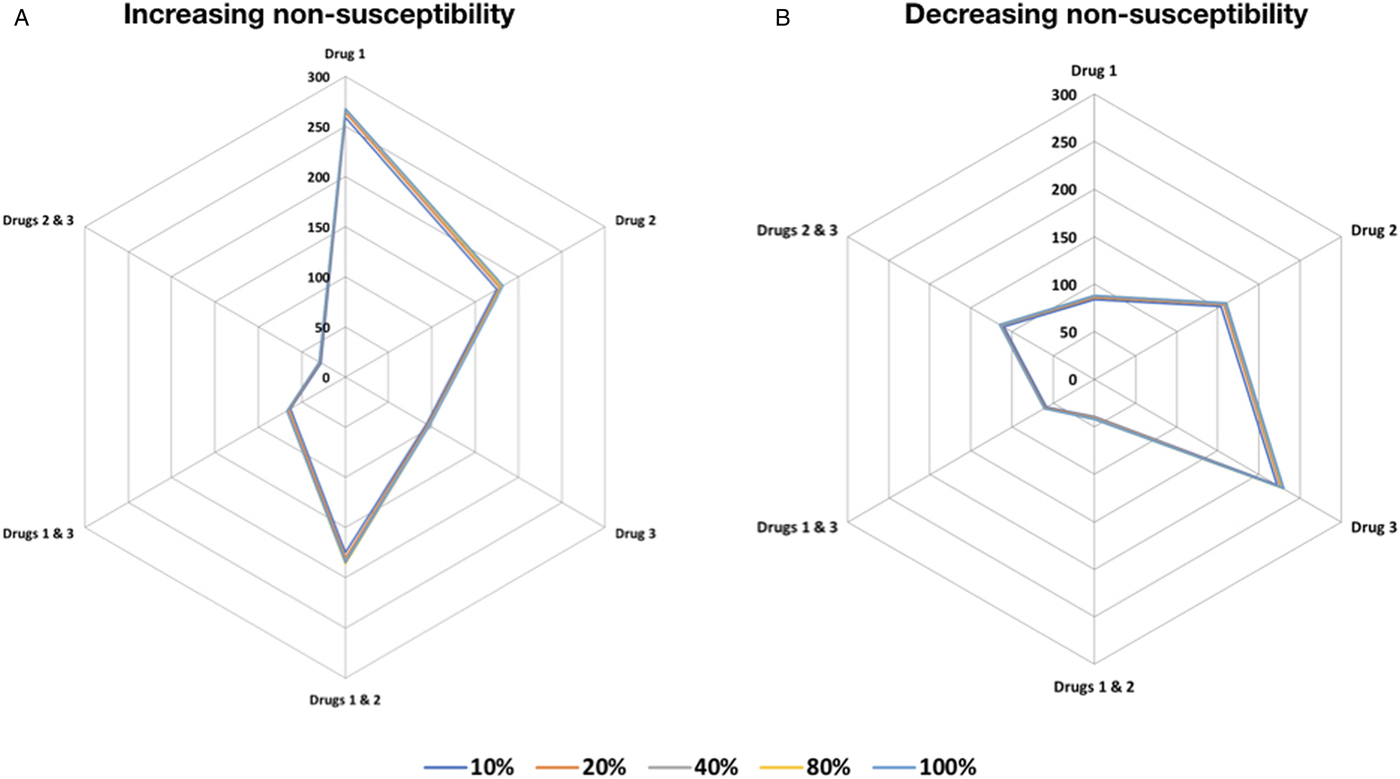
Fig. 1. Trypanocide use in increasing and decreasing resistance order. Trypanocide use in (A) increasing and the (B) decreasing resistance order. The use of drugs in decreasing resistance order results in a negligible increase in the absolute number of cattle with resistant infection in the different resistance compartments, in contrast to a more pronounced increase from trypanocide use in increasing resistance order. The series scale indicates the number cattle infected with resistant trypanosomes to the indicated trypanocide treatment (single or combination) compartment after 150 days. Treatment of 10, 20, 40, 80 and 100% of the cattle population was considered.
We determined the appropriate proportion of cattle to treat when there is a perceived trypanosome infection. Smallholder farmers commonly treat as many cattle as possible, if not all. It was unclear if this severely affects trypanocide resistance, or whether there were benefits that accrue from increasing the extent of the population treated. Our findings suggest that increasing the number of cattle treated leads to a progressive reduction in the number of cattle with drug resistant infections for treatments of up to 80% of the cattle population for the combination treatment strategy. Increasing the proportion from 80 to 100% leads to a reduction in the effect size, showing an increment of the number of cattle with resistant infection (Supplementary Table S2).
We compared performance of single trypanocide and combination therapy regimens, by examining the differences in effect size for these different treatment strategies. Our findings suggest the lowest levels of trypanocide resistance are achieved with combination therapy (Fig. 2). Combination therapy with drugs 2 and 3 is the most effective treatment regimen, and presents the least trypanosome resistance levels (Fig. 2 and Supplementary Table S2).
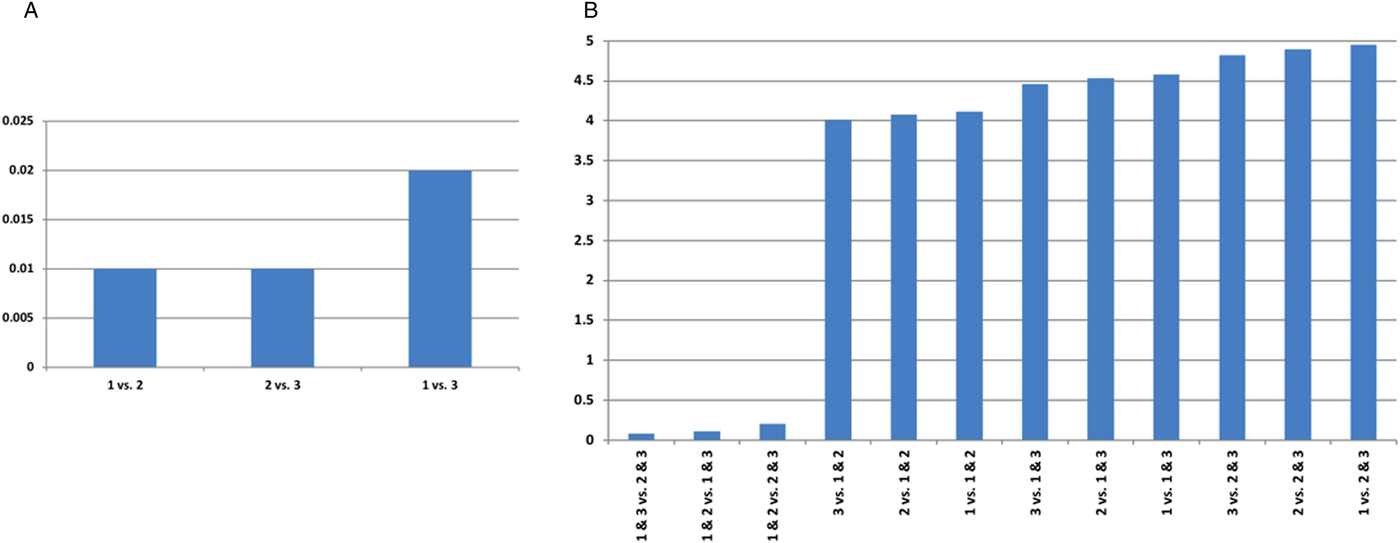
Fig. 2. The difference in effect size for trypanocide resistance. Eighty percent of cattle in an infected population are treated, for AAT point prevalence of 11%. (A) Single and (B) combination trypanocide therapy comparisons. A large value indicates more marked differences in resistance elicited when the two treatments are compared.
Discussion
AAT is mainly managed by chemotherapy, and this presents a trade-off between restoring animal health, and developing rapid widespread resistance to multiple trypanocides (Giordani et al., Reference Giordani, Morrison, Rowan, HP and Barrett2016). However, after developing trypanocide resistance, and consequently MDR, treatment is less likely to be successful. Drug resistance could be kept at manageable levels by optimal use of existing trypanocides. Efficacious regimens are therefore necessary to achieve the right balance. However, knowledge of best practices and rational use of trypanocides by smallholder farmers and veterinary practitioners is at best, still incomplete in the endemic resource poor settings of SSA. Our findings suggest thresholds at which treatment would be effective, optimal treatment strategies and regimens, which can avoid aggravating drug resistance.
In trypanosomiasis endemic locales, knowing the order in which to use available trypanocides with a range of parasite susceptibilities after recurrent disease episodes could help to minimize MDR development during treatment. We highlight that using drugs in decreasing resistance order results in a negligible increase in number of resistant infections. Cycles of trypanocide use in this order markedly decrease spread of resistant parasites. Progressive increase in fitness cost due to sequential accumulation of chromosomal mutations or acquisition of new genetic material by horizontal transfer, which are associated with development of resistance, restricts the number of resistant trypanosomes. Clonal expansion of susceptible trypanosomes with lower fitness cost that are able to out-compete the resistant parasites following a drug change, eventually results in the reversal of resistance to drugs that were in long use (Laufer et al., Reference Laufer, Takala-Harrison, Dzinjalamala, Stine, Taylor and Plowe2010). The use of the sanative pair, that is the alternate use of two trypanocides that are chemically unrelated, and therefore unlikely to cause cross-resistance, has been proposed as an effective strategy for controlling resistant infections (Geerts et al., Reference Geerts, Holmes, Eisler and Diall2001). However, in Nigeria widespread resistance of T. congolense to homidium compounds prompted a change to diminazene aceturate. After 2 years, this resulted in emergence of diminazene aceturate resistance in T. vivax, which was still uniformly susceptible to treatment with homidium compounds unlike T. congolense. Thus, a more effective control strategy adopted as policy was homidium or diminazene aceturate use for control in areas where either T. vivax or T. congolense had the predominant prevalence respectively (FAO, 1987). This strategy was more effective in that endemic region than the Whiteside's sanative pair system. In the absence of new trypanocides, endemic regions would greatly benefit from similar treatment strategies, which prolong disease management with available drugs.
Despite the importance of diagnostics prior to AAT treatment, smallholder farmers in resource poor settings often administer trypanocides by intuition to treat most, if not all cattle in the exposed population. Uninfected cattle may benefit from this prophylactic treatment before exposure, especially if entering tsetse-infected common grazing fields. Although effective in reducing parasitaemia levels, trypanocides are toxic and have a prolonged excretion duration (Mdachi et al., Reference Mdachi, Murilla, Omukuba and Cagnolati1995; Murilla et al., Reference Murilla, Mdachi, Ismail and Karanja1996). Treatment without diagnosis exposes animals to unnecessary adverse side-effects, elevates the risk of consuming contaminated animal products, and drives development of trypanosome resistance in vivo. The appropriate number of cattle to treat for optimal disease management in an exposed population, and whether there are benefits accruing from increasing the number treated was unclear. Our findings show a progressive reduction in the number of cattle with drug resistant infections for treatments of up to 80% of the cattle population for the combination treatment strategy. We highlight the differences in effect size when two treatment regimens are compared. The larger the effect, the greater the difference in magnitude of resistance between the regimens. Single-drug treatment generally results in a higher magnitude of resistance compared with combination therapy. This could be attributed to additive or synergistic effects of combination therapy regimens compared with single-drug treatments (Kohanski et al., Reference Kohanski, Dwyer and Collins2010). Combination therapy is used to treat human African trypanosomiasis (HAT), and has resulted in lower trypanocide doses, decreasing toxicity and improving effectiveness (Pepin, Reference Pepin2007; Priotto et al., Reference Priotto, Kasparian, Ngouama, Ghorashian, Arnold, Ghabri and Karunakara2007). Clinical trials of HAT show that combination therapy averts or delays the emergence of trypanosome non-susceptibility (Priotto et al., Reference Priotto, Kasparian, Ngouama, Ghorashian, Arnold, Ghabri and Karunakara2007). Artemisinin-based combination treatments have also been adopted as first-line treatment of falciparum malaria in most malaria endemic countries. Artemisinin-based combination therapy, which consists of treatment with antiprotozoal drugs from different classes, has displayed high efficacy, fast action and reduced the likelihood of rapid widespread resistance (Nosten and White, Reference Nosten and White2007).
Single-drug use is customarily used for AAT management, but there's renewed interest in development of novel biocompatible formulations that improve therapeutic outcomes (Kroubi et al., Reference Kroubi, Karembe and Betbeder2011; Giordani et al., Reference Giordani, Morrison, Rowan, HP and Barrett2016). Randomized clinical trials are necessary to evaluate the benefits and adverse effects attributable to these novel treatments. The combination of drugs with the least resistance imposes a huge fitness cost to trypanosomes and reduces viability (FAO, 1998b). This lowers parasitaemia levels allowing elimination by the host's immune response. Since infections typically consist of multiple parasites with a wide spectrum of drug resistance. Trypanosomes with a high fitness cost are likely to be outcompeted by susceptible ones in the absence of the imposing trypanocides, and might require compensatory mutations that increase their fitness to the level of the more susceptible trypanosomes (Laufer et al., Reference Laufer, Takala-Harrison, Dzinjalamala, Stine, Taylor and Plowe2010; Vaumourin et al., Reference Vaumourin, Vourc'h, Gasqui and Vayssier-Taussat2015). Our findings provide an initial evidence-based framework on some essential practices that may enhance the use of the handful of trypanocides available. The following limitations should be considered when interpreting our results. We considered a simplified scenario where we did not separately model curative or prophylactic treatment, and our deterministic model was primarily focused on therapeutic use. Our model also did not consider trypanocide resistance without a history of drug exposure.
Conclusions
We address the current crucial requirement for appropriate drug regimens that impede resistance development. These modest forecasts improve therapeutic outcomes by appropriately informing on the best choice, and combination of drugs that minimize treatment failure rates. We infer that cycling trypanocides from three different classes in decreasing order of resistance, treating up to 80% of an exposed population, and combining drugs with the least resistance provide optimal regimen options. We envisage that these implementing practices will diminish the spread of resistant trypanosomes in endemic regions.
Supplementary material
The supplementary material for this article can be found at https://doi.org/10.1017/S0031182018002093.
Data
The data and materials used to perform this study are available in the main text and the supplementary material section.
Author ORCIDs
Benard W. Kulohoma, 0000-0001-6825-1832.
Acknowledgements
We would like to thank all the smallholder farmers and veterinary healthcare workers who contributed the data that enabled this study, Abraham Parwos, Caroline Karicho, Rosemary Muindi, Anne Owiti, Edwin Rono, Dr George Obiero, and support from the University of Nairobi's Centre for Biotechnology and Bioinformatics and ICIPE.
Author contributions
BWK conceived the study. IW, SW, CM, NM, LW and BWK collected data. IW and BWK performed the analysis. IW and BWK wrote the first draft. IW, SW, CM, NM, LW and BWK contributed to the final draft. All authors read and approved the final version of the manuscript.
Financial support
This work was supported by the Regional Universities Forum for Capacity Building in Agriculture (RUFORUM) grant award RU 2014 GRG-086 to BWK.
Conflict of interest
None.
Ethical standards
This study was based primarily on secondary data collected on animal health. Written informed consent was given prior to participation interviews and data collection by small holder farmers. The University of Nairobi Ethical Research Committee approved surveillance procedures and instruments.
Consent for publication
The authors have all seen and approved the manuscript, and have taken due care to ensure the integrity of the work.


