


INTRODUCTION
The distribution of benthic meiofauna in seemingly homogeneous sediments has been recognized as ‘almost chaotic or certainly unpredictable’ (Fleeger & Decho, Reference Fleeger and Decho1987). The absence of directional movements triggered by chemical or physical gradients results in unpredictable and stochastic distribution patterns with important implications for population dynamics (Byers, Reference Byers2001). For instance, organism aggregations, which may result primarily from the patchiness of food sources, may confer diminished predation risks (Moody et al., Reference Moody, Houston and McNamara1996; Hines et al., Reference Hines, Long, Terwin and Thrush2009). Understanding the scales and patterns of aggregations is essential to comprehend trophic links, inter-specific interactions and other biological and environmental processes governing communities; particularly in organisms not readily observable in their environment, such as the microscopic meiofauna of sandy beaches, often dominated by free-living marine nematodes (Moens et al., Reference Moens, Van Gansbeke and Vincx1999; Sandulli & Pinckney, Reference Sandulli and Pinckney1999; Somerfield et al., Reference Somerfield, Dashfield and Warwick2007; Gallucci et al., Reference Gallucci, Moens, Vanreusel and Fonseca2008).
Hydrodynamic and biological processes determine the structure and spatial scale of aggregation patterns of meiofaunal communities. The microscopic size of nematodes limits the radius of active displacement resulting in competitive interactions and resource partitioning at a scale of 10−3 to 10−2 m (Findlay, Reference Findlay1981; Moens et al., Reference Moens, Van Gansbeke and Vincx1999). On the other hand, passive transport in the bed load and water column may lead to dispersal at a scale of 10 to 102 m (Palmer, Reference Palmer1988; Depatra & Levin, Reference Depatra and Levin1989; Sun & Fleeger, Reference Sun and Fleeger1994). Small scale (≤1 m) meiofaunal aggregations have been found in semi-exposed tidal flats (Findlay, Reference Findlay1981; Blanchard, Reference Blanchard1990; Somerfield et al., Reference Somerfield, Dashfield and Warwick2007), and shallow open-coast environments (Hogue, Reference Hogue1982), with biological similarity decreasing with increasing distance (Hogue, Reference Hogue1982; Somerfield et al., Reference Somerfield, Dashfield and Warwick2007). On the other hand, in a high-energy sandy beach in Australia, distant samples (1000 m apart) were more similar than those found closer (200 m), due to strong hydrodynamic forces constantly redistributing the intertidal fauna (Nicholas & Hodda, Reference Nicholas and Hodda1999). In open-coast environments, seasonal changes in energy regimes result in different aggregation patterns, with nematodes being randomly distributed during the stormy winter season, and more intensely aggregated during the calmer summer (Hogue, Reference Hogue1982).
Prevalent hydrodynamic regimes are crucial for meiobenthic distributional patterns, and may vary between and within sites. Contrasting energy conditions can be found in intermediate ridge-and-runnel macrotidal beaches (sensu Masselink & Short, Reference Masselink and Short1993) due to their heterogeneous topography. Sandbars exposed during low tide are covered with seawater during the incoming tide, resulting in constant sediment reworking and re-suspension at the marginal and superficial layers. They are massive (10 m to 102 m), stationary over time scales of 2 (Anthony et al., Reference Anthony, Levoy, Monfort and Degryse-Kulkarni2005) to 17 months (King, Reference King1972), and thus function as wave barriers for cross-shore tidal currents, protecting intervening runnels. By contrast, the embedded intertidal runnels are subject to constant, but calmer incoming or outgoing water flow along their main axis. They accumulate detritus, algae and organic matter and are sometimes partially covered by algal mats (R. Gingold, personal observation), which may induce superficial sediment cohesion and stabilization (Paterson, Reference Paterson1989; Sutherland et al., Reference Sutherland, Grant and Amos1998). These two contrasting micro-habitats have a strong influence on the nematofaunal community structure (Gingold et al., Reference Gingold, Mundo-Ocampo, Holovachov and Rocha-Olivares2010).
Given the influence of environmental differences of sandbars and runnels on the inhabiting community, we hypothesize that they also induce different spatial aggregation patterns. We expect that constant sediment suspension of sandbars leads to passive transport and a more homogeneous distribution of meiobenthic organisms, whereas the less energetic runnel environment allows active swimming and settlement and thus smaller-scale aggregations leading to higher patchiness. Assessing the spatial variation of benthic communities in the absence of environmental gradients is essential to our understanding of ecological patterns and processes and has strong implications for choosing the spatial scale of observations (i.e. sampling design). This is even more relevant in contrasting micro-habitats, as they may differ in their scale of spatial variation (Phillips & Fleeger, Reference Phillips and Fleeger1985). The present study addresses the need for information about variability of benthic communities in seemingly homogeneous environments (Fleeger & Decho, Reference Fleeger and Decho1987) by comparing the extent of spatial variation of nematofaunal communities from contrasting sandy beach intertidal micro-habitats.
MATERIALS AND METHODS
Study site and sampling design
El Tornillal beach (31°33′N 114°17′W; Figure 1) is located in the northern Gulf of California within the Biosphere Reserve of the Upper Gulf of California and Colorado River Delta. It is far from direct urban sewage outfalls, industrial and agricultural runoff, and touristic activities. The closest village is Santa Clara, 25 km north. The intertidal zone at this beach is more than 600 m wide and the tidal range reaches 7 m during spring tides (own unpublished data). Within the intertidal zone, runnels and sandbars are oriented almost parallel to the water line. Sea surface temperatures for the sampling period (summer) are 30–32°C. In winter, they range from 16–18°C (2007) (Lluch-Cota et al., Reference Lluch-Cota, Aragon-Noriega, Arreguin-Sanchez, Aurioles-Gamboa, Bautista-Romero, Brusca, Cervantes-Duarte, Cortes-Altamirano, Del-Monte-Luna, Esquivel-Herrera, Fernandez, Hendrickx, Hernandez-Vazquez, Herrera-Cervantes, Kahru, Lavin, Lluch-Belda, Lluch-Cota, Lopez-Martinez, Marinone, Nevarez-Martinez, Ortega-Garcia, Palacios-Castro, Pares-Sierra, Ponce-Diaz, Ramirez-Rodriguez, Salinas-Zavala, Schwartzlose and Sierra-Beltran2007).

Fig. 1. Location of the El Tornillal beach, on the east coast of the Upper Gulf of California, Sonora State, Mexico.
Sampling took place 17 August 2008 during low spring tide. Five sampling stations were placed along two transects (ten stations in total) parallel to the shore. Each transect was placed in a different micro-habitat (runnel and sandbar), approximately 250 m away from the other (Figure 2). One sampling station was placed at the reference line (0 m), further stations were placed along each of the two transects at fixed distances from the reference line: 10, 20, 40 and 80 m. At each sampling station, three replicate sediment cores were taken at random within a square metre area using a PVC corer (core size: 9.8 cm long by 2.9 cm internal diameter). The full length of the core was inserted in the sand and dug out as gently and carefully as possible to avoid excessive disturbance of the infaunal community. The entire unsliced sediment core was immediately fixed in 5% formaldehyde for posterior faunal analyses. Transects were placed in the middle beach zone, which has been shown to host a distinct community from the lower and higher intertidal at <18.3% Bray–Curtis similarity level (Gingold et al., Reference Gingold, Mundo-Ocampo, Holovachov and Rocha-Olivares2010).
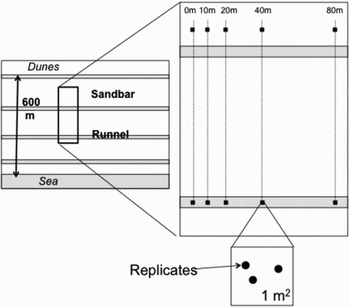
Fig. 2. Sampling design. Three replicate samples were taken within a square metre at predefined distances from the reference line (0 m): 10, 20, 40 and 80 m, along a transect in a sandbar and a runnel.
Faunal analyses
In the laboratory, formalin was rinsed off sediment samples with freshwater over a 45 µm mesh size sieve. Meiofauna was extracted by suspension in colloidal silica (LUDOXTM, specific density 1.15) following De Jonge & Bouwman (Reference De Jonge and Bouwman1977) and stored in 80 ml 5% formalin. Nematodes were counted in three aliquots of 5 ml under a Leica Zoom 2000 stereoscope, transferred to a 5% glycerol solution and slowly evaporated on a heating plate. We randomly picked 50 nematodes for identification with the help of a gridded dish and pseudo-random numbers generated in a spreadsheet. These organisms were mounted on permanent slides and identified with an Olympus BX51 compound microscope with differential interference contrast (DIC) optics. Where possible, nematodes were identified to generic level, using pictorial (Platt & Warwick, Reference Platt and Warwick1983, Reference Platt and Warwick1988; Warwick et al., Reference Warwick, Platt and Somerfield1998) and online (http://nemamex.ucr.edu) taxonomic keys. Juveniles and females lacking unequivocal male counterparts were identified to family level and included as such in statistical analyses. If more than one species could be distinguished among congeners, they were labelled sp. 1, sp. 2, and treated separately in statistical analyses.
Data analyses
To visualize the faunal spatial structure across all distances in the two micro-habitats, non-metric multidimensional scaling (MDS) was constructed from the similarity matrix based on the Bray–Curtis index of untransformed data (Clarke & Warwick, Reference Clarke and Warwick1994). To test differences in community composition between predefined groups (i.e. replicates of sampling stations at different distances), analyses of similarities (ANOSIMs) were applied to multivariate data. Analyses of variance (ANOVAs) were used to assess variability of abundance and diversity within and between replicates of the different sampling stations (i.e. distances). Diversity was estimated as genus richness (S), Shannon–Wiener index of diversity (H′), and Hurlbert's expected number of species (E(S30)), which is less dependent on sample size (Hurlbert, Reference Hurlbert1971). Data normality was verified with the Kolmogorov–Smirnov test and homoscedasticy with Bartlett's test (Sokal & Rohlf, Reference Sokal and Rohlf1995). If assumptions could not be met, variables were log-transformed.
Similarities between locations were assessed with similarity percentage analyses (SIMPERs). Mantel tests were used to test hypotheses that assemblage similarities between samples taken at a given distance were different from similarities between samples at any other distance. We correlated the biotic similarity matrix with: (a) the matrix of absolute distances between samples; and (b) model matrices where the distance of interest was coded as 1 and all other distances as 0. Since there is no a priori assumption about the relationship of similarities with respect to distance (i.e. similarities may increase or decrease with increasing distance), two-tailed tests were applied with significance values of P < 0.025 and P > 0.975.
SIMPER also determined which genera were characteristic of a given assemblage in a given habitat. For these differentiating genera, we calculated the dispersol index (D = variance/mean) and the sample-size independent Green's index (C x = (variance/mean)–1/(n–1)) (Elliot, Reference Elliot1971), to evaluate whether they were randomly distributed (D = 1 or C x = 0), spatially clumped (D > 1 or C x > 0, over-dispersed), or regularly distributed (D < 1 or C x < 0, homogeneous distribution). Deviations from the random distribution were calculated by exact permutation tests for D (Clarke et al., Reference Clarke, Chapman, Somerfield and Needham2006). Given the two-tailed test, α was set at 0.025 for significant overdispersion and 0.975 for significant underdispersion. Significant overdispersion of C x was computed from its upper value under a null random distribution C x,(1-α) = (χ2(1-α)/(n–1))–1/(n mean–1); where χ2 has n–1 df (Green, Reference Green1966).
PRIMER version 6 (Clarke & Gorley, Reference Clarke and Gorley2006) was used for multivariate analyses. STATISTICA (Statsoft, 1993) was used for univariate analyses.
RESULTS
Nematodes sampled in different micro-habitats
The nematode communities from the runnel and the sandbar were significantly different (ANOSIM R = 0.719, P = 0.001). Sandbar samples were more similar to each other than runnel samples, as indicated by their tighter clustering in the MDS plot (Figure 3). On the other hand, no clear pattern could be discerned in biotic similarity among samples at different distances within each micro-habitat (Figure 3). Due to the clear biological difference, further analyses were conducted separately on each micro-habitat.

Fig. 3. Non-metric multidimensional scaling of community structure of the sandbar (open triangles) and the runnel (black triangles). Numbers indicate distances (10, 20, 40 and 80 m) at which replicates were taken with respect to the reference line (0 m).
Nematodes sampled at different distances
There was no significant difference in community structure (ANOSIM), or in species richness, diversity and abundance (ANOVA) among stations at spatial scales >1 m in both micro-habitats (Table 1). This indicates that the variance of these variables is higher at the replication scale of ≤1 m2.
Table 1. Tests of spatial homogeneity in nematode communities from intertidal sandbar and runnel (H 0: μ 1 = μ 10 = μ 20 = μ 40 = μ 80, where μ i is the mean value of the variable at distance i).
1Test statistic refers to R (ANOSIM) for ‘community structure’ and F (ANOVA) for the other variables.
However, there are some important differences in distribution patterns between micro-habitats. Sandbars possessed a more homogeneous nematode community, as revealed by the MDS plot (Figure 3) and by a higher average similarity among all replicates (sandbar: 50.10; runnel: 44.63). Also, maximum similarity among replicates was higher in the sandbar (boldface in Table 2, ‘within station’). Congruently, it was in the sandbar where the most similar stations were the more distant from each other, i.e. at the reference line and at 80 m, whereas in the runnel they were the closest, i.e. at the reference line and at 10 m (Table 2, ‘between stations’). These patterns indicate a patchier distribution in the runnel.
Table 2. Biotic similarity of nematode assemblages within and between stations. Similarity within stations is the similarity among three replicate samples taken within one square metre. Similarity between stations is evaluated by comparing samples taken at fixed distances (10, 20, 40 and 80 m) from the reference samples. Highest values are in boldface (see Results for details).
Correlations between biotic similarity matrices of nematode assemblages and matrices of physical distance between station pairs are consistent with the previous results. Similarity between assemblages decreased significantly with increasing distance in the runnel, whereas the opposite occurs in the sandbar, although not significantly so (Table 3). Nematodes sampled 10 m apart in the runnel were significantly more similar than those separated by any other distance (Table 3), whereas in the sandbar, samples 80 m apart were significantly more similar than those separated by any other distance.
Table 3. Matrix correlations between biotic similarity of nematode samples and physical distance between station pairs. Boldface values indicate statistically significant results.

1Spearman's rank correlation coefficient.
2Significance level estimated from 999 permutations. Two-tailed test requires P to be <0.025 when samples are significantly more similar (i.e. positive correlation) and >0.975 when samples are significantly more different (i.e. negative correlation) relative to samples at any other distance.
3‘True distances’ refer to a matrix of physical metric distances between station pairs, whereas the rest represent model matrices in which the distance of interest is coded as 1 and the others coded as 0.
41 m scale refers to within 1 m2 distances among replicates within a station.
Genus specific dispersal
The number of genera found in both micro-habitats was very similar (electronic supplemental information: sandbar: 66; runnel: 62). However, more genera contributed to the 90% cumulative similarity of the runnel, which indicates higher evenness. Twice the number of genera accounted for 50% of the cumulative similarity in the runnel than in the sandbar (Table 4). Applying C x, considerably more genera were over-dispersed in the runnel (19% (12/62) of all taxa or 26% (12/47) of taxa with N ≥ 2) than in the sandbar (11% (7/66) of all taxa or 15% (7/47) of taxa with N ≥ 2). Over-dispersed taxa in the runnel were Chromadorita, Daptonema, Elzalia, Perepsilonema, Metachromadora, Odontophora, Pomponema, Spirinia, Tricoma, Xyala sp. 1 and sp. 2, and Xyalidae gen. 1, which accounted for 63% (474/750) of nematodes in the runnel. In the sandbar, Chromaspirinia, Desmodora sp. 1, Perepsilonema, Microlaimus, Spirinia, Xyala sp. 1, and Xyalidae gen. 1 showed significantly contagious distributions and accounted for 58% (432/750) of nematodes in the sandbar. Considering only the typical (i.e. top 90%) genera, the contrast between environments becomes more evident: 59% (10/17) over-dispersed genera in the runnel and 36% (4/11) in the sandbar. Among typical genera, Rhynchonema and Microlaimus showed significant under-dispersion in the runnel, and Metachromadora in the sandbar (Table 4; see electronic supplemental material). The sample size-dependent dispersion index (D) also revealed a higher degree of patchiness in runnels but fewer significantly over-dispersed taxa overall (7 in runnel and 4 in sandbar). The fact that more taxa and nematodes are over-dispersed in runnels underlines the higher patchiness in this micro-habitat.
Table 4. Typical genera (up to 90% cumulative similarity (Cum.%)) of both the sandbar and runnel micro-habitat, Green's index (C x) and dispersal index (D).

Significantly (α = 0.05) over-dispersed (*1) or under-dispersed (*2); non-significant values refer to random distributions (see text for details).
DISCUSSION
In the absence of physical or chemical gradients, the distribution of meiofauna in sandy environments has been thought to be highly probabilistic and unpredictable (Fleeger & Decho, Reference Fleeger and Decho1987). In this study, we determined the scale at which free-living marine nematodes form aggregations (i.e. ‘patchiness’) in two micro-habitats (runnels and sandbars) with contrasting hydrodynamic regimes at scales from one metre to tens of metres. We tested the influence of micro-habitats in the spatial patterns of the nematode community at scales commonly used in benthic surveys, which is a topic widely neglected in the literature.
Our findings indicate that scales of long-shore variability vary between micro-habitats likely in response to differences in hydrodynamic regimes. Previous work on the community structure of intertidal nematodes at El Tornillal allowed us to discard the influence of grain size as the driver of differences between runnels and sandbars (Gingold et al., Reference Gingold, Mundo-Ocampo, Holovachov and Rocha-Olivares2010). As expected, the runnel community exhibits a higher degree of patchiness. This is the result of spatially restricted, presumably active displacement of the single organisms resulting in small-scale aggregations and clumped distributions. Experiments have shown that free-living marine nematodes can actively select where to settle when descending from the water column and actively migrate towards their preferred food source (Jensen, Reference Jensen1981; Ullberg & Olafsson, Reference Ullberg and Olafsson2003). In addition, individuals may burrow deeper into the sediment as a strategy to avoid being transported passively by the constant alongshore water flow. Nematodes react to increased current speeds of approximately 25 cm s−1 20 cm above the sediment by burrowing deeper into the sediment (Fegley, Reference Fegley1987). At El Tornillal, current speeds in the runnels at low tide (which was the time of sampling) are ~5–10 cm s−1 (unpublished data), which may allow them to aggregate even in superficial layers. Since runnels are a resource rich micro-habitat (Gingold et al., Reference Gingold, Mundo-Ocampo, Holovachov and Rocha-Olivares2010), nematodes are likely to remain around food patches, limiting unnecessary active dispersal saving on energy expenditure as well as decreasing the risk of predation (Depatra & Levin, Reference Depatra and Levin1989; Coull, Reference Coull1990). A calm environment abundant in patchy resources is conducive to small-scale displacement, resulting in contagious or over-dispersed spatial distributions at a scale of a few metres or less.
In the sandbar, on the other hand, passive transport is unavoidable when superficial and deeper sediments are re-suspended (Armonies, Reference Armonies1994; Commito & Tita, Reference Commito and Tita2002). Cross-shore currents on top of sandbars are ≥25 cm.s−1 (10 cm above ground, unpublished data), therefore incoming tides re-suspend sediments deeper than in the sheltered runnels. In addition, food (i.e. organic matter and microbenthic algae) is scarcer in sandbars (Gingold et al., Reference Gingold, Mundo-Ocampo, Holovachov and Rocha-Olivares2010). Meiobenthic copepods have been found to actively swim and ingest planktonic diatoms when they are covered with water, switching to benthic microalgae when there is no water cover (Decho, Reference Decho1986). Nematodes are thought to be rather poor swimmers, but passive transport may enhance the probability of reaching new food patches. They may actively choose where to settle after being suspended in the water column (Ullberg & Olafsson, Reference Ullberg and Olafsson2003) and are attracted to resource rich sediment patches (Gallucci et al., Reference Gallucci, Moens, Vanreusel and Fonseca2008). The prevalence of passive dispersal in sandbars is reflected in either random or more homogeneous spatial distributions of nematodes in comparison to the runnel and in the higher similarity of widely separated assemblages.
Our results partly indicate that herbivorous species are more prone to passive transport. According to Wieser's (Reference Wieser1953) classification, trophic group 2A nematodes (epistratum feeders) exhibit mainly herbivory as a feeding strategy, but herbivory has also been demonstrated in unselective deposit feeders, group 1B (Nehring et al., Reference Nehring, Jensen and Lorenzen1990; Moens & Vincx, Reference Moens and Vincx1997). Herbivorous species are rather passively transported, as they need to reside close to the surface to feed (Warwick & Gee, Reference Warwick and Gee1984; Commito & Tita, Reference Commito and Tita2002). Metachromadora, mainly feeding on microphytobenthos and residing very close to the surface (Warwick & Gee, Reference Warwick and Gee1984; Moens et al., Reference Moens, Bouillon and Gallucci2005), was under-dispersed in the more dynamic (sandbar) and over-dispersed in the calmer (runnel) habitat. It is thus likely that under hydrodynamic harsh conditions prevalent in the sandbar, Metachromadora would be passively transported and homogeneously distributed; by contrast, the relatively calm conditions in the runnel may allow the formation of aggregations around algal patches. Probably in response to the same hydrodynamic forcing, genera of the functional group 1B (Daptonema, Elzalia, Xyala and Xyalidae gen. 1), which potentially exhibit herbivory at least as a partial feeding strategy, were over-dispersed in the runnel. Of the latter, Xyala sp. 1 and Xyalidae gen. 1 were also over-dispersed in the sandbar. However, other herbivorous genera did not follow the same pattern: Desmodora, Microlaimus and Spirinia (all trophic group 2A) were over-dispersed in the sandbar and it is not clear why passive transport would not affect them in the same way.
Perepsilonema was over-dispersed in both habitats, and this may be related to its small size, characteristic of the family Epsilonematidae. Epsilonematids are very small nematodes (0.3–0.5 mm) shaped as the Greek letter epsilon (Warwick et al., Reference Warwick, Platt and Somerfield1998) and have a strong tendency towards clumped distributions (Somerfield et al., Reference Somerfield, Dashfield and Warwick2007), which is consistent with Perepsilonema being over-dispersed in both micro-habitats. Previous studies suggest that mainly small nematodes move and settle actively (Ullberg & Olafsson, Reference Ullberg and Olafsson2003), whereas others indicate that not only small but also larger species tend to form aggregations (Gallucci et al., Reference Gallucci, Moens, Vanreusel and Fonseca2008). This was the case in our study, in which significantly aggregated distributions were not restricted to particularly small nematodes. Daptonema, Elzalia, Xyala sp. 1 and sp. 2 and Xyalidae gen. 1 (all in the family Xyalidae), range from 0.5 to 2 mm in size (Warwick et al., Reference Warwick, Platt and Somerfield1998). The same holds for Nannolaimoides (Cyatholaimidae), reaching 1.5 to 2 mm in size. Desmodora sp. 1, Metachromadora and Spirinia (all in the family Desmodoridae), can reach sizes of 1 to 4 mm (Platt & Warwick, Reference Platt and Warwick1988).
Some over-dispersed genera, but not all, possessed anatomical adaptations for locomotion and attachment to sediment grains. Attachment to sediment grains would prevent entrainment of nematodes in flow regimes incapable of sediment re-suspension. In more energetic environments, attachment to sand grains would provide faster settlement rates at shorter dispersal distances after re-suspension, relative to unattached nematodes. Perepsilonema exhibits aberrant positions of glandular outlets, attributed to their aberrant locomotion patterns (Raes et al., Reference Raes, Decraemer and Vanreusel2006). Caudal glands are a plesiomorphic character present in almost all aquatic nematodes, and play a fundamental role in active locomotion (Adams & Tyler, Reference Adams and Tyler1980; Turpeenniemi & Hyvarinen, Reference Turpeenniemi and Hyvarinen1996; Raes et al., Reference Raes, Decraemer and Vanreusel2006). Possibly the position of glandular structures and the presence of ambulatory setae in some genera (Platt & Warwick, Reference Platt and Warwick1988; Raes et al., Reference Raes, Vanreusel and Decraemer2003) make epsilonematids particularly good competitors adhering to sediments around food patches. Among the other over-dispersed genera, the (most likely new) species of Spirinia in our samples exhibited conspicuous large somatic setae, similar to Spirinia gerlachi (Luc & De Coninck, Reference Luc and De Coninck1959) or S. gnaigeri (Ott, Reference Ott1977). Such setae or tubes are thought to have an adhesive function in other nematodes (Decraemer et al., Reference Decraemer, Gourbault and Backeljau1997), which opens the possibility that in Spirinia they function as anchors between sediment grains. Although Perepsilonema and Spirinia exhibit anatomical characters clearly relatable to active displacement favouring aggregations, nothing similar was detected in the other over-dispersed genera. The latter may exhibit less conspicuous adaptations facilitating active locomotion and/or adhesion to sediments.
Our results show that along-shore spatial distribution patterns differ in nearby micro-habitats exhibiting distinct hydrodynamic regimes and beg the need for detailed studies to unravel the underlying physical and biological processes. Additional replicate observations from runnel- and ridge-transects will greatly help to establish the generality of these patterns. Nevertheless, our results have important implications for sampling designs addressing cross-shore variability. Although this is a critical issue, very few authors justify the distance among stations in their sampling designs. Station separation along transects has been set to <1 m (Moreno et al., Reference Moreno, Ferrero, Granelli, Marin, Albertelli and Fabiano2006; Gingold et al., Reference Gingold, Mundo-Ocampo, Holovachov and Rocha-Olivares2010), 5 m (Gheskiere et al., Reference Gheskiere, Hoste, Vanaverbeke, Vincx and Degraer2004), 10 m (Mundo-Ocampo et al., Reference Mundo-Ocampo, Lambshead, Debenham, King, De Ley, Baldwin, De Ley, Rocha-Olivares, Waumann, Thomas, Packer and Boucher2007) or >20 m (Gheskiere et al., Reference Gheskiere, Vincx, Urban-Malinga, Rossano, Scapini and Degraer2005) without a clear rationale. Extrapolations from small sampling grids to wider areas (e.g. whole beaches) should be addressed with caution. We therefore suggest pilot studies evaluating the spatial patterns of the community under study, prior to final sampling, as this may help greatly in understanding the main underlying processes and further interpretation of the data.
ACKNOWLEDGEMENTS
We are very grateful to Luis Gustavo Alvarez who was instrumental in measuring current velocities and to Renato Salvatteci for his valuable help in the field. We are thankful to Paul de Ley, Ian King and Sharon Herzka for constructive comments and discussions on sampling design that motivated this study. Tom Moens and two anonymous referees are greatly acknowledged for their constructive and critical review of the manuscript. Many thanks to Ron Abileah for his linguistic help. This research was funded by the grant CONACYT-SEMARNAT-2004-C01-300 to A.R.O. The paper is derived from the first author's PhD research at the Marine Ecology program at CICESE where she is supported by CONACYT. Samples were collected under permit No. DGOPA. 05335.100707.2458 (SAGARPA).


