Introduction
Agriculture in the 21st century faces multiple challenges, with a requirement to feed an ever-increasing population, produce food more efficiently and adapt to climate change (Godfray et al. Reference Godfray, Beddington, Crute, Haddad, Lawrence, Muir, Pretty, Robinson, Thomas and Toulmin2010). In temperate regions worldwide, grass-based livestock production systems can improve the efficiency and sustainability of agriculture through lower input costs (Shalloo et al. Reference Shalloo, Dillon, O'Loughlin, Rath and Wallace2004) and reduced environmental pressure (Bleken et al. Reference Bleken, Steinshamn and Hansen2005; Arsenault et al. Reference Arsenault, Tyedmers and Fredeen2009), when compared with confinement systems, thereby overcoming some of these challenges.
Perennial ryegrass (Lolium perenne L.: PRG) dominates temperate grass-based systems and provides high nutritive value feed for livestock while maintaining a high regrowth capacity and good grazing persistence (Wilkins & Humphreys Reference Wilkins and Humphreys2003). In grass-based systems, achieving high herbage dry matter (DM) production and high herbage nutritive value throughout an extended grazing season is important. Perennial ryegrass can maintain high herbage DM production in nitrogen (N)-fertilized grass-based systems: however, the nutritive value of grass-only (GO) swards declines as the grazing season progresses (Enriquez-Hidalgo et al. Reference Enriquez-Hidalgo, Gilliland and Hennessy2016). The inclusion of white clover (Trifolium repens L.: WC) in PRG swards can increase herbage growth rates (Frame & Newbould Reference Frame and Newbould1986), maintain a high nutritive value (Beever et al. Reference Beever, Dhanoa, Losada, Evans, Cammell and France1986) and improve animal intake (Ribeiro Filho et al. Reference Ribeiro Filho, Delagarde and Peyraud2005) throughout the grazing season (Frame & Newbould Reference Frame and Newbould1986; Ledgard & Steele Reference Ledgard and Steele1992). However, many studies suggest that WC in grass-clover (GC) swards does not persist under high N fertilizer levels and high stocking rates (Frame & Newbould Reference Frame and Newbould1986). At the fertilizer levels required to maintain high herbage DM production under intensive grazing, there is little information on the interaction between high N fertilizer use (>200 kg N/ha) and high stocking rates (>2.5 livestock units (LU)/ha) on WC persistence and plant morphology.
The rise of inorganic N fertilizer prices (Prince et al. Reference Prince, Apostolopoulou and Simonova2009) and increased environmental legislation may lead to an increase in the use of GC swards on-farm to provide N from biological N fixation (BNF), which can introduce an additional 100–300 kg N/ha/year, depending on soil type, inorganic N fertilizer and sward WC content (Carlsson & Huss-Danell Reference Carlsson and Huss-Danell2003; Lüscher et al. Reference Lüscher, Mueller-Harvey, Soussana, Rees and Peyraud2014). Studies examining the environmental impacts of combining high levels of N fertilizer and WC show that, at similar N inputs, GC swards can be more energy efficient than N-fertilized GO swards and that nutrient losses to ground water are similar for both sward types (Ledgard et al. Reference Ledgard, Schils, Eriksen and Luo2009).
Previous studies on WC inclusion in grass-based systems have concentrated on agronomic aspects (Frame & Newbould Reference Frame and Newbould1986; Baker & Williams Reference Baker and Williams1987), animal nutritional aspects (Thomson Reference Thomson and Thomson1984; Beever & Thorp Reference Beever, Thorp and Younie1996) and environmental aspects (Jarvis Reference Jarvis1992). Whole-farm grazing system studies have been undertaken (Humphreys et al. Reference Humphreys, Casey and Laidlaw2009; Enriquez-Hidalgo Reference Enriquez-Hidalgo2014; Egan et al. Reference Egan, Galvin and Hennessy2018); however, few have looked at the detailed sward level interaction between PRG and WC. This has left a knowledge gap on how to manage WC plants to withstand grazing system stresses (grazing and poaching damage) and identify the morphological characteristics that contribute to herbage growth and plant survival under high N fertilizer use (>200 kg N/ha) and high stocking rates (>2.5 LU/ha). The objective of the current study was to investigate herbage DM production, plant morphology, herbage nutritive value and N fixation rates of GO and GC swards, and tetraploid and diploid swards, over a full grazing season under these conditions, at a farmlet scale.
Materials and methods
Site
The study was conducted during the 2015 grazing season at Teagasc, Clonakilty Agricultural College, Co. Cork, Ireland (Latitude: 51°63′N; Longitude: −08°85′E; 25–70 m asl), on a free-draining acid brown earth soil of light loam to gley loam in texture.
Experimental design
The swards used were a component of a larger farm-systems study (43.6 ha) that commenced in 2014; 0.75 of the farm area was reseeded in 2012 and the remaining 0.25 was reseeded in 2013. The larger study consisted of four sward treatments: diploid-only (DO); tetraploid-only (TO); diploid-WC (DC); tetraploid-WC (TC). Four diploid cultivars (sown at 30 kg/ha) and four tetraploid cultivars (sown at 37.5 kg/ha) were sown as monocultures in five paddocks each around the farm. This was repeated using the same diploid and tetraploid cultivars and also included medium-leaved WC cultivars (0.50 Chieftain, 0.50 Crusader; sown at 5 kg/ha). This resulted in a total of 80 paddocks. Thus, 20 blocks (balanced for location, soil type and soil fertility) of four paddocks each were created and each treatment was assigned randomly to one of the four paddocks within each block. For the purpose of the current study, a sub-set of three of the 20 blocks were used, giving three experimental paddocks per grazing treatment (DO, TO, DC, TC). The blocks consisted of three tetraploid cultivars (Tymax, AstonEnergy, Kintyre) and two diploid cultivars (Glenveagh, Aberchoice).
Treatments were grazed rotationally ten and 11 times for GO and GC swards, respectively, in 2015 with 30 dairy cows per treatment (2.75 LU/ha). Daily herbage allowance was 17 kg DM/cow/day (>4 cm) and concentrate supplementation was 300 kg/cow/year. All sward treatments were managed similarly in terms of grazing management and average farm cover targets (O'Donovan Reference O'Donovan2000) using a decision support tool, PastureBase Ireland (Hanrahan et al. Reference Hanrahan, Geoghegan, O'Donovan, Griffith, Ruelle, Wallace and Shalloo2017), which produced a weekly grass wedge, a visual aid to assess herbage DM supply to facilitate management decisions on-farm. Grazing commenced between 4 February 2015 and 27 March 2015 for each of the study paddocks and ceased between 29 September and 16 November 2015. Target pre-grazing herbage mass was 1300–1600 kg DM/ha (>4 cm) and the target post-grazing sward height was ⩽4 cm for rotations 1–3 (February to end April) and 4 cm for the remainder of the study period. Rotation length targets in the May–July period were 18–21 days. All paddocks were mechanically harvested at least once during the previous year; however, study paddocks were grazed exclusively for the 2015 grazing season with no silage harvesting or mechanical topping of swards occurring. All paddocks received 250, 8, 47 kg/ha/year of N, phosphorus (P) and potassium (K), respectively (Table 1). Nitrogen application was in the form of urea (46% N) early in the grazing season (rotations 1 + 2; mid-January to March) and calcium ammonium nitrate (CAN; 27% N) was applied in subsequent rotations (April to mid-September). All sward treatments received 7.05 m3/ha of cattle slurry applied in spring and summer.
Table 1. Nitrogen (N), Phosphorus (P) and Potassium (K) application rates for the study paddocks in 2015

CAN1 = calcium ammonium nitrate (CAN; 27% N).
Herbage dry matter production, grazing efficiency and nutritive value
Pre-grazing herbage mass and sward density
Pre-grazing herbage mass was calculated prior to each grazing from two strips harvested in each paddock to 4 cm (1.2 m wide; 10 m long), as per Creighton et al. (Reference Creighton, Gilliland, Delaby, Kennedy, Boland and O'Donovan2012), using an Etesia mower (Etesia UK Ltd., Warwick, UK). Harvested herbage was collected and weighed, and a sub-sample collected for DM content determination. Dry matter content was calculated by drying a 100 g sub-sample in an oven at 90 °C for 15 h. To calculate sward density, ten sward height measurements were recorded along the cut area immediately pre-harvest and post-harvest using a Jenquip rising plate meter (Castle Reference Castle1976; Jenquip 2016). Sward density was calculated using these measurements according to the following equation:
 $$\eqalign{\hbox{Sward density} \, ({\rm kg }\,\, {\rm DM}/{\rm cm}) & = \hbox{herbage mass}/(\hbox{pre-cutting height} \cr & \qquad - \hbox{post-cutting height}).}$$
Herbage mass above 4 cm was calculated using sward density according to the following equation:
 $$\eqalign{&\hbox{Herbage mass above}\,\, 4\;\;{\rm cm}\; ({\rm kg} \,\,{\rm DM}/{\rm ha}) \cr & \quad = [\hbox{pre-grazing sward height} \,\, ({\rm cm}) - 4\;\,\, {\rm cm}] \times \hbox{sward density}.}$$
Pre-grazing and post-grazing sward heights (cm) were calculated by measuring compressed sward height at 50 locations within each paddock at each grazing using the plate meter described above.
Grazing efficiency
Grazing efficiency was calculated using the method of Delaby et al. (Reference Delaby, Peyraud, Bouttier and Peccatte1998) and McCarthy et al. (Reference McCarthy, Pierce, Delaby, Brennan, Fleming and Horan2013), whereby grazing efficiency = total herbage removed/pre-grazing herbage mass (>4 cm).
Total herbage removed (kg DM/ha) = (pre-grazing sward height (cm) – post-grazing sward height (cm)) × sward density.
Grazing efficiency is an estimation of how efficiently the sward was grazed relative to herbage removed from the sward and pre-grazing herbage mass available. A higher value indicates more herbage was removed relative to the herbage available (i.e. herbage mass >4 cm) for grazing.
Daily herbage growth rate (kg DM/ha/day) was calculated by dividing the herbage mass on a given measurement date by the number of days between that measurement date and the previous grazing date.
Herbage nutritive value
Herbage sub-samples, collected when measuring herbage mass at each grazing event, were freeze-dried and milled through a 1 mm sieve. Sub-samples were selected from each treatment and each cultivar within treatment at four time-points (February–March, mid-May to mid-June, mid-June to mid-July, September) across the year. Samples were analysed for DM, ash concentrations, acid detergent fibre (ADF), neutral detergent fibre (NDF) (Van Soest Reference Van Soest1963), crude protein (CP) (AOAC 1990) and organic matter digestibility (OMD) (Morgan et al. Reference Morgan, Stakelum and O'Dwyer1989).
Sward composition and dynamics
Sward white clover content
Sward WC content in each GC treatment was determined at each grazing by taking 15 random samples in a ‘W’ formation across each paddock at 4 cm above ground level using Gardena (Accu 60, Gardena International GmbH, Ulm, Germany) hand shears. Two 70 g samples were separated into PRG (and other grass or weed species) and WC components, dried at 60 °C for 24 h and the proportion of each component of the sward calculated on a DM basis.
Tiller density and stolon mass
Twenty turves (10 × 10 cm2) were removed from each paddock five times during the year (dates: 2 February, 6 April, 3 June, 3 August, 1 October) to estimate PRG tiller density and WC stolon mass (tillers/m2 and g/m2, respectively) as described by Evans et al. (Reference Evans, Williams, Jones and Evans1998). The botanical composition was determined from these turves by counting PRG tillers and other grass species. White clover stolons were separated from individual turves, the roots and leaves removed, and gently washed to remove excess soil. Stolons were dried at 40 °C for 48 h to estimate DM content.
Stolon morphology
Fifteen WC stolons were marked along three random 1 m transects using coloured wire in each GC treatment. Five stolons were marked per transect, and markers were placed behind the node bearing the oldest leaf present on the stolon, as per Pinxterhuis (Reference Pinxterhuis2000). Stolons were measured at each grazing for main stolon length (cm), number of nodes on main and branch stolons, and number of branches on the main stolon at each rotation. The presence or absence of leaf, petiole, root and branch was noted for each node. The rate of node production on the main stolon was calculated. Stolon width (cm) was measured using digital callipers.
Leaf, stem and dead proportions
Four samples (approximately 80 g in total) were cut at random using a scalpel to ground level in each paddock pre-grazing. From each sample, 40 g were weighed and separated into two portions: above and below 4 cm. The portion below 4 cm was discarded and that above 4 cm was separated into leaf, stem and dead material, and the proportion of each component of the sward calculated on a DM basis.
Leaf area
Leaf area (cm2) was calculated for 50 randomly selected leaves in each paddock pre-grazing using a portable laser leaf area meter (CI-202, CID Bio-Science, Washington, USA).
Tiller weight
Individual tiller weights (g) were calculated for 50 tillers in each paddock pre-grazing, as described by Enriquez-Hidalgo (Reference Enriquez-Hidalgo2014).
Biological nitrogen fixation
Biological N fixation was estimated using the N difference method (Munro & Davies Reference Munro and Davies1974). This method estimates BNF by calculating the difference between N yields of GC and GO swards within the same block:
Quantity of N fixed (kg N/ha) = Total N yield in GC swards – Total N yield in GO swards.
Statistical analyses
Analyses were undertaken on all variables using the mixed model procedure (PROC MIXED) in the statistical package SAS 9.3 (SAS 2011). Fixed effects included in the model were PRG ploidy, WC inclusion, rotation, PRG ploidy × WC inclusion interaction, PRG ploidy × rotation interaction and WC inclusion × rotation interaction, with block as a random effect. Grazing characteristics were analysed using the fixed effect rotation. Time period and date were used when analysing herbage nutritive values and tiller density and stolon mass measurements, respectively, in place of rotation. Differences were considered significant if P < 0.05. There was no significant effect of PRG ploidy × WC inclusion × rotation and so this interaction has been omitted from the text.
Results
Herbage dry matter production, herbage removed and grazing efficiency
Mean pre-grazing herbage mass did not differ between diploid (DO, DC) and tetraploid (TO, TC) swards (Table 2; diploid: 1600 ± 64.4 kg DM/ha; tetraploid: 1538 ± 63.8 kg DM/ha). The inclusion of WC reduced mean pre-grazing herbage mass on GC (DC, TC) swards by 212 kg DM/ha compared with GO (DO, TO) swards (P < 0.05; GO: 1675 ± 67.4 kg DM/ha; GC: 1463 ± 61.2 kg DM/ha). Annual herbage DM production did not differ between diploid and tetraploid swards (Table 2; diploid: 17 377 ± 375.8 kg DM/ha; tetraploid: 17 155 ± 375.8 kg DM/ha) but including WC increased herbage DM production by more than 2500 kg DM/ha (GO: 16 013 ± 375.8 kg DM/ha; GC: 18 519 ± 375.8 kg DM/ha). An extra 95 kg DM/ha was produced for every 1% increase in sward WC content (R 2 = 0.696; P < 0.001). The grazing efficiency of each sward (herbage utilized as a proportion of the pre-grazing herbage mass) is presented in Table 2. Although non-significant, tetraploid and GC swards maintained a higher grazing efficiency value than diploid and GO swards. There were significant effects of PRG ploidy (P < 0.001), WC inclusion (P < 0.01) and rotation (P < 0.001) on post-grazing sward height throughout the grazing season (Table 2). Tetraploid swards had a lower post-grazing sward height than diploid swards (P < 0.001; tetraploid: 3.79 cm; diploid: 4.20 cm) and GC swards had a lower post-grazing sward height when compared with GO swards (P < 0.01; GO: 4.11 cm; GC: 3.89 cm).
Table 2. Grazing characteristics and herbage nutritive value of each sward type
Data are presented as least-squares means. DO, diploid-only, TO, tetraploid-only, DC, diploid-white clover, TC, tetraploid-white clover; S.E.D., standard error of the difference between means; NS, not significant: P > 0.05; n/a, not applicable.
a Time = rotation is used for grazing characteristics, and period is used for herbage nutritive values: (1) February–March, (2) Mid May–mid June, (3) Mid June–mid July or (4) September.
Growth rates
There were no significant differences in mean daily herbage growth rates between diploid and tetraploid swards. Mean daily herbage growth rates for GC swards were significantly greater than GO swards (P < 0.001; Figure 1; DO: 50 ± 2.1 kg DM/ha/day; TO: 50 ± 2.1 kg DM/ha/day; DC: 61 ± 2.0 kg DM/ha/day; TC: 61 ± 2.1 kg DM/ha/day).
Fig. 1. Mean daily herbage growth rates (kg DM/ha) from 1 January to 31 December 2015 for diploid-only (DO), tetraploid-only (TO), diploid-white clover (DC) and tetraploid-white clover (TC) swards.
Sward composition and dynamics
Mean sward WC content differed between PRG ploidies (P < 0.05; DC: 0.29 ± 0.026; TC: 0.21 ± 0.026). White clover content in both swards was low at the beginning of the grazing season (February; 0.06) increasing to a peak of 0.39 (±0.072) and 0.33 (±0.072) in August in DC and TC swards, respectively (Fig. 2).

Fig. 2. Monthly sward white clover content between 1 February 2015 and 31 November 2015 for grass-clover swards.
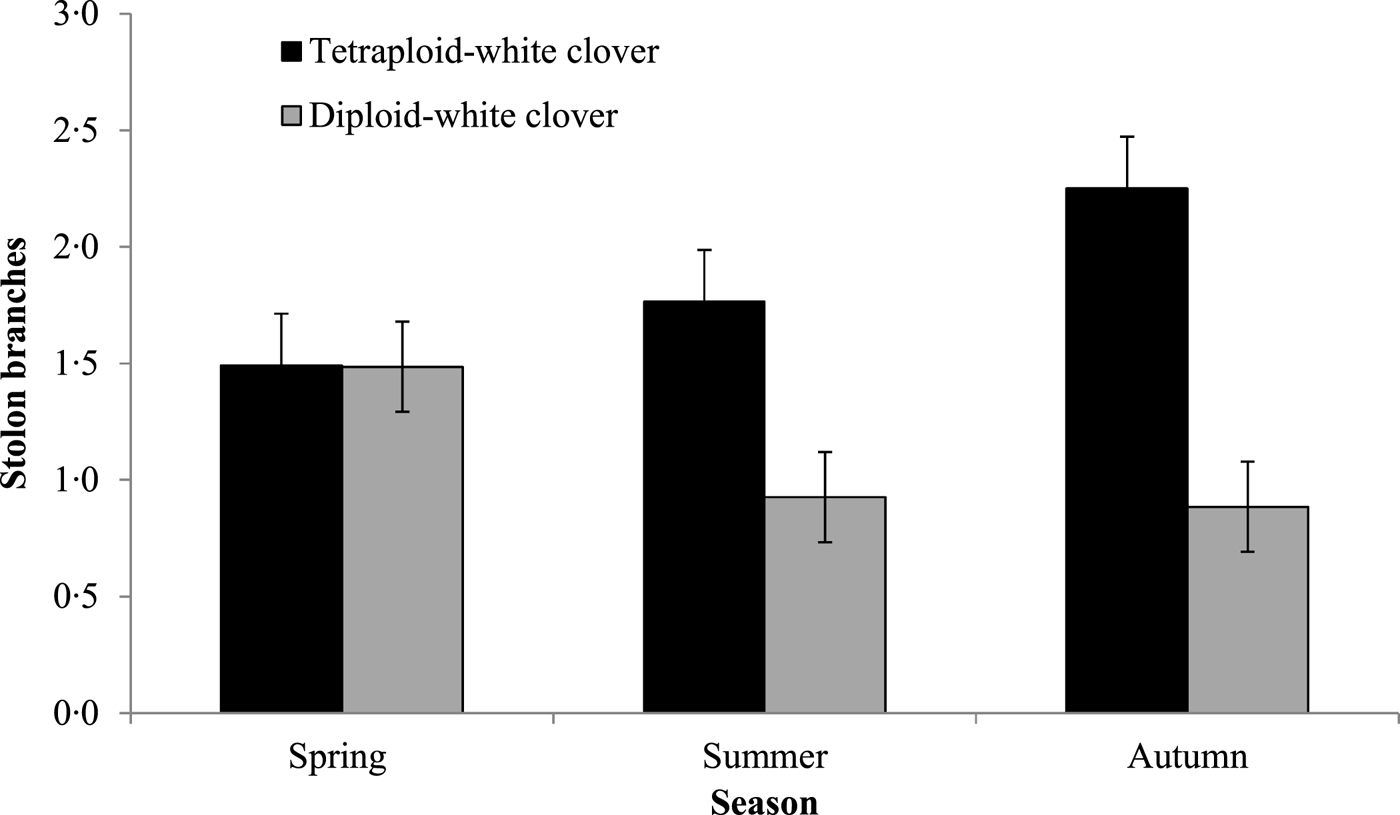
Stolons in DC swards were 0.58 cm longer than in TC swards (Table 3; P < 0.01; TC: 4.33 cm; DC: 4.91 cm) and as the grazing season progressed, stolons elongated significantly more in DC swards (Fig. 3; P < 0.001; TC: 3.18 cm; DC: 3.47 cm). Stolons in TC swards were approximately 0.53 mm wider than stolons in DC swards (P < 0.05; TC: 2.88 mm; DC: 2.35 mm) and had more branches than in DC swards (Fig. 4; P < 0.01; TC: 1.9 ± 0.52; DC: 1.0 ± 0.51). Stolons in DC swards had 0.14 more petioles than in TC swards (P < 0.05; TC: 3.4 ± 0.59; DC: 4.0 ± 0.59). White clover petioles in DC swards were 0.94 cm longer than in TC swards (P < 0.05; TC: 5 ± 1.1 cm; DC: 6 ± 1.1 cm).

Fig. 3. Average stolon length (cm) during each rotation of grazing between 1 February 2015 and 31 November 2015 for grass-clover swards (diploid-white clover (DC) and tetraploid-white clover (TC) swards).

Fig. 4. Average number of stolon branches during Spring, Summer and Autumn (1 February 2015 and 31 November 2015) for grass-clover swards (diploid-white clover (DC) and tetraploid-white clover (TC) swards).
Table 3. Perennial ryegrass tiller density and morphology, and white clover stolon mass and morphology for each sward type
Data are presented as least-squares means. DO, diploid-only, TO, tetraploid-only, DC, diploid-white clover, TC, tetraploid-white clover; S.E.D., standard error of the difference between means; NS, not significant: P > 0.05; n/a, not applicable.
a Time = date is used for tiller density and stolon mass, and rotation is used for grass morphology and stolon morphology.
Tiller density and stolon mass varied with PRG ploidy (P < 0.001), WC inclusion (P < 0.001) and between measurement dates (P ⩽ 0.001; Table 3). Diploid swards maintained a consistently higher tiller density (+1225 tillers/m2) compared with tetraploid swards (diploid: 5579 ± 314.2 tillers/m2; tetraploid: 4354 ± 314.2 tillers/m2) and the inclusion of WC reduced tiller density by 1649 tillers/m2 (GO: 5792 ± 314.2 tillers/m2; GC: 4143 ± 314.2 tillers/m2). Tiller density decreased by 58 tillers/m2 (R 2 = 0.408) with every 1% increase in sward WC content. There was no difference in stolon mass between DC and TC swards (Table 3; TC: 70 ± 12.3 g/m2; DC: 85 ± 12.3 g/m2). Overall, stolon mass decreased by 25% across the grazing season (P < 0.05).
Tetraploid swards had a greater leaf proportion (Table 3; P < 0.01; tetraploid: 0.71 ± 0.025; diploid: 0.61 ± 0.025) and less dead (P < 0.05; tetraploid: 0.10 ± 0.020; diploid: 0.13 ± 0.020) and pseudo-stem (P < 0.01; tetraploid: 0.16 ± 0.012; diploid: 0.20 ± 0.012) proportions than diploid swards. Sward leaf content was less (P < 0.01; GO: 0.68 ± 0.025; GC: 0.61 ± 0.025) and pseudo-stem (P < 0.001; GO: 0.16 ± 0.012; GC: 0.20 ± 0.012) and true-stem (P < 0.01; GO: 0.06 ± 0.021; GC: 0.05 ± 0.021) proportions greater in GC swards than GO swards.
Perennial ryegrass leaves in tetraploid swards were larger than in diploid swards (P < 0.05; tetraploid: 4.0 ± 0.35 cm2; diploid: 3.3 ± 0.35 cm2) and total leaf area increased in all sward treatments as the grazing season progressed (P < 0.001; Table 3). White clover inclusion did not affect leaf area (GO: 3.8 ± 0.35 cm2; GC: 3.6 ± 0.35 cm2).
Perennial ryegrass tillers in tetraploid swards were heavier than PRG tillers in diploid swards (P < 0.01; Table 3; tetraploid: 0.42 g; diploid: 0.35 g) and tiller weight increased in all sward treatments as the grazing season progressed (P < 0.001). However, tiller weight in GC swards was similar to GO swards (GO: 0.36 g; GC: 0.41 g).
Biological nitrogen fixation and herbage nutritive value
Grass-clover swards fixed 151 kg N/ha/year when compared with GO swards (P < 0.05). Significant seasonal changes in BNF rates were observed (P < 0.001), as rates in spring were very low and were greatest in August. All the measured herbage nutritive value characteristics differed significantly when compared between PRG ploidies (P < 0.05; Table 2). Greater OMD (P < 0.01; + 21 g/kg DM) and CP (P < 0.05; + 14 g/kg DM) was recorded in tetraploid swards than in diploid swards throughout the grazing season. Structural fibres (NDF and ADF) were significantly lower in tetraploid swards than in diploid swards (P = 0.001; NDF: −29 g/kg DM; P < 0.001; ADF: −27 g/kg DM). White clover had a significant effect on all herbage nutritive value characteristics with the exceptions of OMD and ash. Structural fibres (NDF and ADF) were lower in GC swards than in GO swards (P < 0.001; NDF: 367 v. 416 g/kg DM; P < 0.01; ADF: 230 v. 247 g/kg DM). Examining nutritive value changes on a seasonal basis, GC swards maintained consistently greater CP values than GO swards throughout the grazing season (P < 0.001; 241 v. 189 g/kg DM). Organic matter digestibility decreased to the same extent in both GO and GC sward types until late summer, after which the GC swards maintained a more uniform OMD content than GO swards (September: 801 v. 787 g/kg DM). Organic matter digestibility and CP declined significantly from spring to autumn; OMD declined from 832 to 756 g/kg and CP values declined from 241 to 193 g/kg DM, respectively. Structural fibres (NDF and ADF) increased throughout the grazing season; NDF and ADF values increased from 371 to 431 and 224 to 266 g/kg DM (P < 0.001) from spring to autumn, respectively.
Discussion
Perennial ryegrass swards in Ireland can produce in excess of 16 000 kg DM/ha (Brereton Reference Brereton, Jeffrey, Jones and McAdam1995; O'Donovan et al. Reference O'Donovan, Lewis and O'Kiely2011), with the national average on Irish dairy farms estimated at 7000–8000 kg DM/ha (Creighton et al. Reference Creighton, Kennedy, Shalloo, Boland and O'Donovan2011). Swards in the current study produced an average of 17 266 kg DM/ha, with GO swards producing 16 013 kg DM/ha and GC swards producing 18 519 kg DM/ha. These high DM production yields were achieved by a combination of high N fertilizer use and the grazing management used which ensured a pre-grazing herbage mass (>4 cm height) of 1300–1600 kg DM/ha/rotation.
Additional herbage DM production on GC swards was a result of the greater herbage growth rates compared with GO swards from May until October, when sward WC content reached 0.20. Above a sward WC content of 0.20, herbage DM production increases (Thomas Reference Thomas1973; Ribeiro Filho et al. Reference Ribeiro Filho, Delagarde and Peyraud2003, Reference Ribeiro Filho, Delagarde and Peyraud2005) and animal performance improves (Harris et al. Reference Harris, Clark, Auldist, Waugh and Laboyrie1997). Soil temperatures reached 16.2 °C in July, leading to sward WC content peaking at 0.45 and 0.35 in DC and TC swards, respectively. Prior to this, both GO and GC swards maintained similar herbage growth rates under similar management practices. In GC swards, high N fertilizer use can reduce sward WC content and WC contribution to herbage growth rate and DM production (Frame & Newbould Reference Frame and Newbould1986; Carlsson & Huss-Danell Reference Carlsson and Huss-Danell2003; Lüscher et al. Reference Lüscher, Mueller-Harvey, Soussana, Rees and Peyraud2014). Previous reductions of 27–41% sward WC content have been reported when a range of 180–200 kg N/ha has been used (Elgersma et al. Reference Elgersma, Schlepers and Nassiri2000; Ledgard Reference Ledgard2001; Enriquez-Hidalgo et al. Reference Enriquez-Hidalgo, Gilliland and Hennessy2016); however, increased herbage growth rates were maintained with high N fertilizer use in the current study, similar to Enriquez-Hidalgo et al. (Reference Enriquez-Hidalgo, Gilliland and Hennessy2016). This increased the herbage DM production difference between GC and GO swards receiving the same high N fertilizer levels. Increased stocking rates (and the resulting frequent, tight grazing) at high N levels has been shown to minimize the negative effects of increased grass growth on sward WC content (Harris & Clark Reference Harris and Clark1996) and the high stocking rate which led to frequent, tight grazing in the current study would have led to increased light penetration to the sward base, favouring WC growth. The combination of high N fertilizer use and high stocking rates also maintained herbage DM production in GO swards.
Perennial ryegrass ploidy can limit sward WC content as previous research suggests that tetraploid swards can result in greater sward WC content compared with diploid swards due to the more open structure of tetraploid swards (Gooding et al. Reference Gooding, Frame and Thomas1996; Stewart & Hayes Reference Stewart and Hayes2011). However, in the current study, DC swards achieved higher sward WC contents than TC swards (0.29 v. 0.21). Both DC and TC swards were grazed to a similar post-grazing sward height and managed similarly during the grazing season, reducing competition for light and removing any PRG ploidy sward canopy structure effects on sward WC content. However, PRG ploidy did not limit WC stolon mass, which can affect above-ground processes and WC persistence (Caradus & Williams Reference Caradus, Williams and Wright1981; Curll & Wilkins Reference Curll and Wilkins1982; Hay et al. Reference Hay, Chapman, Hay, Pennell, Woods and Fletcher1987). Stolon mass in the current study was similar for both DC and TC swards and was greater than that reported by Phelan (Reference Phelan2013), under limited N fertilizer use, and Egan (Reference Egan2015) under similar grazing managements, at different sites.
Similar to reducing sward WC content, high N fertilizer use can result in stolon mass reduction (Davies Reference Davies1992); however, in the current study, high stolon mass persisted at high N fertilizer levels, albeit for a single grazing season in young swards. Pinxterhuis (Reference Pinxterhuis2000) reported that high N fertilizer use (100 kg N/ha) increased stolon elongation in GC swards, increasing the spreading ability of WC and the ability to escape unfavourable grazing conditions. This is thought to be due to an increased internode length which occurs due to increased shading at the node. In the current study, similar to Pinxterhuis (Reference Pinxterhuis2000), the high N fertilizer use resulted in greater herbage mass, thereby increasing shading at the WC nodes due to increased PRG growth, than would be expected with zero N fertilizer use. This may have increased the spreading ability of WC. White clover plants in DC swards had longer stolons and fewer branches than TC swards which are a possible response to reduced light availability in swards with greater tiller density, similar to Brock et al. (Reference Brock, Hay, Thomas and Sedcole1988). Longer petioles allow leaves to be brought up higher into the canopy and thereby intercept more light: DC swards had narrower stolons, with longer and more numerous petioles, thereby potentially allowing for greater light interception by these swards. White clover plants in TC swards had wider stolons, which could result in the allocation of more resources to stolon tissue and fewer resources for the production of above-ground biomass which may have resulted in the shorter and less numerous petioles in TC swards compared with DC swards. Although growing points were not measured in the current experiment, the implication of lower petiole numbers is that WC plants in TC swards had fewer growing points. This can lead to reduced persistence of WC in tetraploid swards over time, as growing points are fundamental to the horizontal expansion of WC in the sward (Laidlaw et al. Reference Laidlaw, Teuber and Withers1992). Despite these morphological differences, cumulative herbage DM production was similar in both GC swards.
Sward structure can affect herbage utilization and grazing efficiency (Barrett et al. Reference Barrett, Laidlaw, Mayne and Christie2001; Gilliland et al. Reference Gilliland, Barrett, Mann, Agnew and Fearon2002) and, although all sward treatments in the current study were managed similarly, GC swards had lower tiller density than GO swards, allowing for a greater grazing intensity. This was indicated by the lower post-grazing sward height, which can lead to increased DM intake (Harris et al. Reference Harris, Clark, Auldist, Waugh and Laboyrie1997; Cosgrove et al. Reference Cosgrove, Burke, Death, Lane, Fraser and Pacheco2006) and in the current study, estimated herbage removed per cow was 2.8 kg DM/day greater for the GC swards compared with the GO swards (19.9 v. 17.1 kg DM/cow/day). The lower tiller density in GC swards has been shown previously and is due to interspecific competition between PRG and WC plants (Harris Reference Harris, Baker and Williams1987; Caradus et al. Reference Caradus, Hay, Woodfield and Woodfield1996), whereas less intraspecific competition exists in GO swards. However, despite the reduction in tiller density in GC swards, higher daily herbage growth rates and herbage DM production were maintained in GC swards. This is directly attributed to the WC contribution to the sward in the latter part of the grazing season, which provided additional herbage DM production when compared with GO swards.
The suppression of BNF by high N fertilizer use is widely accepted (Ledgard et al. Reference Ledgard, Sprosen, Penno and Rajendram2001; Carlsson & Huss-Danell Reference Carlsson and Huss-Danell2003; Unkovich Reference Unkovich2012). However, the amount of N fixed ultimately depends on several factors, including sward WC content. In the current study, sward WC contents were higher (0.25 sward WC content average in TC and DC swards) than Egan et al. (Reference Egan, Galvin and Hennessy2018; 0.23) and Enriquez-Hidalgo et al. (Reference Enriquez-Hidalgo, Gilliland and Hennessy2016; 0.19) at similar N fertilizer use. These high sward WC contents led to an extra 151 kg N fixed per ha. In spring, low levels of BNF were due to the lower herbage DM yields of WC in GC swards (GC: 19.7 kg N/ha; GO: 63.6 kg N/ha). However, as sward WC content increased from May, and soil N mineralization likely increased as temperatures increased, N content in GC swards began to increase (GC: 69 kg N/ha; GO: 53 kg N/ha). Biological N fixation values presented here accounted for herbage growth above 4 cm, and stolons, stubble or root N contents were not taken into account, where 0.25–0.70 of the plant N content occurs (Jorgensen & Ledgard Reference Jorgensen and Ledgard1997; Høgh-Jensen et al. Reference Høgh-Jensen, Loges, Jørgensen, Vinther and Jensen2004). It is possible that greater BNF values would have been obtained than those recorded in the current study were below-ground structures included.
Grass-clover swards had higher CP and lower fibre contents than GO swards, favourable characteristics for increased DM intake, digestion and utilization (Ayres et al. Reference Ayres, Nandra and Turner1998). Crude protein contents in GC swards were 5.3% higher than GO swards, similar to Ribeiro Filho et al. (Reference Ribeiro Filho, Delagarde and Peyraud2003) and Enriquez-Hidalgo et al. (Reference Enriquez-Hidalgo, Gilliland, Deighton, O'Donovan and Hennessy2014), and OMD increased as sward WC content increased, similar to Leach et al. (Reference Leach, Bax, Roberts and Thomas2000) and Ribeiro Filho et al. (Reference Ribeiro Filho, Delagarde and Peyraud2003). Previous investigations into GC cut plots have shown that NDF contents between PRG and WC sward components can vary as much as 171 g/kg DM (Søegaard Reference Søegaard and Frame1993) and the lower NDF contents are due to lower WC stem proportions compared with GO swards (Ulyatt et al. Reference Ulyatt, Lancashire and Jones1977; Buxton Reference Buxton1996). Seasonal variation in the current study was similar to Ulyatt (Reference Ulyatt and Morley1980) and Ulyatt et al. (Reference Ulyatt, Lassey, Shelton and Walker2002); fibre digestion rates decline with increased plant maturity (Chaves et al. Reference Chaves, Waghorn, Brookes and Woodfield2006), resulting in variation throughout the year.
Diploid and tetraploid swards achieved similar herbage growth rates throughout the grazing season (diploid: 55.4 kg DM/ha/day; tetraploid: 55.7 kg DM/ha/day), resulting in similar cumulative herbage DM production (diploid: 17 374 kg DM/ha; tetraploid: 17 152 kg DM/ha). Previous reports of PRG ploidy effects on herbage DM production have provided contrasting results. In GO swards, diploid swards were more productive than tetraploid swards in earlier studies: by 139 kg DM/ha/grazing (O'Donovan & Delaby Reference O'Donovan and Delaby2005) or 1141 kg DM/ha/year (Balocchi & López Reference Balocchi and López2009). Connolly (Reference Connolly2001) reported that plots of tetraploid monocultures could produce greater cumulative herbage DM yields (18 336 v. 17 388 kg DM/ha/year) than diploid monocultures under simulated grazing protocols, indicating that grazing pressure may affect PRG ploidies. However, these studies were undertaken before 2002 and so used different cultivars to the current study. The development of modern tetraploid cultivars has ensured optimum herbage DM production and so differences between PRG ploidies have become minimal. More recent studies also found similar herbage DM yields from diploid and tetraploid cultivars under animal grazing (Cashman et al. Reference Cashman, McEvoy, Gilliland and O'Donovan2016). In an evaluation of cultivars on commercial farms under animal grazing, cultivars were found to perform similarly in terms of herbage DM production regardless of PRG ploidy (Byrne et al. Reference Byrne, Gilliland, McHugh, Delaby, Geoghegan and O'Donovan2017). In the current study, excess herbage did not accumulate between grazings, and despite sward structural differences between PRG ploidies (Gilliland et al. Reference Gilliland, Barrett, Mann, Agnew and Fearon2002), neither PRG ploidy provided superior herbage DM production under similar grazing managements.
Previous studies have shown tetraploid cultivars to have greater leaf proportions and lower stem proportions (Gowen et al. Reference Gowen, O'Donovan, Casey, Rath, Delaby and Stakelum2003) than diploid cultivars. The higher post-grazing sward height and greater dead proportions in diploid swards in the current study may have led to the accumulation of dead material in subsequent rotations that can affect nutritive value negatively (Fulkerson & Donaghy Reference Fulkerson and Donaghy2001), leading to loss of herbage DM available through leaf senescence and reduced rates of tillering (Grant et al. Reference Grant, Barthram and Torvell1981). In contrast, the lower post-grazing sward height and reduced dead proportions of tetraploid swards in the current study led to superior herbage nutritive value during the grazing season similar to O'Riordan et al. (Reference O'Riordan, O'Kiely and Keane1998) and Wims et al. (Reference Wims, McEvoy, Delaby, Boland and O'Donovan2013). In addition, previous reports have shown tetraploid swards remain highly digestible (Cashman Reference Cashman2014) and support a higher DM intake (Lantinga & Groot Reference Lantinga, Groot, Groen and van Bruchem1996; Gowen et al. Reference Gowen, O'Donovan, Casey, Rath, Delaby and Stakelum2003; Wims et al. Reference Wims, McEvoy, Delaby, Boland and O'Donovan2013) throughout the grazing season. The greater leaf proportions in tetraploid swards led to higher CP (+6.2%) and OMD (+2.6%) contents than diploid swards. Tiller density in tetraploid swards was lower than diploid swards and PRG tillers in tetraploid swards had reduced dead proportions, due to a lower post-grazing sward height, and greater leaf area, due to the nature of tetraploid morphology. The potential for increased grazing intensity due to this lower tiller density and post-grazing sward height led to higher levels of sward digestibility and CP as per McCarthy et al. (Reference McCarthy, Pierce, Delaby, Brennan, Fleming and Horan2013). Additionally, sward DM content was lower in tetraploid swards compared with diploid swards, similar to Wims et al. (Reference Wims, McEvoy, Delaby, Boland and O'Donovan2013) and tetraploid swards had enhanced nutritive value due to an increased ratio of cell contents to cell walls (Smith et al. Reference Smith, Simpson, Culvenor, Humphreys, Prud'Homme and Oram2001), leading to easier grazing of tetraploid swards. In the current study, tetraploid tillers were 20% heavier than diploid tillers, due to the decreased competition for space and light in the sward as shown previously by Davies & Thomas (Reference Davies and Thomas1983).
Practical implications and conclusions
Including WC in PRG swards resulted in an increase in herbage DM production of 2507 kg DM/ha compared with GO swards at 250 kg/ha N and 2.75 LU/ha. However, the current study was conducted for one full grazing season on young swards (2–3 years old) and so may not represent older sward types (+5 years old), as older swards typically have a lower sward WC content and higher soil N. The frequent and tight grazing management (post-grazing sward height ⩽4 cm) used in the current study maintained a sward WC content of >0.20 despite high N fertilizer use. Although the GC swards produced an extra 2507 kg DM/ha, herbage CP content was also greater on these sward types, thereby increasing the potential for N to be lost from the system. A reduction in N fertilizer use as per Enriquez-Hidalgo et al. (Reference Enriquez-Hidalgo, Gilliland and Hennessy2016) could result in lower CP content and similar herbage DM production and OMD at levels required for animal production. Although tetraploid swards maintained a lower tiller density, sward WC content was higher in diploid swards. This may have been due to the lower tetraploid tiller density promoting a lower post-grazing sward height that may have removed more WC from TC swards. However, as tetraploid swards had a greater leaf proportion and increased CP and OMD levels than diploid swards, they provided better quality feed at a similar herbage DM production and herbage growth rate.
Acknowledgements
The authors wish to gratefully acknowledge the invaluable assistance provided by the farm and technical staff at Teagasc, Clonakilty and Teagasc, Moorepark, Co. Cork, Ireland. This research was funded by the Irish Dairy Levy administered by Dairy Research Ireland. The first author was in receipt of a Teagasc Walsh Fellowship.