Introduction
Trypanosoma evansi, an important camel pathogen, belongs to subgenus Trypanozoon, a group of trypanosomes with diverse mammalian hosts (Ngaira et al. Reference Ngaira, Bett, Karanja and Njagi2003; Desquesnes et al. Reference Desquesnes, Dargantes, Lai, Lun, Holzmuller and Jittapalapong2013). It was first isolated in Dera Ismail Khan district of Punjab India in 1880 from infected camels and equids (Tehseen et al. Reference Tehseen, Jahan, Qamar, Desquesnes, Shahzad, Deborggraeve and Büscher2015). The parasite is also believed to have originated from Africa where, presently, it causes the trypanosomiasis (surra) in camels, horses, cattle, buffaloes, small ruminants and dogs (Ngaira et al. Reference Ngaira, Bett, Karanja and Njagi2003).
Surra is therefore endemic in many tropical and subtropical countries wherever biting-fly vectors are present. These countries include North and eastern Africa, the Middle East, Indian sub-continent, central Asia, southern China and South America (Dávila et al. Reference Dávila, Souza, Campos and Silva1999; Njiru et al. Reference Njiru, Constantine, Ndung'u, Robertson, Okaye, Thompson and Reid2004) and the Canary Islands (Luckins, Reference Luckins1988). Its major impact has been felt in the arid and semi-arid areas (Tekle and Abebe, Reference Tekle and Abebe2001).
Cattle and water buffalo are important for draught power, meat, milk and also for capital investment for low-income farmers in the affected areas (Luckins, Reference Luckins1988). The current diagnostic tests are insufficient (Desquesnes et al. Reference Desquesnes, Dargantes, Lai, Lun, Holzmuller and Jittapalapong2013) making it difficult to estimate both the direct and indirect economic losses attributable to T. evansi infections (Desquesnes et al. Reference Desquesnes, Dargantes, Lai, Lun, Holzmuller and Jittapalapong2013). Most estimates are based on mortality and chemotherapeutic interventions. For example in the Philippines, the estimated losses due to mortality are approximately US$ 1.1 million (Manuel, Reference Manuel1998) while in Indonesia the annual loss from morbidity and mortality is approximately US$ 28 million (Payne et al. Reference Payne, Djauhari, Partoutomo, Jones and Pearson1991).
Trypanosoma evansi, which is closely related to Trypanosoma brucei brucei, is adapted for mechanical transmission (Antoine-Moussiaux et al. Reference Antoine-Moussiaux, Biischer and Desmecht2009), whereas the latter is cyclically transmitted by tsetse flies (Hoare, Reference Hoare1972). A mechanical transmission is as a result of the loss of maxicircle kinetoplastid DNA in T. evansi (Borst and Hoeijimakers, Reference Borst and Hoeijimakers1979), which lock the trypanosome in the bloodstream stages (Luckins, Reference Luckins1988). The absence of intermittent development in any insect vector has enabled T. evansi to spread beyond the tsetse fly belt of Africa to other areas in the world (Luckins, Reference Luckins1988; Desquesnes et al. Reference Desquesnes, Dargantes, Lai, Lun, Holzmuller and Jittapalapong2013).
Trypanosomes produce biologically active substances which cause trypanosomiasis; these include: variable surface glycoproteins (VSG), enzymes, B-cell mitogen and T lymphocyte triggering factor (TLTF) (Bezie et al. Reference Bezie, Girma, Dagnachew, Tadesse and Tadesse2014). Majority of T. evansi stocks express a VSG known as Rode Trypanozoon antigen (RoTat) type 1.2, a predominant VSG (Urakawa et al. Reference Urakawa, Verloo, Moens, Büscher and Majiwa2001; Claes et al. Reference Claes, Verloo, De Waal, Urakawa, Majiwa, Goddeeris and Buscher2002). In Kenya, types A and B T. evansi, characterized by presence and absence of RoTat 1.2 VSG gene, respectively, have been reported (Urakawa et al. Reference Urakawa, Verloo, Moens, Büscher and Majiwa2001; Ngaira et al. Reference Ngaira, Olembo, Njagi and Ngeranwa2005; Njiru et al. Reference Njiru, Constantine, Masiga, Reid, Thompson and Gibson2006). Type B has also been reported in Ethiopian dromedary camels (Birhanu et al. Reference Birhanu, Gebrehiwot, Goddeeris, Büscher and Van Reet2016). Overall, the prevalence of type B largely remains unknown (Njiru et al. Reference Njiru, Ouma, Enyaru and Dargantes2010).
In order to compete for transmission to new hosts, some pathogens, including T. evansi, extract resources from the host, thereby causing damage (Mackinnon et al. Reference Mackinnon, Gandon and Read2008). This damage will depend on the level of virulence of the pathogen as the host immunity can aggravate selection of virulence. Pathogens, therefore, run the risk of killing their host and completely lose their ongoing source of transmission to new hosts. Virulence has been reported in many pathogens (Little et al. Reference Little, Chadwick and Watt2008; Mackinnon et al. Reference Mackinnon, Gandon and Read2008), measured by the survival rate of the host following infection. Little et al. (Reference Little, Chadwick and Watt2008) proved that relative growth rates of two parasite isolates studied depended on the host genotype.
However, it is generally acknowledged that naïve animals succumb to an infection faster than the animals that have been previously exposed to the disease (Mackinnon et al. Reference Mackinnon, Gandon and Read2008). The trade-off hypothesis and its assumptions have been well-covered in malaria (Mackinnon et al. Reference Mackinnon, Gandon and Read2008). Depending on pathogen types, evolutionary outcomes may occur. Other studies have reported that cysteine proteases (CPs), which are members of the papain family, are expressed during the infective stages of the parasite's life cycle and are suspected to act as pathogenic factors in the mammalian host, where they also trigger prominent immune responses (Lalmanach et al. Reference Lalmanach, Boulangé, Serveau, Lecaille, Scharfstein, Gauthier and Authié2002). The aim of the present study, therefore, was to generate data that would enhance our understanding of virulence in T. evansi towards the development of novel approaches for management of the disease in camels.
Materials and methods
Ethical approval
All experimental protocols and procedures used in this study involving laboratory animals were reviewed and approved by Institutional Animal Care and Use Committee (IACUC) of Kenya Agricultural and Livestock Research Institute –Biotechnology Research Institute (KALRO-BioRI) Ref: C/BioRi/4/325/II/1.
Experimental animals
The study used 6–8 weeks old male Swiss White mice, each weighing 25–30 g live body weight. The animals were obtained from the Animal Breeding Unit at KALRO-BioRI, Muguga. The mice were housed in standard mouse cages and maintained on a diet consisting of commercial pellets (Unga® Kenya Ltd). All experiments were performed according to the guidelines set by the Institutional; Animal Care and Use Committee of KALRO-BioRI. Briefly, water was provided ad libitum (Kagira et al. Reference Kagira, Ngotho and Thuita2007). All mice were acclimatized for 2-weeks, during which time they were screened and treated for the ecto and endo-parasites using ivermectin (Ivermectin®, Anupco, Suffolk, England) (Ndung'u et al. Reference Ndung'u, Ngotho, Kinyua, Kagira, Guya, Ndung'u and Murilla2008). During the 2-week quarantine period, pre-infection data were collected on body weights and packed cell volume twice a week prior to parasite inoculation.
Trypanosoma evansi isolates and preparation of inoculum
A total of 17 isolates obtained from different geographic regions and mammalian host species were used in the study (Table 1). Seven of the 17 isolates were obtained from Swiss Tropical Institute, Basel (STIB) while the remaining 10 isolates were obtained from the KALRO-BioRI, Trypanosome bio-bank (Murilla et al. Reference Murilla, Ndung'u, Thuita, Gitonga, Kahiga, Auma, Ouma, Rutto and Ndung'u2014). The parasite stabilates obtained from BioRI trypanosome bank were thawed, and their viability established through microscopy. The parasites were considered viable if motile parasites were observed through wet film under a microscope. The parasites were diluted in phosphate buffered Saline Glucose (PSG; pH 8.0), and their viability confirmed (Gichuki and Brun, Reference Gichuki, Brun, Zak and Sande1999). Two immunosuppressed donor mice per isolate were each inoculated intraperitoneally (i.p) with 200 µL of 1 × 10⁵ trypanosomes mL−1 (Gichuki and Brun, Reference Gichuki, Brun, Zak and Sande1999). Immunosuppression was achieved by administration of cyclophosphamide at 300 mg kg−1 per animal at 100 mg kg−1 bodyweight per day for 3 consecutive days (Murilla, et al. Reference Murilla, Ndung'u, Joanna, Purity and Thuita2016). The animals were monitored for trypanosomes daily until parasites were detected in the peripheral blood. Thereafter, the parasitaemia was monitored three times a week up to the first peak (1 × 10⁹ trypanosomes) parasitaemia (Herbert and Lumsden, Reference Herbert and Lumsden1976). At peak parasitaemia, the mice were euthanized by placing them in a chamber containing carbon dioxide (CO2) and bled from the heart into a tube containing EDTA (Gichuki and Brun, Reference Gichuki, Brun, Zak and Sande1999).
Table 1. Sample details of T. evansi phenotyped or this study showing sample ID, strain isolated with source and reference in footnote, kinetoplast DNA (kDNA) type, virulence levels based on survival of infected Swiss White mice following infection, locality of origin, host of isolation, and the year of isolation
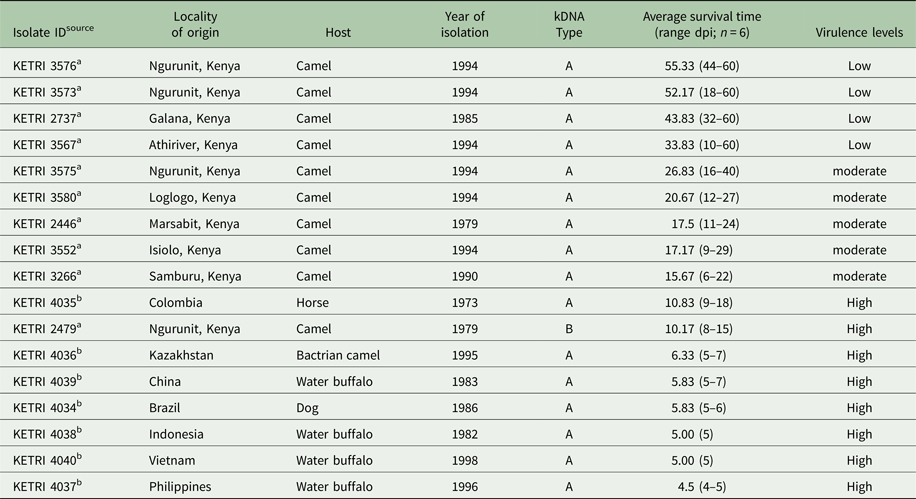
a Kenya Trypanosomiasis Research Institute.
b Swiss Tropical Institute Basel.
n, number of infected mice; dpi, days post infection.
The blood was pooled and parasitaemia density determined. The pooled blood was diluted in PSG buffer (pH 8.0). The number of trypanosomes was quantified using an improved Neabauer chamber and viewed under the microscope (Seamer et al. Reference Seamer, Southee, Thompson, Trussell, West and Jennings1993). The first count (C 1) and the second count (C 2) were made through all the 16 squares of the haemocytometer and the average count C av calculated.
Trypanosome inoculation into experimental mice
Six mice were used per isolate. Six additional animals were used as controls (not infected). The experimental mice were inoculated i.p with 1 × 10⁵ trypanosomes in 200 µL of PSG (pH = 8.0). The mice in the control group were similarly injected with 200 µL of PSG per mouse. All the infected animals were maintained as described above for 60 days post-infection (dpi).
Parameters monitored during the pathogenicity studies
To monitor anaemia, polycythaemia or dehydration for each group of experimental animals, the following parameters were recorded; the pre-patent period (pp) (day of the first appearance of the parasite in the blood), parasitaemia profiles and packed blood cell volume (PCV) as an indicator for the development of anaemia and survival.
Evaluation of parasitaemia in infected mice
A drop of blood from the mouse-tail was placed on a clean slide and covered using a cover slip and examined under a microscope (Seamer et al. Reference Seamer, Southee, Thompson, Trussell, West and Jennings1993). The parasitaemia score was correlated to a score sheet, as outlined by Herbert and Lumsden (Herbert and Lumsden, Reference Herbert and Lumsden1976). Parasitaemia was determined daily for the first 14 days. The period taken from parasite inoculation to the first appearance of trypanosomes in blood was recorded for all groups. Thereafter, parasitaemia was determined and recorded twice weekly up to 60 dpi. Any observed mortalities were recorded on daily basis.
Survival
Each mouse was monitored daily for a period of 60 dpi. The end point of the infected mice was determined by observation of clinical signs such as lethargy and hackle hair, as well as PCV drop of approximately 25% with consistent high parasitaemia levels of 1 × 10⁹/mL−1 for at least 3 consecutive days. The animals were sacrificed immediately by CO2 asphyxiation in accordance with guidelines of the Institutional Animal Care and Use Committee (IUCAC) as described by (Martinez-gutierrez et al. Reference Martinez-gutierrez, A Correa-london, Castellanos, Gallego-Gomez and Osorio2014) and recorded as dead animals. Mice surviving beyond this period (60 dpi), were sacrificed using carbon dioxide and the survival time recorded as 60 days and categorized as censored data. Log rank P and the Wilxcon P values were determined and used to test the null hypothesis that the survival curves are identical in all the T. evansi populations (O'brien, Reference O'brien1998).
Assessment of PCV in infected and uninfected mice
Blood from infected mice and uninfected controls was collected from the tail vein using heparinized capillary tubes and sealed with plasticine at one end (Naessens et al. Reference Naessens, Kitani and Nakamura2005). The sealed capillaries were centrifuged in a haematocrit centrifuge at 10 062g, for 5 min. PCV was read using the haematocrit reader and expressed as a percentage (%) of the total blood volume (Naessens et al. Reference Naessens, Kitani and Nakamura2005). The PCV data were collected twice weekly for the experimental period of 60 dpi.
Assessment of body weights in infected and uninfected mice
Body weights of mice were determined using an analytical balance (Mettler Tolendo PB 302®, Switzerland) and expressed in grams prior and after inoculation. Data on live body weights were recorded twice a week for a period of 2 weeks before inoculation and over the experimental period of 60 dpi. The differences in the weights were determined.
Data analysis
The analysis was done to test the significant differences between the isolates in PCV, parasitaemia and body weights. The data obtained from the study were summarized as means ± standard error, while the differences between and within the means were analysed using one-way ANOVA. All analysis was conducted using GenStat (Nelder and Baker, Reference Nelder and Baker1972). P ⩽ 0.05 were considered statistically significant.
Results
Parasitaemia profiles and survival of infected mice
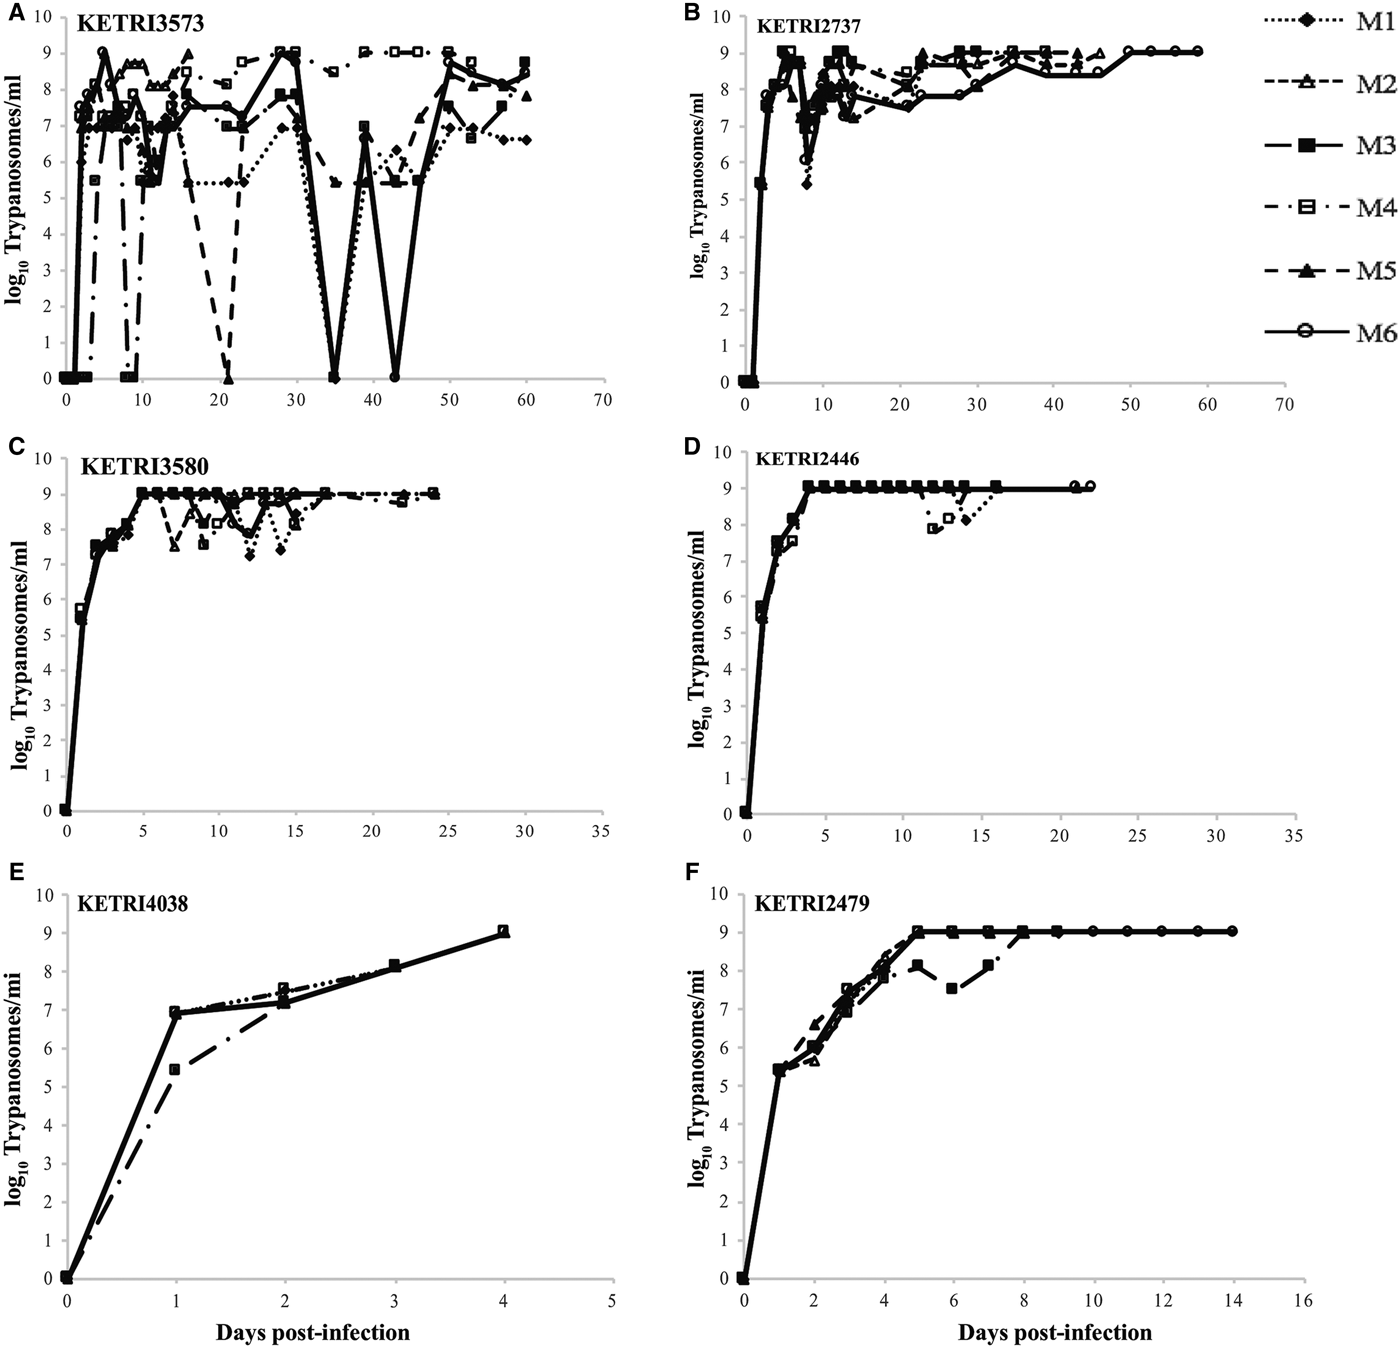
The pp for mice infected with the 17 different T. evansi isolate was in the range of 1–3 dpi with parasitaemia progressing to the peak within 3 days (Figs 1 and S1). Based on parasitaemia profiles and survival of the infected mice, three distinct virulent groups were identified: (1) low, exhibiting high intermittent parasitaemia, survival 31–60 dpi; (2): moderate, exhibiting high persistent parasitaemia, survival 11–30 days; and (3): high, exhibiting high persistent parasitaemia, survival period 0–10 days. Mice in the high virulent group died before any clinical signs were manifested (Table 1). Three of four isolates (KETRI 3573, 3576, 3567) classified as low virulence exhibited high intermittent parasitaemia, with more than one parasitaemia wave in some animals (Figs 1A, S1A and B). The highest parasitaemia score attained was 1 × 10⁹ trypanosomes mL−1. Each mouse attained this score at least once in the first 10 dpi. Parasitaemia profiles were significantly different (P < 0.05) between individual mice infected with the same isolate and between isolates (Table 2).

Fig. 1. (A and B) Parasitaemia profiles of individual mice infected with low virulence Trypanosoma evansi isolates; KETRI 3573 and 2737. (C and D) Parasitaemia profiles of mice infected with moderate virulence Trypanosoma evansi isolates; KETRI 3580 and 2446. (E and F) Parasitaemia profiles of individual mice infected with high virulence Trypanosoma evansi isolates; 4038 and 2479. (M, mouse).
Table 2. Comparison of mean packed cell volume change (%), mean parasitaemia and mean bodyweights change (%) values between various Trypanosoma evansi isolates following infection of mice at different virulence levels
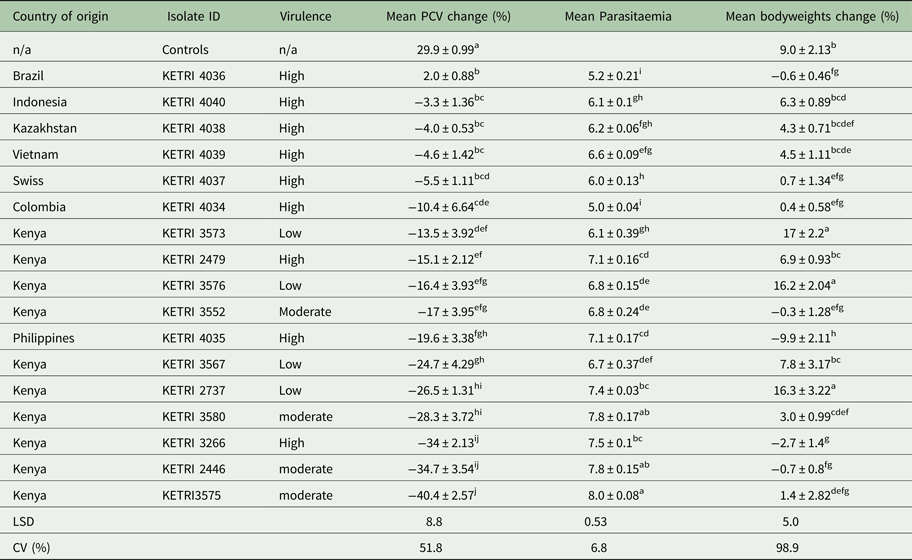
NB: Means followed by the same letter do not significantly differ (P = 0.05).
LSD: least significant difference; CV: coefficient of variation.
In contrast, high persistent parasitaemia with a peak score of 1 × 10⁹ was recorded in mice infected with isolates of moderate virulence (Figs 1C, D and S1C–E). There were no significant differences in parasitaemia profiles (P > 0.05) between individual animals infected with any of the isolates in this group except KETRI 3552 whose profile was significantly different from the rest of the isolates (Table 2).
Mice infected with one isolate from Kenya (Type B) and 6 from Asia and South America exhibited very high persistent parasitaemia, but of a shorter duration when compared with the moderate virulence group. Significant differences (P < 0.05) were observed between isolates of this group (Figs 1E, S1F–K and Table 2). These isolates were classified as highly virulent.
A comparison revealed significant differences (P < 0.05) in parasitaemia scores between the 3 virulence groups. Four of five isolates classified as moderately virulent had a mean log parasitaemia score above 7.5; three of four low virulent isolates with a mean log score above 6.5 and six of nine high virulent isolates with a mean log score of approximately 6.5 and below. These results demonstrated that the mean parasitaemia scores of the high virulent isolates were low with high death rates recorded within a short period when compared with the moderate and low virulent parasites.
Survival
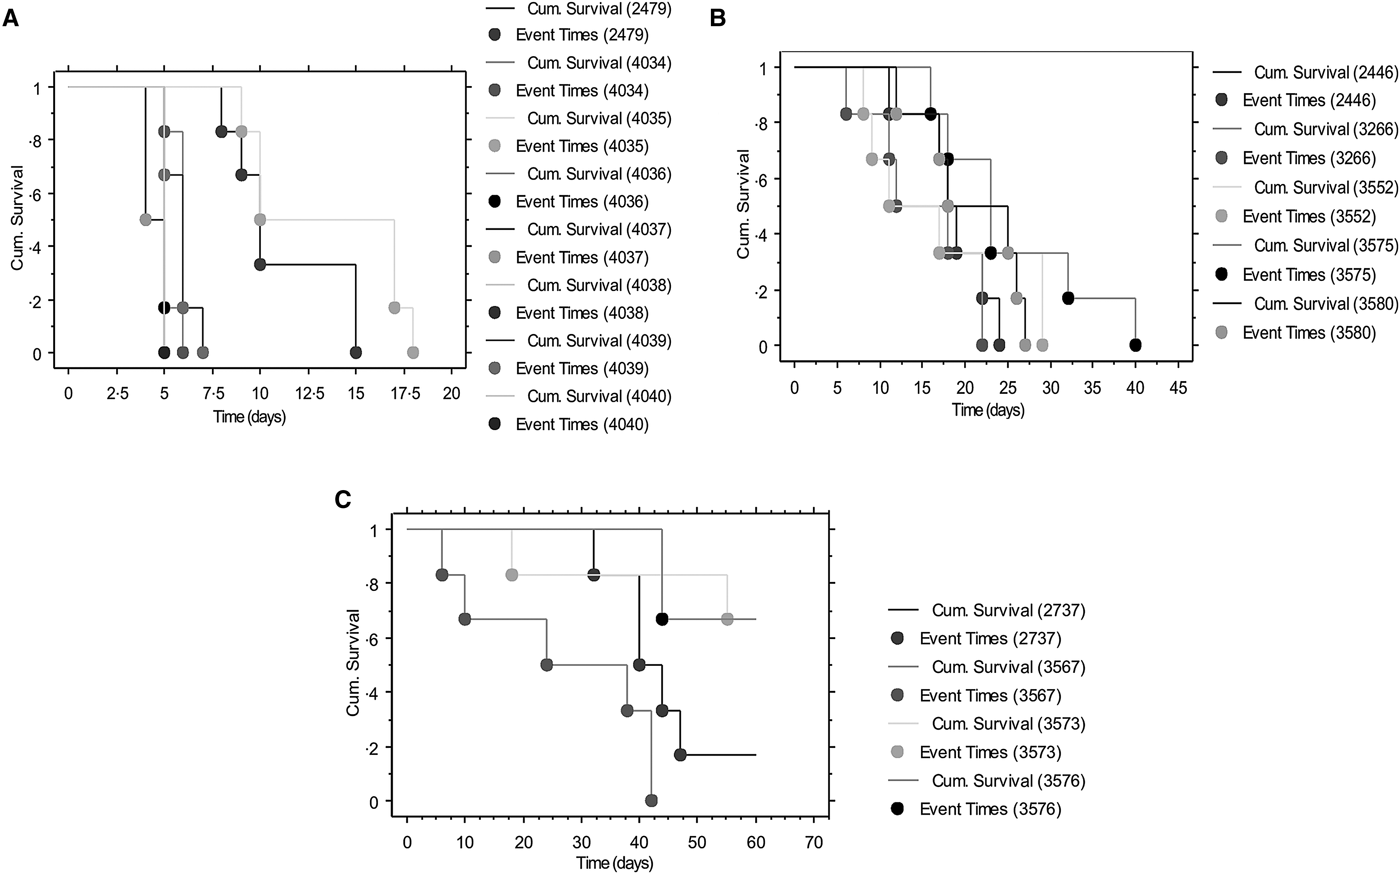
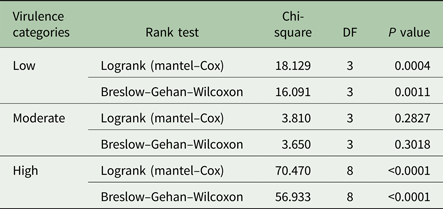
Survival curves are shown in Fig. 2A–C, depicting the fraction of animals alive from the time of parasite inoculation (time 0; Fig. 2A). No deaths were recorded in the control group during the 60 days observation period. Of the low virulence group isolate, KETRI 2737 depicted four successful event times (survival) when compared with two event times for animals infected with KETRI 3573 (high and intermittent parasitaemia). Log rank P and the Wilxcon P values are provided in Table 3. Both the Log rank and the Wilxcon P values obtained for the low virulence and high virulence showed significant differences (P < 0.01) in survival at both early and later days of infection. Mice infected with parasites of moderate virulence showed significant similarities between individual animals within and between isolates (Table 3; P > 0.05).

Fig. 2. Survival curves depicting the fraction of animals alive from the time (0) of parasite inoculation: (A) Survival curves of Trypanosoma evansi isolates of high virulence. (B) Survival curves of Trypanosoma evansi isolates of medium virulence. (C) Survival curves of Trypanosoma evansi isolates of low virulence.
Table 3. Rank tests for survival time of Swiss White mice infected with Trypanosoma evansi isolates of varied virulence obtained from different endemic regions of the world
Packed blood cell volume
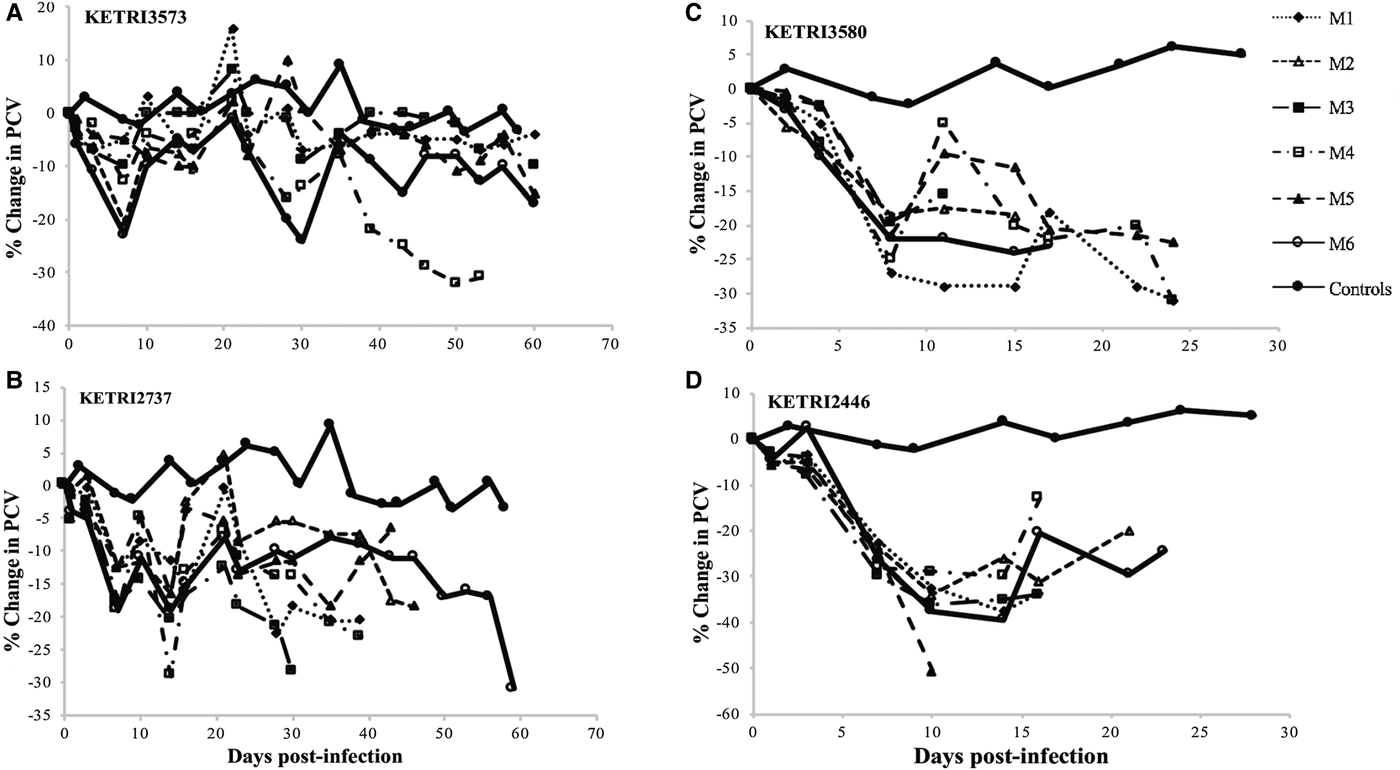
The control (non-infected) mice generally maintained their pre-infection PCV values (29.9 ± 0.99) throughout the observation period of 60 days. However, a gradual decline in mice infected with different low virulence isolates was recorded (Figs 3A, B, S2A and B). Isolates of moderate virulence recorded rapid decline in PCV when compared with the control group (Figs 3C, D and S1C–E). Individual mice and different isolates recorded no significant difference.

Fig. 3. (A and B) per cent (%) Packed Cell Volume change profiles of individual mice infected with low virulence Trypanosoma evansi isolates; KETRI 3573 and 2737. (C and D) Percent (%) Changes in packed cell volume of individual mice infected with moderate virulence Trypanosoma evansi isolates; KETRI 3580 and 2446. (M, mouse).
There were no PCV profiles available for the high virulence group due to short survival period that ranged from 4 to 10 days. The drop in PCV was of approximated 3%. There were significant differences in % PCV values between the controls and infected animals (P < 0.05; Table 2). Generally, the results showed that very high and persistent parasitaemia levels were associated with a rapid drop in PCV values.
Body weight profiles
A gradual increase in live body weights of 9.0 ± 2.13 g was observed in all mice in the control group over the observation period of 60 days. A similar trend was observed in profiles of animals infected with isolates classified as low virulence (7.8 ± 3.17 to 17 ± 2.2); (Figs 4A, B, S3A and B), three of which were significantly higher (P < 0.05) than those of controls, with exception of KETRI 2737 where there was a decrease compared with the controls (Fig. 4B).
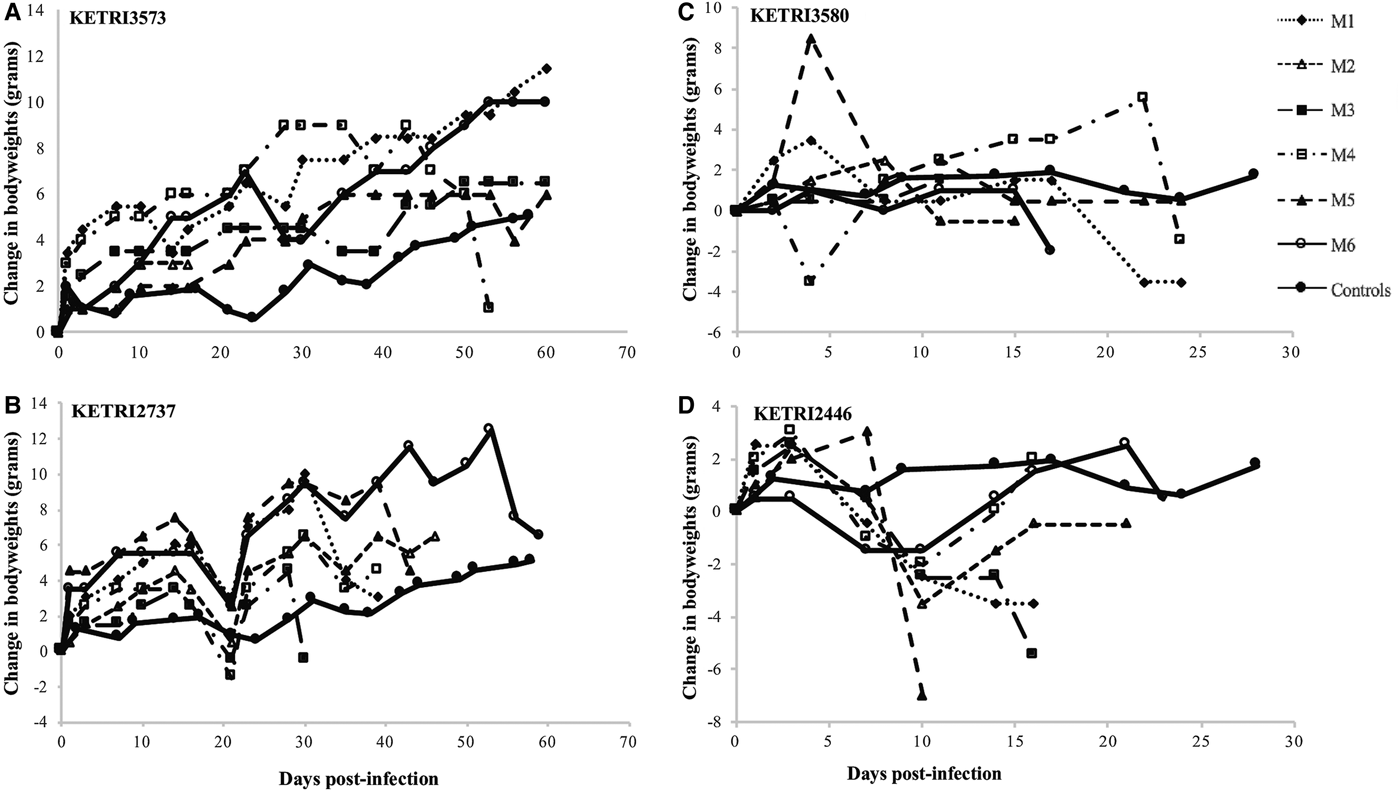
Fig. 4. (A and B) bodyweight changes profiles of individual mice infected with low virulence Trypanosoma evansi isolates; KETRI 3573 and 2737. (C and D) bodyweight change profiles of individual mice infected with moderate virulence of Trypanosoma evansi isolates; KETRI 3580 and 2446. (M, mouse).
When compared with the control mice, rapid decline in bodyweights was observed in mice infected with four of the moderate virulent isolates as shown in Figs 4D and S3C–E. However, no weight loss was observed in mice infected with the isolate KETRI 3580 within the same category of classification (Fig. 4C). No body weight profiles are available for the high virulence group due to the short survival period.
Discussion
The present study demonstrated the existence of different levels of virulence in T. evansi isolates from Kenya which ranged from low, moderate to high. Virulence was measured using parasitaemia, mortality (survivorship data), levels of anaemia and weight loss experienced by the host during the infection: these are positive indicators of the probability of host death as described by various authors (Mackinnon et al. Reference Mackinnon, Gandon and Read2008; Mekata et al. Reference Mekata, Konnai, Mingala, Abes, Gutierrez, Dargantes, Witola, Inoue, Onuma, Murata and Ohashi2013). The high and persistent parasitaemia for periods of over 10 days was mainly associated with rapid decline in both packed cell volume and body weight, indicating disease severity. Our results also demonstrated that low and intermittent parasitaemia was associated with maintenance and in some cases, weight gain when compared with uninfected animals (P < 0.05). The most pathogenic of the three categories was the moderate virulence category, which persisted in the host long enough, presenting the opportunity for horizontal transmission to new hosts to take place. The rapid death of the mice infected with the high virulent group of parasites suggested lack of a trade-off between the host and pathogen as would occur in epidemics; the animals did not survive long enough to allow multiplication and transmission to new hosts.
In the present study, the animals that were able to control parasitaemia (low virulence) were also able to control PCV and generally maintain live body weights. This concurs with observations made by Noyes et al. (Reference Noyes, Alimohammadian, Agaba, Brass, Fuchs, Gailus-Durner, Hulme, Iraqi, Kemp, Rathkolb and Wolf2009) on main characteristics used to determine resistance to trypanosomiasis. Our findings also suggest that, where the majority of the infections (high virulence) lead to host death within 10 days, it is highly likely that transmission would cease immediately as in epidemics, concurring with observations of Mackinnon et al. (Reference Mackinnon, Gandon and Read2008). Three T. evansi isolates showed intermittent parasitaemia in the low virulent group, suggesting possible development of new variants of the parasite in infected mice. Intermittent parasitaemia can be explained by the fact that parasites use different strategies to evade the mammalian hosts’ immune system, one of which is population growth (Alizon et al. Reference Alizon, Hurford, Mideo and Van Baalen2009). This helps the parasite to avoid elimination by specific potent immune responses (Vincendeau and Bouteille, Reference Vincendeau and Bouteille2006) and yield variants that proliferate and produce a new population. This is the basis of the antigenic variation that has posed challenges to vaccine development in trypanosomiasis (Magez et al. Reference Magez, Caljon, Tran, Stijlemans and Radwanska2010). In a study using Escherichia coli, Berngruber et al. (Reference Berngruber, Froissart, Choisy and Gandon2013) tested the theory ‘that predicts that selection for pathogen virulence and horizontal transmission is highest at the onset of an epidemic but decreases thereafter, as the epidemic depletes the pool of susceptible hosts’, providing proof that the virulent strain is strongly favoured in the early stage of the epidemic, but loses competition with the latent virus as prevalence increases. This could be the reason for high morbidity reported in camels in different parts of the world where the disease is endemic (Morrison et al. Reference Morrison, Roelants, Mayor-Withey and Murray1978).
Anaemia is an inevitable consequence of trypanosome infection (Murray and Dexter, Reference Murray and Dexter1988). According to Murray and Dexter (Reference Murray and Dexter1988), the rapid drop of PCV is always correlated closely with the appearance of parasitaemia. Anaemia and weight loss are therefore two of several clinical signs of acute animal trypanosomiasis. In the present study, gradual decline in PCV was recorded in mice infected with isolates that exhibited intermittent parasitaemia; the drop-in body weights were also gradual with weight gain recorded in others. However, there was a rapid drop in the PCV in the animals that exhibited high and persistent parasitaemia with a rapid decline in bodyweights. This has been reported in studies on malaria where the virulent parasites that generated highest parasite densities exploited more of the host's resources, the red blood cells (Mackinnon et al. Reference Mackinnon, Gandon and Read2008). The trypanosome species infecting the animals and the geographical location also influence the clinical picture of the disease.
Our observations showed that intermittent parasitaemia was positively associated with low virulence, indicating that the mice were able to fight the infection, gain weight with a gradual decline in PCV and survive for longer periods. This observation is consistent with previous reports (Eyob and Matios, Reference Eyob and Matios2013).
In the current study, an increase in body weight in mice infected with parasites of low virulence was observed despite the effect of infection in the majority of the animals during the early stages of infection. The increase could be related to the retention of body fluids in the form of oedema that accompanies trypanosomiasis (Steverding, Reference Steverding2008). It was shown that in rodent trypanosomiasis, there is a correlation between splenomegaly and parasitaemia; this has been demonstrated in Trypanosoma lewisi (Cherian and Dusanic, Reference Cherian and Dusanic1977).
In conclusion, the 17 T. evansi isolates investigated were able to infect mice, multiply and cause disease. The different levels of virulence exhibited may be related to the host from which the parasites were isolated as well as the geographical location from where the isolates were collected. However, the factors underlying this difference in virulence levels are yet to be elucidated using molecular techniques. Animals infected with non-RoTat T. evansi Types A (Ngaira et al. Reference Ngaira, Olembo, Njagi and Ngeranwa2005) and B (Njiru et al. Reference Njiru, Constantine, Masiga, Reid, Thompson and Gibson2006) may remain a source of infection for a long time, resulting in high mortality and morbidity further complicating the search for new diagnostics and vaccines to effectively control the disease in domestic animals.
Supplementary material
The supplementary material for this article can be found at https://doi.org/10.1017/S0031182017002359.
Acknowledgements
We thank the staff of Chemotherapy division especially B. Wanyonyi and J. Makau (posthumously) for their assistance with sample Trypanosoma processing, preparation and all animal experiments. We are grateful to Prof Reto Brun for providing T. evansi stabilates from STIB. Special thanks to the Director General KALRO for allowing us to access and use the parasites stored in the cryobank and publish this work. All authors have read and approved the final version of the manuscript.
Financial support
This work received financial support from Fogarty Global Infectious Diseases Training Grant D43TW007391, NIH R01 award AI068932 and 5T32AI007404-24 and from IAEA Contract No. 16181/RO awarded to Dr Rosemary Bateta.