INTRODUCTION
Arid northwest China, in central Asia, is climatically controlled by the westerlies, and atmospheric circulation patterns in this region play an important role in linking the North Atlantic and Asian monsoon climate (Porter and An, Reference Porter and An1995; Xiao et al., Reference Xiao, Zhang, Fan, Wen, Zhai, Tian and Jiang2018). The generally dry climate, scarce water resources, and fragile ecosystems make this region highly vulnerable to climate change, especially declines in precipitation (Narisma et al., Reference Narisma, Foley, Licker and Ramankutty2007; Sorg et al., Reference Sorg, Bolch, Stoffel, Solomina and Beniston2012). Therefore, an understanding of the variability in the westerlies and corresponding changes in moisture is vital to evaluate the current and future water resource dynamics in this region. Well-dated, high-resolution paleoclimate reconstructions from this region place current climate change within a long-term perspective and improve our ability to predict future climate and hydrologic changes.
A number of paleoclimate studies have been undertaken in northwestern China in the past two decades, at Bosten Lake (Chen et al., Reference Chen, Yu, Yang, Ito, Wang, Madsen and Huang2008), Lup Nor (Liu et al., Reference Liu, Zhang, Jiao and Mischke2016), Balikun Lake (Zhao et al., Reference Zhao, An, Mao, Zhao, Tang, Zhou, Li, Dong, Duan and Chen2015), Wulungu Lake (Liu et al., Reference Liu, Herzschuh, Shen, Jiang and Xiao2008), Manas Lake (Rhodes et al., Reference Rhodes, Gasse, Lin, Fontes, Wei, Bertrand and Gibert1996), Ebinur Lake (Wu et al., Reference Wu, Shen, Wang, Jin and Yang2005, Reference Wu, Yu, Zeng and Wang2009; Tudryn et al., Reference Tudryn, Tucholka, Gibert, Gasse and Wei2010), Sayram Lake (Liu et al., Reference Liu, Wu, Ma and Zeng2014), and in the Yili Basin (Li et al., Reference Li, Song, Lai, Han and An2016). Many of these studies focused on the Holocene, with less attention paid to environmental changes that occurred since Marine Oxygen Isotope Stage (MIS) 3. Furthermore, there is still debate regarding claims for a warm and wet MIS 3a (Shi et al., Reference Shi, Yu, Liu, Li and Yao2001; Yang and Scuderi, Reference Yang and Scuderi2010; Long and Shen, Reference Long and Shen2015), climate conditions during MIS 2 (Li and Morrill, Reference Li and Morrill2013; Yang, Reference Yang, Wang, Liu, Li, Ren, Zhang, Ma, Rioual, Jin and Scuderi2013; Zhao et al., Reference Zhao, An, Mao, Zhao, Tang, Zhou, Li, Dong, Duan and Chen2015), and the phase relations between arid central Asia and wet monsoon Asia (Chen et al., Reference Chen, Yu, Yang, Ito, Wang, Madsen and Huang2008; Xiao et al., Reference Xiao, Haberle, Shen, Yang, Han, Zhang and Wang2014; Cai et al., Reference Cai, Chiang, Breitenbach, Tan, Cheng, Edwards and An2017). Consequently, there is no consensus about the mechanisms of past climate and environmental change in this region. Additional well-dated, high-resolution sediment records from this region are needed to address these issues.
Ebinur Lake is located in the western part of the Junggar Basin, northern Xinjiang Province. The water body is located far from ocean influence, and local climate is dominated by the westerlies. The lake is situated ideally for study of past changes in the westerlies and moisture availability. Holocene climate and environmental conditions in the Ebinur Lake region have been studied (Wu et al., Reference Wu, Shen, Wang, Jin and Yang2005, Reference Wu, Yu, Zeng and Wang2009; Ma et al., Reference Ma, Wu, Abuduwaili and Liu2016). Magnetic minerals from the lake basin and paleovegetation in the region since the last deglaciation have also been investigated (Tudryn et al., Reference Tudryn, Tucholka, Gibert, Gasse and Wei2010). Pollen data from Ebinur Lake sediments indicate that Holocene paleoclimate around Ebinur Lake is consistent with what has been inferred for the broader region. Lack of paleo information on the Late Quaternary, however, limits our understanding of key issues. We therefore sought to extend the paleoclimate record from Ebinur Lake into the Late Quaternary, using a well-dated sediment core (EB). Principal component analysis (PCA) of element data was used to identify provenance of detrital materials in the lake sediments. End-member model analysis (EMMA) of grain-size data was used to explain sediment transport processes and depositional environments, and combined with the results of element PCA, lake development and climate changes were inferred. Our findings from Ebinur Lake, in conjunction with other paleoclimatic records, provide new perspectives on Late Quaternary climate changes in arid central Asia and the mechanisms that drive them.
STUDY AREA
Ebinur Lake (44°54′–45°08′N, 82°35′–83°10′E; 190 m above sea level) is a terminal water body that is situated in the arid region of northwestern China, near the border with Kazakhstan (Fig. 1a). The lake is located on a plain that is bordered by Ala Mountain on the north and northwest, Boer Tala Valley to the west, the Jing River pluvial fan in the south, and sand dunes around the Kuitun River to the east (Fig. 1b). The lake has a drainage basin area of 50,321 km2, including 24,317 km2 of mountainous area and 25,672 km2 of low-lying areas (Ma et al., Reference Ma, Wu, Abuduwaili and Liu2016). The lake receives most of its hydrologic input from the Bo and Jing Rivers, which originate from precipitation and meltwater in the mountains. The surface area of the lake was ~1070 km2 in AD 1950 but later underwent rapid contraction. In AD 1972, the lake area decreased to 589 km2. In the late 1990s, Ebinur Lake began to expand again but then shrank sharply since AD 2004 (Ma et al., Reference Ma, Wu, Abuduwaili and Liu2016). Today, the lake has a surface area of 542 km2, with a maximum depth of 3.5 m and a mean depth of 1.2 m. Total dissolved solids in the lake have ranged from 85 to 124 g/L (Wu et al., Reference Wu, Yu, Zeng and Wang2009).

Figure 1. Location maps. (a) Location of Ebinur Lake (yellow square) and other paleoclimate sites mentioned in the text including lake sediment records (yellow circles) from the following: 1, Van Lake (Stockhecke et al., Reference Stockhecke, Timmermann, Kipfer, Haug, Kwiecien, Friedrich, Menviel, Litt, Pickarski and Anselmetti2016); 2, Caspian Sea (Kislov et al., Reference Kislov, Panin and Toropov2014); 3, Aral Sea (Boomer et al., Reference Boomer, Aladin, Plotnikov and Whatley2000); 4, Issyk-Kul Lake (Ricketts et al., Reference Ricketts, Johnson, Brown, Rasmussen and Romanovsky2001); 5, Manas Lake (Rhodes et al., Reference Rhodes, Gasse, Lin, Fontes, Wei, Bertrand and Gibert1996); 6, Wulungu Lake (Liu et al., Reference Liu, Herzschuh, Shen, Jiang and Xiao2008); 7, Balikun Lake (Zhao et al., Reference Zhao, An, Mao, Zhao, Tang, Zhou, Li, Dong, Duan and Chen2015); 8, Bosten Lake (Chen et al., Reference Chen, Yu, Yang, Ito, Wang, Madsen and Huang2008); 9, Lop Nor (Liu et al., Reference Liu, Zhang, Jiao and Mischke2016); 10, Qinghai Lake (Zhou et al., Reference Zhou, Liu, Wang, An, Cheng, Zhu and Burr2016); the loess record (blue circle, 11) in the Yili Valley (Li et al., Reference Li, Song, Lai, Han and An2016); and the stalagmite record (red circle, 12) from Kesang Cave (Cai et al., Reference Cai, Chiang, Breitenbach, Tan, Cheng, Edwards and An2017). (b) Hydrologic conditions of Ebinur Lake. (c) EB core site (red star) and locations of surface samples S1–S8. (For interpretation of the references to color in this figure legend, the reader is referred to the web version of this article.)
Climate of the study region is dominated by the westerlies and is strongly continental, as indicated by high-amplitude fluctuations in annual and daily temperatures (mean annual temperature 7.8°C). Mean annual precipitation (95 mm) is much less than mean annual potential evaporation (1315 mm), resulting in an extremely arid climate. Modern vegetation in the Ebinur Lake region is characterized by temperate desert taxa (Wu et al., Reference Wu, Yu, Zeng and Wang2009).
MATERIALS AND METHODS
Core collection and dating
A 14.8-m-long core (EB) was collected from the northwest part of the Ebinur Lake in December 2013, using an X-1 100 m power drill. In addition, surface samples from the Ebinur Lake basin were collected in August 2017, to serve as reference material for grain-size analysis (Fig. 1c, S1–S8). The sediment core was split lengthwise for nondestructive X-ray fluorescence (XRF)–scanning analysis in the laboratory at Lanzhou University and then subsampled at 1 cm intervals in clay layers and at 5 cm intervals in sand layers. Chronology for the EB core was established using five accelerator mass spectrometry (AMS) radiocarbon dates on bulk organic matter, measured at Beta Analytic Inc. (Miami, FL, USA) and five optically stimulated luminescence (OSL) dates, measured at Nanjing University.
For OSL age determination, fine-grained quartz was selected as the dating material because there is no anomalous fading in quartz dating (Lai, Reference Lai2010). Pretreatment of OSL samples was conducted under subdued red light. Both ends of the sample were removed and used for analysis of the dose rate, and the remaining material from the core center was used for equivalent dose (D e) determination. Each sample was first treated with 30% H2O2 and 10% HCl to remove organic matter and carbonates, respectively. After being washed three to four times with distilled water, the 4–11 μm fraction was separated, according to Stokes's law. The prepared polymineral samples were etched with 35% H2SiF6 to dissolve feldspars, followed by 10% HCl to remove fluoride precipitates. Purity of the quartz was determined using the OSL-infrared depletion ratio method (Duller, Reference Duller2003). Then, the separated 4–11 μm quartz grains were settled on aluminum discs and measured on a Risø TL/OSL-DA-20 reader that was equipped with a 90Sr/90Y beta-source (Bøtter-Jensen et al., Reference Bøtter-Jensen, Thomsen and Jain2010). The OSL signal was detected using a Schott U-340 filter. For D e determination, a single aliquot regenerative-dose protocol (Murray and Wintle, Reference Murray and Wintle2003) was applied with a preheat temperature of 240°C and a cut heat of 200°C combination based on the preheat plateau and dose recovery tests. The dose rate was determined mainly from measurements of the concentrations of uranium (U), thorium (Th), and potassium (K) from the sedimentary environment and the estimated cosmic ray contribution. The content of radioactive elements was analyzed by neutron activation analysis. The cosmic ray dose rate was estimated for each sample, as a function of depth, altitude, and geomagnetic latitude. Water content was figured as the ratio of the weight of water in the sediment to the total weight of wet sediment, and it is expressed as a percentage.
Grain-size analysis and end-member modeling
All samples for grain-size analysis were pretreated with 10% H2O2 to remove organic matter and 10% HCl to remove carbonates, and they were dispersed with 5% (NaPO3)6 by ultrasonic treatment prior to measurement. The grain-size distribution was measured with a Malvern Mastersizer 2000 laser diffraction instrument with 100 bins ranging from 0.02 to 2000 μm, at the State Key Laboratory of Lake Science and Environment, Nanjing Institute of Geography and Limnology, Chinese Academy of Sciences. Robust EMMA (Dietze et al., Reference Dietze, Hartmann, Diekmann, Ijmker, Lehmkuhl, Opitz, Stauch, Wünnemann and Borchers2012), which applies principles of eigenspace analysis and different scaling procedures of eigenspace analysis, was carried out with 348 samples, using the open-source software R and the package EMMAgeo version 0.9.0 (Dietze and Dietze, Reference Dietze and Dietze2013). Hence, end-member loadings can be interpreted in terms of individual grain-size subpopulations and scores that represent the contribution of these subpopulations to the samples.
Elemental analyses
Elemental composition in the core was obtained with an Avaatech XRF core scanner at Lanzhou University. The exposed surface of the split core was carefully flattened and covered by Ultralene film (4 μm). Analysis was conducted on a 0.5-cm-wide channel with an X-ray current of 1 mA, at 15 s count time and 10 kV X-ray voltage for measurement of Al, Si, Cl, K, Ca, Pb, Fe, Mn, and Cu. XRF results are expressed in counts per second (cps), and only chemical elements with means >1500 cps were considered to be statistically significant. Intensities of light elements (Al, Si, and K) are affected by water content (Tjallingii et al., Reference Tjallingii, Röhl, Kölling and Bickert2007), and we assessed the impact of water content on Al, Si, and K, using Cl intensity (AlCl, SiCl, and KCl). PCA was applied to the XRF results to determine the main environmental processes that control the input, distribution, and deposition of sediment in the lake.
RESULTS
Lithology and chronology
Detailed descriptions of the lithology are provided in Figure 2. Sediments of the EB core can be divided into two main lithofacies. From 14.8 to 8.0 m depth, the core is composed mainly of sand, which is interrupted by thin gray silty-clay layers at 14.15–14.00 m, 12.55–12.45 m, 11.7–11.6 m, and 8.2–8.0 m and by a brown clay layer at 10.55–9.80 m. Between 8.0 and 0.0 m, the core is dominated by gray clay, which is interrupted by two gray, silty-clay layers at 4.22–3.60 m and 1.47–1.42 m and two brown clay layers at 5.60–5.15 m and 0.9–0.0 m. Changes in lithology clearly correspond to stratigraphic changes in grain size and magnetic susceptibility (Fig. 2).
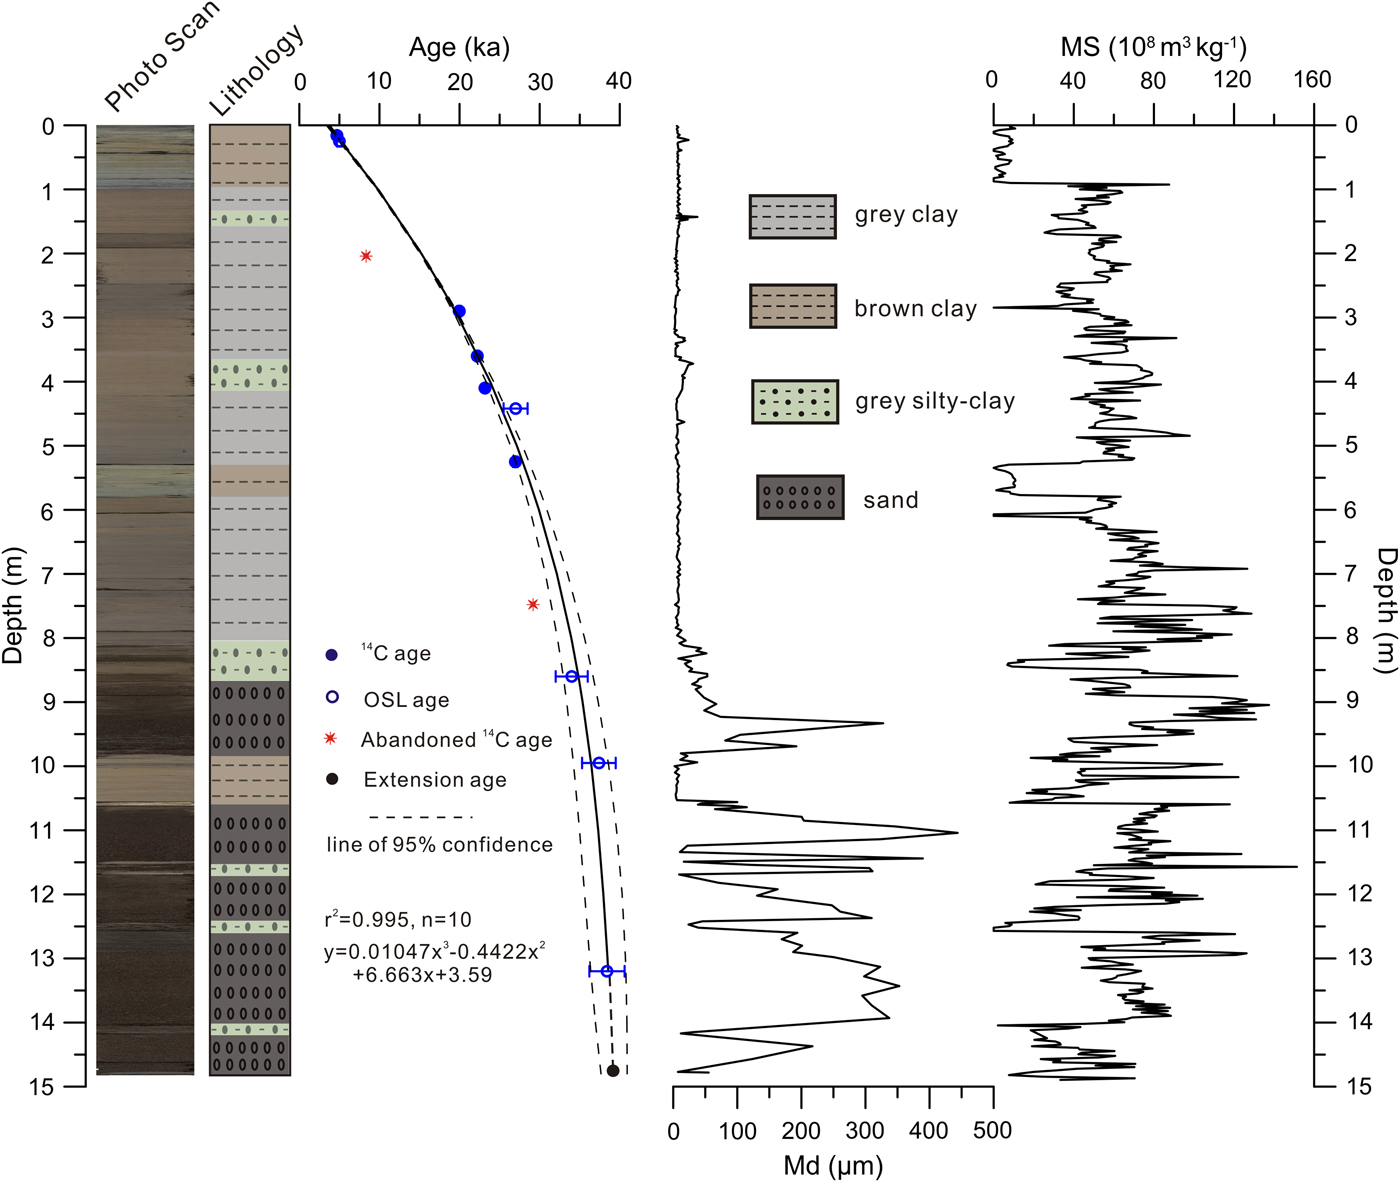
Figure 2. (color online) Photograph, lithology, and chronology of the EB core based on optically stimulated luminescence (OSL) ages and 14C ages. Median grain-size (Md) and magnetic susceptibility (MS) profiles are also shown.
The seven AMS 14C dates and five OSL dates are shown in Figure 2 and Table 1. Radiocarbon ages of the seven samples were calibrated to calendar years before present (AD 1950) with Calib 7.0 software, using IntCal13 (Reimer et al., Reference Reimer, Baillie, Bard, Bayliss, Beck, Blackwell and Bronk Ramsey2013). The OSL ages of the five samples were corrected to AD 1950 for comparison with radiocarbon ages. We combined the AMS 14C ages and OSL ages to develop a chronology for the sediment core. A third-order polynomial best describes the age-depth model. The AMS 14C dates at 2.05 and 7.51 m appear too young relative to ages from their respective contiguous strata. If these two sample ages are included in the model (n = 12), the dates are 3500–6000 yr younger than the modeled age curve and lie outside of the 95% confidence range. Thus, these two dates were omitted from the model, and the final age-depth model used the remaining five AMS 14C ages and five OSL ages (n = 10; Fig. 2). The regression has a high r 2 value (r 2 = 0.995) and is thought to describe the age-depth relationship well (Colman et al., Reference Colman, Rosenbaum, Kaufman, Dean and McGeehin2009). Extrapolated model ages at the bottom and the top of the sediment core were 39.2 and 3.6 ka, respectively. Because the coring location is seasonally dry today and affected by strong winds throughout the year, lack of sediment that postdates ca. 3.6 ka is probably a consequence of recent eolian erosion. Given the similar dates produced by OSL at 25 cm (5.0 ka) and AMS 14C at 16 cm (4.69 cal ka BP) in the upper part of the core, the impact of the reservoir effect (RE) on 14C dates is thought to be small. RE is a common problem in radiocarbon dating of lacustrine sediments (Lockot et al., Reference Lockot, Ramisch, Wünnemann, Hartmann, Haberzettl, Chen and Diekmann2015), especially in carbonate terrains. Aquatic plant fossils can be subject to RE through incorporation of “old” dissolved inorganic carbon from lake waters, whereas terrestrial plant remains in sediments are believed to provide reliable ages (Albéric et al., Reference Albéric, Jézéquel, Bergonzini, Chapron, Viollier, Massault and Michard2013). REs in lakes of western China range from a few hundred to thousands of years. For example, REs in Tuolekule Lake and Qingtu Lake are relatively small, about 200 yr (An et al., Reference An, Zhao, Tao, Lv, Dong, Li, Jin and Wang2011; Long et al., Reference Long, Lai, Wang and Zhang2011). Ebinur Lake has a drainage basin area of 50,321 km2, and sediment organic matter comes mainly from terrestrial plant material transported by rivers, suggesting a relatively small RE (Wu et al., Reference Wu, Yu, Zeng and Wang2009). The sediment core spans the period from 39.2 to 3.6 ka, with an average sedimentation rate of 0.64 mm/yr for the interval from 14.8 to 8.0 m and of 0.26 mm/yr for the interval between 8.0 and 0.0 m, which is consistent with abrupt changes in the lithology and other variables (e.g., grain size; Fig. 2).
Table 1. Details of radiocarbon and optically stimulated luminescence (OSL) dating for the core from Ebinur Lake. AMS, accelerator mass spectrometry.

aRejected 14C age.
Grain-size data
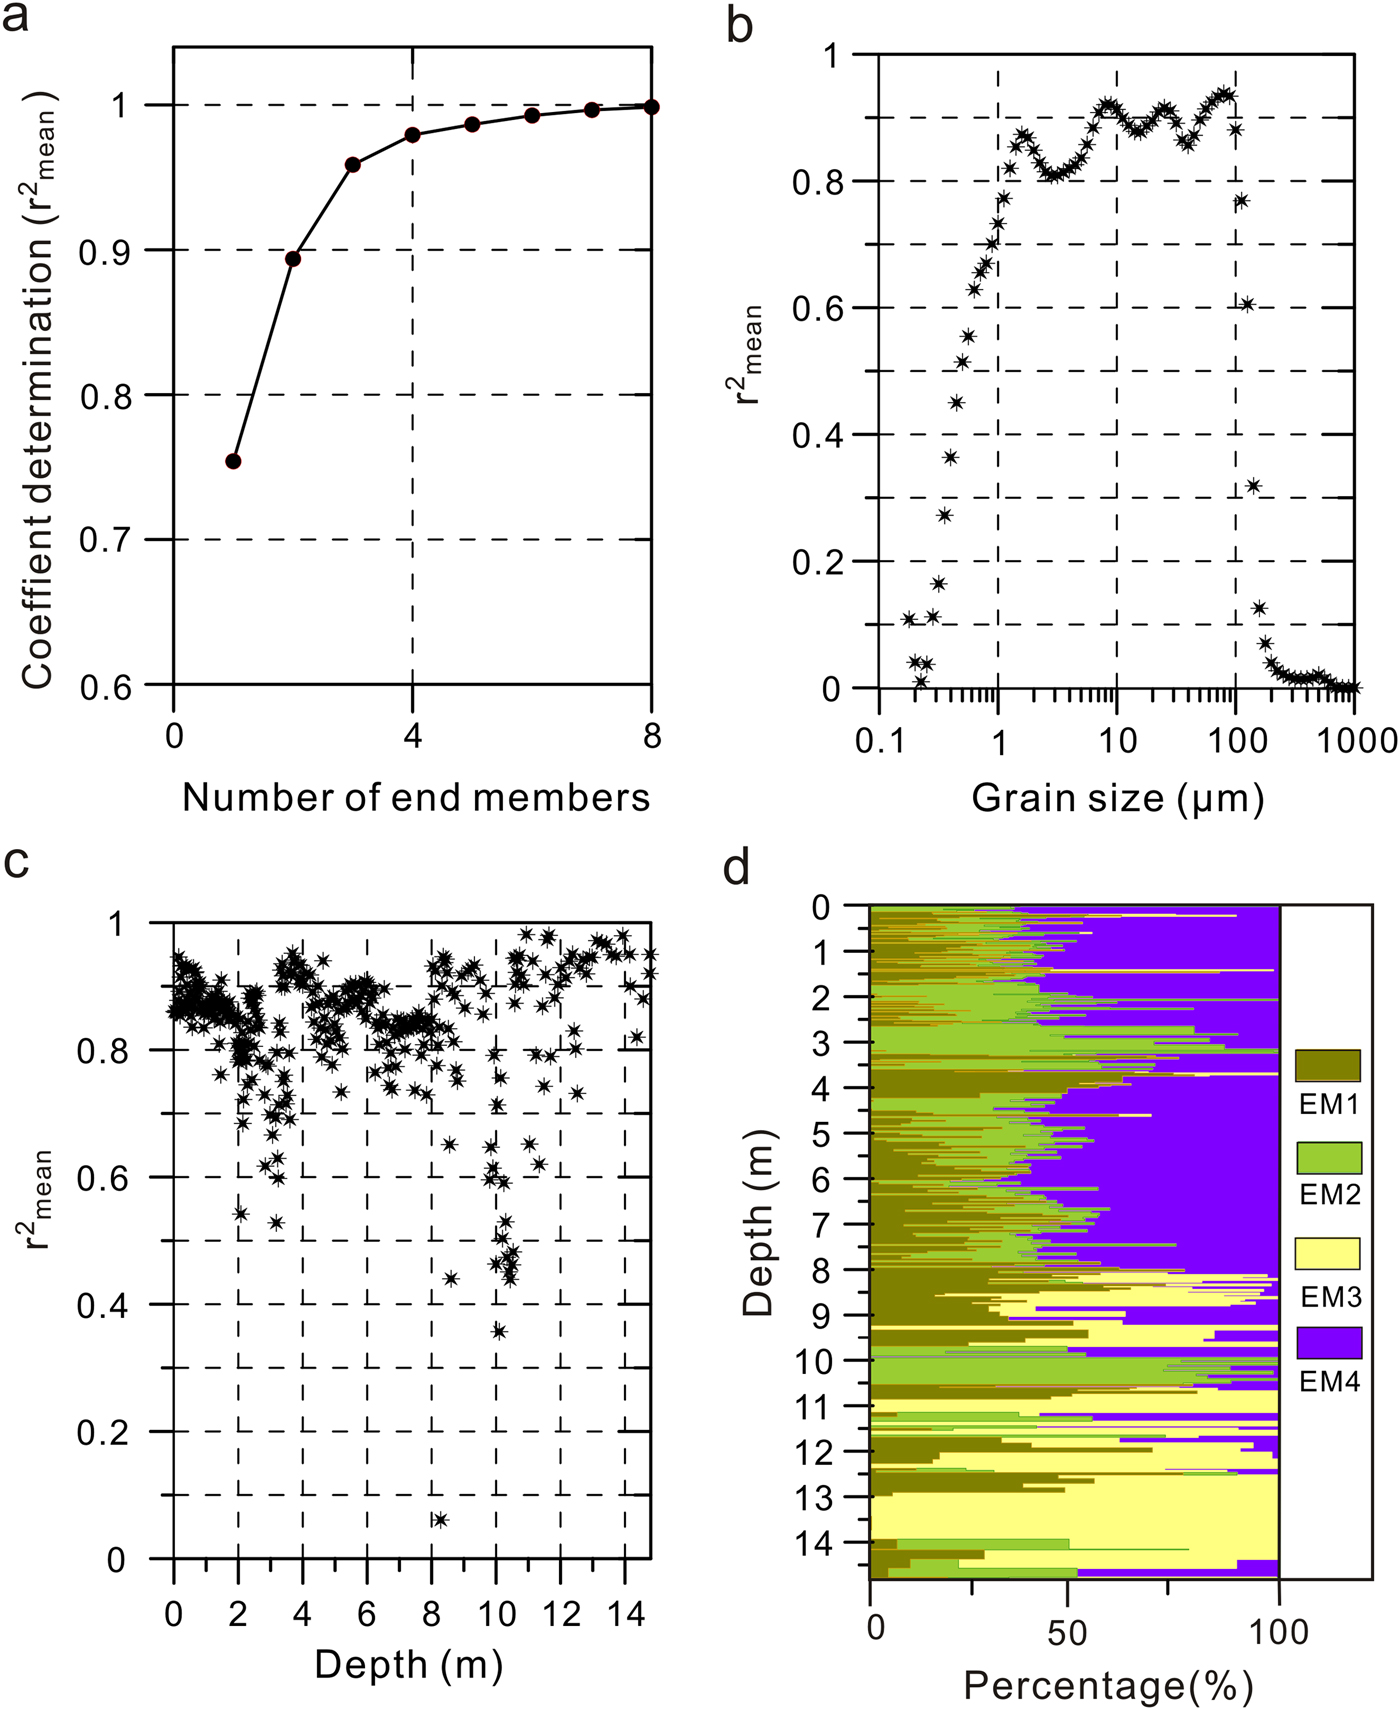
The frequency curve for a grain-size distribution produced during a single sedimentation event or transport process is usually unimodal, whereas the involvement of more than one sedimentation or transport process during sediment formation may yield a polymodal distribution. By utilizing mathematical methods, such as end-member analysis, specific transport and deposition processes can be recognized in sediments with a polymodal distribution (Dietze et al., Reference Dietze, Hartmann, Diekmann, Ijmker, Lehmkuhl, Opitz, Stauch, Wünnemann and Borchers2012). Results of end-member analysis are shown in Figure 3. The mean coefficient of determination (r 2mean) of grain size increased when the number of applied end members increased (Fig. 3a). A four-end-member model explains 97% of the variance in grain-size distribution (Fig. 3a). The coefficient of determination (r 2mean) is plotted against sediment depth and grain size in Figure 3, panels (b) and (c), respectively. The four-end-member model shows goodness-of-fit statistics for grain-size classes (mean r 2 = 0.58) and sediment samples at different depths (mean r 2 = 0.84). This indicates that the data are well represented by the model. Goodness-of-fit statistics did not improve significantly when more end members were used, indicating the four-end-member model is optimal. The down-core record of relative end-member contributions is shown in Figure 3d. On average, end member (EM) 1, EM2, EM3, and EM4 represented 20.6%, 22.5%, 10.2%, and 46.7%, respectively, of the total sediment composition. Differences in scores for the four end members divide the core into two parts, with the interval from 14.8 to 8.0 m dominated by the EM3 end member and the interval from 8.0 to 0.0 m dominated by the other end members (Fig. 3d).

Figure 3. (color online) End-member modeling results for the Ebinur Lake sediment core. (a) Mean coefficient of determination (r 2mean) of all size classes for each end-member model. (b) Coefficients of determination for each size class of the model with four end members. (c) Coefficients of determination for sediment samples with four end members. (d) End-member scores show the proportion of variance explained by four end members for each sediment sample.
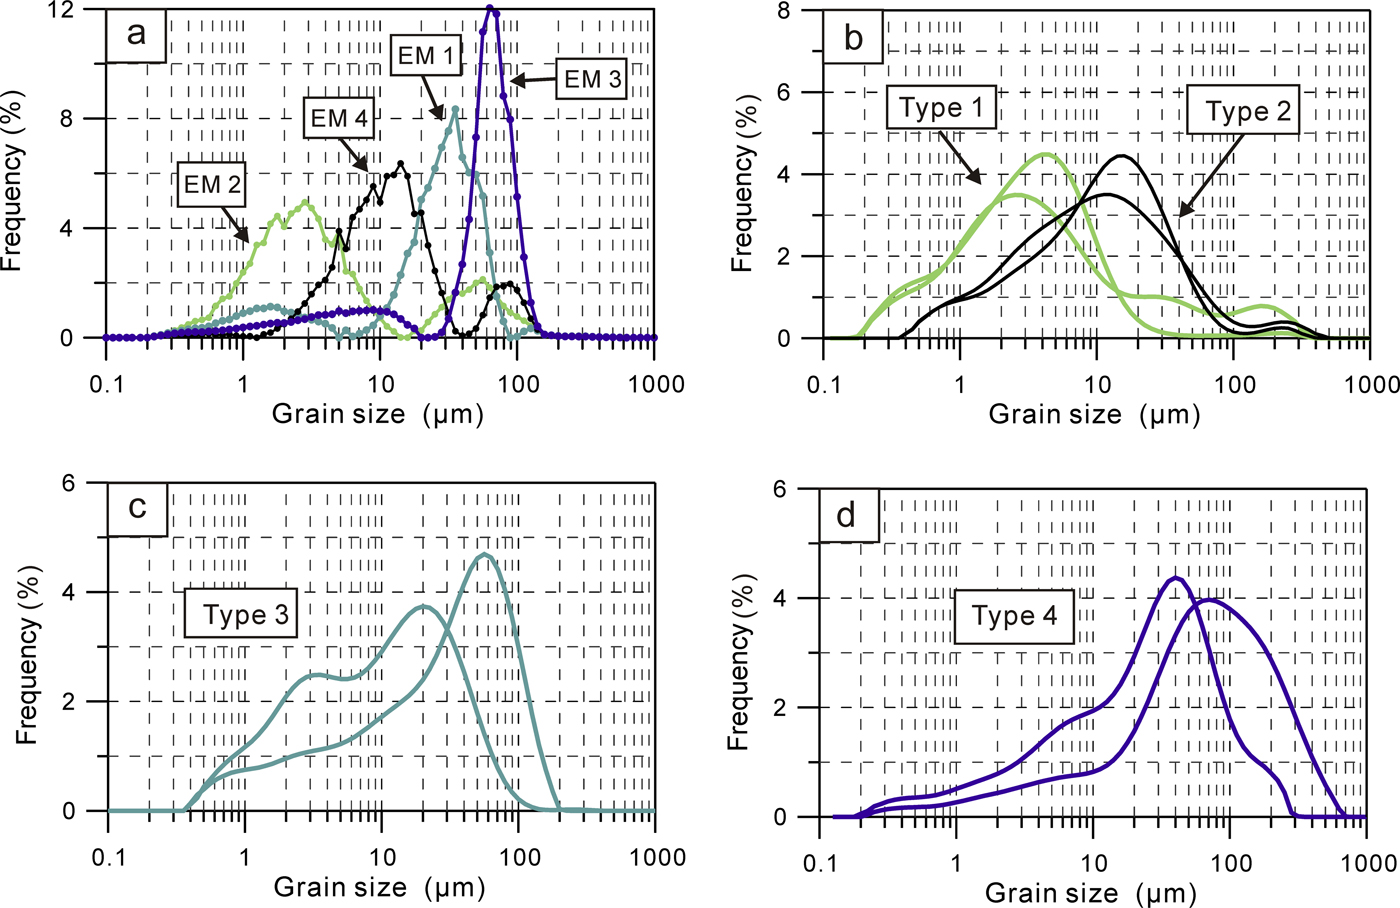
EM1 has a bimodal distribution, with a prominent peak centered at 20–70 μm and a minor peak centered at <4 μm (Fig. 4a). Analyses of modern eolian deposits show that two main grain-size distributions exist in the Ebinur Lake region (Fig. 1c, S1 and S2; Fig. 4c, type 3). One has a bimodal distribution with two apparent peaks centered at <4 μm and 22 μm, grain sizes that may be transported by wind over long distances; the other shows a unimodal distribution with a peak centered at 30–90 μm. Particles in that size range can be transported by strong winds and reveal intense, local eolian activity (Qiang et al., Reference Qiang, Chen, Zhang, Zu, Jin, Zhou and Xiao2007). EM1 has a distribution similar to a mixture of the two modern distributions and indicates the strength of the winds that transported eolian material.

Figure 4. (color online) Results of the optimal end-member model and individual grain-size distributions of surface samples. (a) Grain-size distributions of end member (EM) 1, EM2, EM3, and EM4. (b) Grain-size distributions of surface sediments of Ebinur Lake. (c) Grain-size distributions of eolian samples collected in the Ebinur Lake area. (d) Grain-size distributions of floodplain deposits of the Bo River and Jing River.
EM2 also has a bimodal distribution, with a prominent peak centered at 2–4 μm and a minor peak centered at 35–70 μm (Fig. 4a). EM2 contributes to the sediment composition (i.e., scores), primarily from 10.55 to 9.80 m and 3.6 to 2.0 m. The fine-grained particles (<4 μm) could have been transported as suspended material in river water and deposited in the relatively stagnant water of the lake (Qiang et al., Reference Qiang, Chen, Zhang, Zu, Jin, Zhou and Xiao2007), which is in accordance with grain-size distributions of deposits collected from a modern, closed-basin, low-energy lake environment (Fig. 1c, S3 and S4; Fig. 4b, type 1). EM2 is interpreted to represent sediments that were deposited in a low-energy lake environment. The greater abundance of EM2 in the sediment core indicates a weakening of lake energy.
EM3 contains well-sorted sediments and shows a narrow peak centered at 50–100 μm (Fig. 4a). The down-core scores show high average contributions of EM3 in the intervals 14.80–10.55 m and 9.8–8.0 m. The grain-size distributions of two surface samples collected from the floodplains of the Bo and Jing Rivers also have a single peak that is centered at 50–200 μm (Fig. 1c, S5 and S6; Fig. 4d, type 4). Therefore, EM3 is interpreted as having been deposited by high-energy fluvial transport processes, and the content of EM3 is viewed as an indication of river input.
EM4 has a bimodal distribution, with a major peak centered at 10–20 μm and a minor peak centered at 50–150 μm (Fig. 4a). Its score is generally high in the intervals 8.0–4.2 m and 3.6–1.6 m. Compared with modern samples collected from an open, deep-water environment (Fig. 1c, S7 and S8; Fig. 4b, type 2), EM4 is interpreted as having been deposited in a high-energy lake environment, and the abundance of EM4 in the sediment core indicates strengthening of lake energy.
Element geochemistry
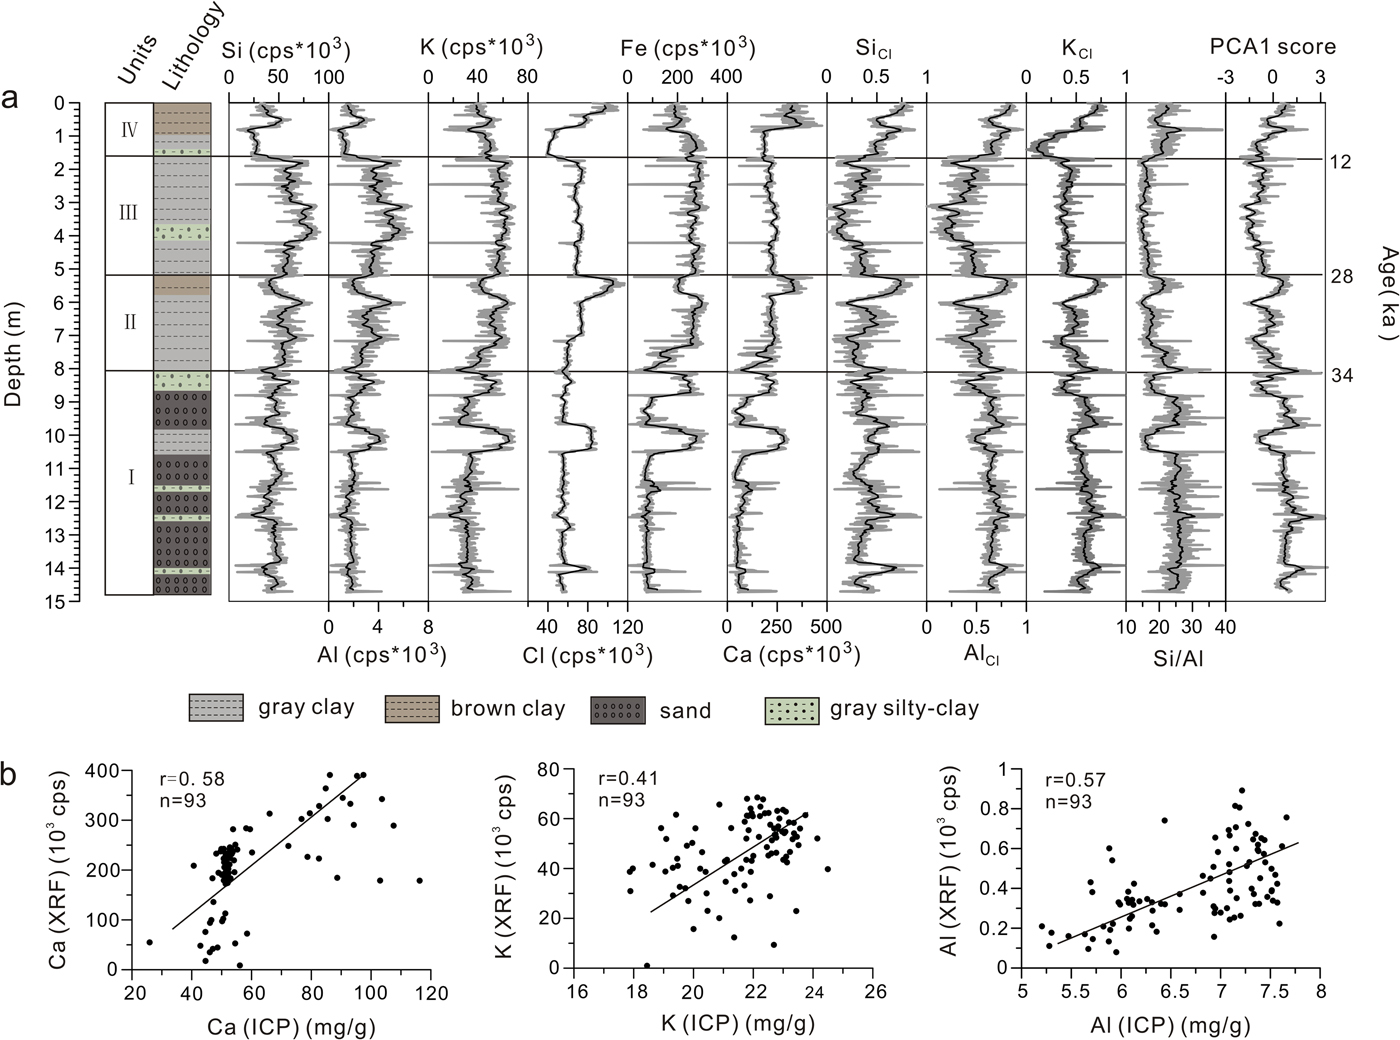
Element results from the XRF core scanner are shown in Figure 5a. Given their low and highly variable character, values for Mn, Cu, and Pb were eliminated from consideration in the interpretation. Comparisons of XRF data to results for key elements (Ca, K, and Al) obtained using inductively coupled plasma mass spectrometry show significant correlations in all cases (Fig. 5b), supporting the reliability of the XRF measurements. Down-core profiles of all elements correspond closely with the facies distribution: (1) Si, Al, and K contents vary but display higher values in sand and gray silty clay; and (2) Ca, Cl, and Fe display higher values in brown clay and gray clay (Fig. 5a).

Figure 5. (color online) (a) X-ray fluorescence (XRF) data measured by the core scanner. (b) Correlation plots of inductively coupled plasma (ICP) and XRF measurements for Ca, K, and Al. cps, counts per second.
An R-type cluster analysis was carried out in SPSS 18.0, using the element data set. The elements can be classified into two groups: Si, Al, and K (Group A) and Ca, Cl, and Fe (Group B; Fig. 6a). PCA was also carried out using the element data set. The first eigenvector of the PCA (PCA1) accounts for 54.6% of the total variance and is characterized by high scores for Si, Al, and K (Fig. 6b). The second eigenvector of the PCA (PCA2) accounts for 30.5% of the total variance and is characterized by high scores for Ca, Fe, and Cl. The other eigenvectors defined by the PCA analysis were not considered in the interpretation of geochemical variability because they explain low percentages of the total variance (<15%). The PCA analysis supports the inference that Al, Si, and K have a common origin, probably related to their occurrence in silicates, and PCA1 thus represents clastic input. Behavior of Ca and Cl suggests they occur in carbonates and halite, respectively; thus PCA2 represents mainly deposition of CaCO3 and NaCl.

Figure 6. (a) Dendrogram using average linkages (between groups) of the six elements (Ca, Fe, Cl, Si, Al, and K) measured in the EB core. (b) Biplot of principal component analysis (PCA) for the first two principal components, showing loadings for each analyzed element.
DISCUSSION
Environmental significance of the sediment variables
Because Ebinur Lake is pan shaped and has a flat bottom, a small change in lake level has a large effect on lake area. Such changes in lake stage, in turn, affect the grain-size composition of sediments, which reflect their sedimentary environment. Thus, the distribution of grain sizes in a sample can be interpreted as resulting from interactions of multiple transport and sedimentation processes. Components of sediment grain-size distribution can be determined by mathematical methods and utilized to reveal characteristics of the sedimentary environment and to infer paleoclimate conditions.
Four robust end members, EM1 to EM4, were separated by EMMA and compared with surface samples from different sedimentary environments. Both EM2 and EM4 are closely related to lake energy conditions, and we therefore used EM2 and EM4 as indicators of lake energy variation.
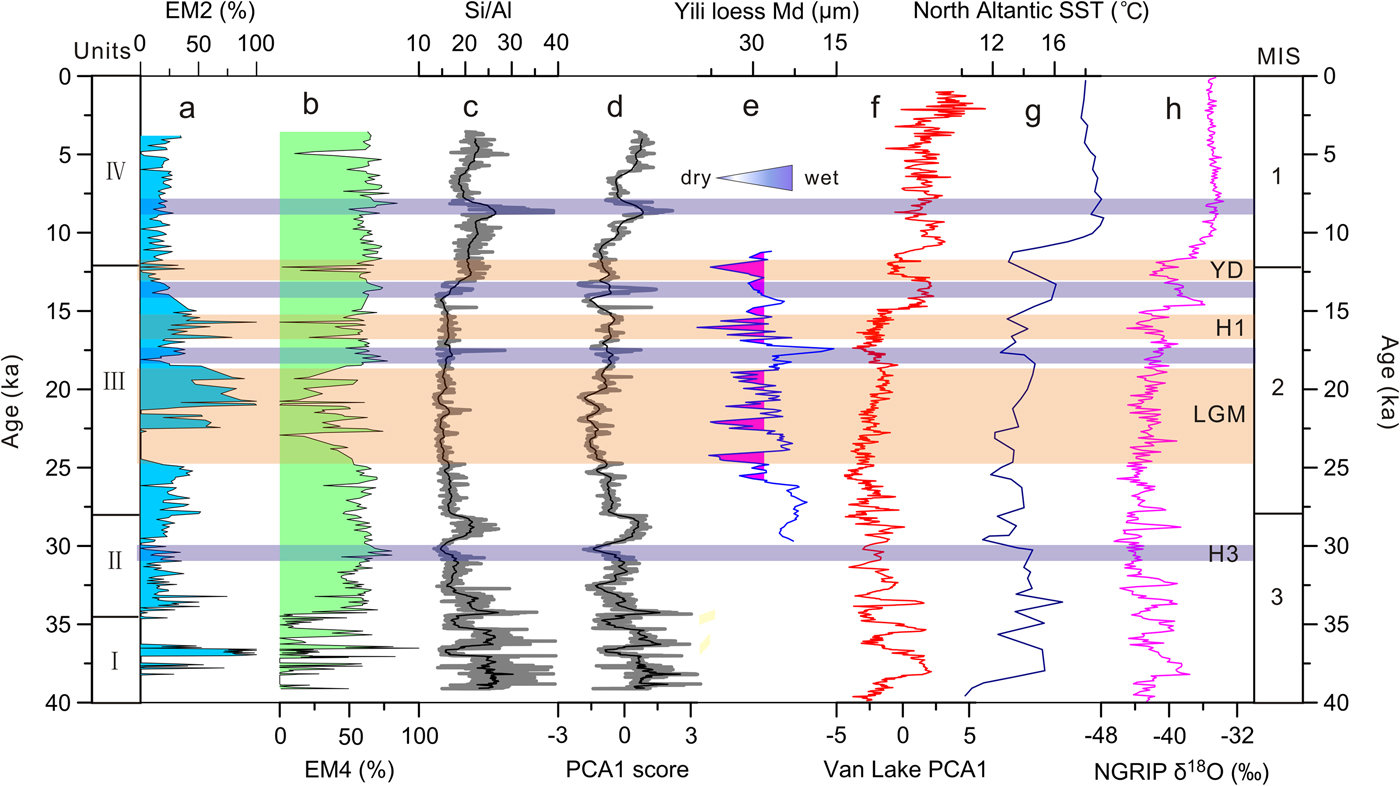
EM2 was assigned to very slow-moving water in nearshore wetlands, similar to conditions in some environments that exist today. During periods of relatively high lake level (e.g., AD 1950; Fig. 1c), the core site was located in an open-lake area, whereas during low stands, the northwest part of the lake where the EB sediment core was collected would have been a nearshore wetland. Therefore, an increase in EM2 probably indicates a decline in lake level. Higher lake levels, on the other hand, are represented by EM4 and show an inverse relationship to EM2 since 34.0 ka, indicating that EM4 is positively correlated with lake level. Variations of EM2 and EM4 show that the lake level fluctuated dramatically from 39.2 to 34.0 ka. Higher lake levels existed from 34.0 to 23.0 ka and 9.0 to 5.0 ka, and extremely low lake levels prevailed from approximately 23.0 to 18.0 ka, 17.0 to 15.0 ka, and ca. 12.5 ka (Fig. 7).

Figure 7. Comparisons of Ebinur Lake sediment variables with regional paleoclimatic records over the last 40 ka. (a) Content of end member (EM) 2 in the EB core. (b) Content of EM4 in the EB core. (c) Si/Al values in the EB core. (d) Principal component analysis 1 (PCA1) score for the EB core. (e) Median grain size (Md) of the loess section from the Yili Basin, central Asia (Li et al., Reference Li, Song, Lai, Han and An2016). (f) PCA1 score from Van Lake, Turkey, indicating changes in precipitation (Stockhecke et al., Reference Stockhecke, Timmermann, Kipfer, Haug, Kwiecien, Friedrich, Menviel, Litt, Pickarski and Anselmetti2016). (g) Sea surface temperatures (SSTs) in the North Atlantic Ocean (Bard, Reference Bard2002). (h) North Greenland Ice Core Project (NGRIP) ice core δ18O values (North Greenland Ice Core Project members, 2004). The light-blue areas represent periods with higher lake levels, and the light orange areas represent periods with lower lake levels. (For interpretation of the references to color in this figure legend, the reader is referred to the web version of this article.)
The sedimentation processes reflected by the EMs coincide well with the element PCA1 score, which represents terrigenous clastic input and the Si/Al ratio (Fig. 7). The Si/Al ratio was used as a proxy for the ratio of quartz and feldspars to aluminosilicates (clay minerals; Bouchez et al., Reference Bouchez, Gaillardet, France-Lanord, Maurice and Dutra-Maia2011) and may be linked to hydrologic conditions (Grygar et al., Reference Grygar, Mach, Schnabl, Pruner, Laurin and Martinez2014), as higher-intensity inflow would carry more quartz and feldspar in the silt and sand, resulting in a higher Si/Al ratio. This interpretation is further supported by the coherent variation between the Si/Al ratio and the element PCA1 score, as terrigenous detrital material was mainly transported to the lake by river inflow. In terminal lakes of arid regions, such as Ebinur Lake, hydrologic variations control the amount of water that enters the lake and result in lake-level changes that can be inferred from EM4, thus leading to the generally similar trends in Si/Al ratio and content of EM4 since 34.0 ka (Fig. 7). Therefore, we used the Si/Al ratio as a proxy for the hydrodynamic conditions of inflow into the lake. According to Figure 7, relatively lower hydrodynamic conditions (reduced inflow) existed ca. 36.8 ka, 34.5 ka, and from 28.0 to 13.0 ka.
Environmental and climatic inferences
Past lake level of Ebinur Lake can be inferred from EM4, whereas hydrodynamic conditions of inflow and terrigenous input can be interpreted from the Si/Al ratio and the element PCA1 score. Generally consistent trends between EMMA and elemental analysis results enabled us to infer developmental processes in Ebinur Lake, with a strong relationship between sedimentary environment and climate fluctuations between 39.2 and 3.6 ka. Climate changes and shifts in the sedimentary environment in the Ebinur Lake region can be divided into four stages.
Stage I (39.2–34.0 ka)
During this stage, the content of EM4 was generally low but fluctuated dramatically (0–95%), whereas the Si/Al ratio and PCA1 score were higher and stable (Fig. 7). Contrasting trends among PCA1, Si/Al ratio, and EM4 suggest an unstable sedimentary environment. Lake level was extremely low, the core location was affected by river inflow, and the period was characterized by higher terrigenous clastic input and stronger hydrodynamic conditions of inflow. The climate was probably wet during this time, but it was interrupted by three dry events corresponding to ca. 38.5 ka, ca. 36.8 ka, and ca. 34.5 ka, as indicated by very low values of EM4, together with the relatively low values of the Si/Al ratio and PCA1 score. Afterward, the EM4 values rose rapidly, indicating the initial formation of Ebinur Lake.
Stage II (34.0–28.0 ka)
Ebinur Lake formed early in this stage and maintained stable, high water level, as reflected by the high content of EM4 (58% on average; Fig. 7). The Si/Al ratio and the PCA1 score decreased to some extent, indicating a decrease in clastic input and smaller influence of inflow on the core location. This, however, does not mean that the amount of water entering the lake decreased. On the one hand, the Si/Al ratio and the PCA1 score were still higher than the mean value; on the other hand, the decrease in clastic input and hydrodynamic forces may have been caused by a rise in lake level. Higher lake level implies a larger distance from the river mouth to the core location, which would have weakened the influence of riverine flow at the core site. Therefore, wetter climate is inferred for this time. Higher lake level appeared ca. 30.5 ka, as indicated by the higher content of EM4 (Fig. 7a), which likely corresponds to Heinrich event 3 (H3) in the North Atlantic region.
Stage III (28.0–12.0 ka)
The Si/Al ratio and PCA1 score were extremely low during this period (Fig. 7), indicating a large decrease in terrigenous clastic input and hydrodynamic conditions of inflow. The EM4 content decreased significantly (Fig. 7), with an average value of 36%, indicating a major decrease in lake level. The amount of water inflow had decreased greatly, and the regional climate had become drier. From 25.0 to 18.0 ka, in particular, the content of EM4 decreased to an average of 28%, indicating extremely low lake level and very dry climate, probably corresponding to the last glacial maximum (LGM). At ca.16.0 ka and ca. 12.5 ka, the EM4 content decreased sharply, indicating abrupt environmental changes at these two times. These events, though dated with error, suggest a correlation with Heinrich event 1 (H1) and the Younger Dryas in the North Atlantic region, respectively.
Stage IV (12.0–3.6 ka)
The content of EM4 was relatively higher during this stage, with an average value of 50% (Fig. 7). The value of the Si/Al ratio and PCA1 score also increased substantially (Fig. 7). All these measures indicate that the amount of water and clastic input increased, and the lake level rose accordingly. The highest lake level occurred at approximately 9.0 ka and decreased sharply at approximately 5.0 ka, as indicated by changes in the content of EM4. Pollen and ostracod records from the AZ section, which is close to the EB core location, indicate that the climate became warmer and wetter since 8.3 ka (Wu et al., Reference Wu, Wang and Wu1996).
Comparisons with other regional paleoclimatic records
The EB sediment core, which covers the period from 39.2 to 3.6 ka, contains a continuous, Late Quaternary record of effective moisture changes in arid northwestern China. To put the EB paleoclimate record into a broader geographic context, we compared it with other such records from the region.
The period from 39.2 to 34.0 ka corresponds to an early stage in the lake history when the sedimentary environment and related climate conditions fluctuated dramatically. Three extreme climate events occurred at ca. 38.5, 36.8, and 34.5 ka. During these three periods, very low values of EM4 content and rapid decreases in the Si/Al ratio and PCA1 score suggest low inflow to the lake and very low lake level, indicating a dry climate. The inferred dry climate during these periods is consistent with the timing of reduced precipitation in the eastern Mediterranean region (Stockhecke et al., Reference Stockhecke, Timmermann, Kipfer, Haug, Kwiecien, Friedrich, Menviel, Litt, Pickarski and Anselmetti2016; Fig. 7f) and weakening of westerly winds, as suggested by the relatively low content of dolomite from the Ili loess (Song et al., Reference Song, Zeng, Chen, Li, Chang and An2018). Furthermore, within dating error, the three dry events are also in line with the timing of relatively low North Atlantic sea surface temperatures (SSTs; Bard, Reference Bard2002; Fig. 7g) and relatively negative δ18O values of the North Greenland Ice Core Project (NGRIP) ice core (North Greenland Ice Core Project members, 2004; Fig. 7h). Consistency among the data sets enables us to infer that the dry climate conditions during the three periods were correlated to weakening of the westerly winds, a consequence of low temperatures in the North Atlantic region.
Ebinur Lake water level rose rapidly after 34.0 ka, and stage remained relatively high and stable from 34.0 to 28.0 ka, as inferred from the high EM4 content, high value of the Si/Al ratio, and high PCA1 score. We thus infer that the Ebinur Lake initially formed during this wet period. Corresponding to this period, Zhou et al. (Reference Zhou, Liu, Wang, An, Cheng, Zhu and Burr2016) reported a meltwater event at ca. 35.0 ka in Qinghai Lake, which was correlated with increasing precipitation and temperature. Indeed, warmer and wetter climate conditions were widespread over northwestern China during that time, known as the “warm and wet late MIS 3” (Shi et al., Reference Shi, Yu, Liu, Li and Yao2001; Yang and Scuderi, Reference Yang and Scuderi2010). Paleovegetation reconstructions from lacustrine sediment in Manas Lake suggest that climate was relatively wet in the basin between 37.0 and 32.0 ka (Rhodes et al., Reference Rhodes, Gasse, Lin, Fontes, Wei, Bertrand and Gibert1996).
Lacustrine sediment layers in the interior of the Taklamakan Desert imply that parts of the sand sea were wetland environments at ca. 40.0 and 30.0 ka (Yang et al., Reference Yang, Preusser and Radtke2006). Furthermore, a relatively wet climate and high lake level also existed during this period in the Tengger Desert (Zhang et al., Reference Zhang, Wünnemann, Ma, Peng, Pachur, Li, Qi, Chen, Fang and Feng2002) and the Uvs Nuur Basin (Grunert et al., Reference Grunert, Lehmkuhl and Walther2000), with locally different amplitudes and timing. Lack of robust age control and low temporal resolution of sediment records, however, create uncertainty regarding moisture conditions of late MIS 3 (Long and Shen, Reference Long and Shen2015). Our record supports the existence of a wet late MIS 3.
Variations in EM4 content indicate Ebinur Lake rose to a higher level ca. 30.5 ka (Fig. 7b). Within dating error, this corresponds to North Altantic H3. The climate condition of H3 was humid in the Ebinur Lake region, which was quite different from conditions during other Heinrich events, which were characterized by extremely low lake levels (Fig. 7). H3 has long been seen as a “problematic” Heinrich event, with a strong and prolonged climate signal but with low ice-rafted debris (IRD) concentrations (Hemming, Reference Hemming2004; Bigg et al., Reference Bigg, Levine and Green2011). Hemming (Reference Hemming2004) concluded that H3 was smaller than other such events. The uniqueness of H3 might explain why the climate condition during this period in the Ebinur Lake region was special. Similar results were reported from the Santiaguillo Basin in the Chihuahua Desert, Mexico (Quiroz-Jimenez et al., Reference Quiroz-Jimenez, Roy, Lozano-Santacruz and Giron-García2017). More attention should be paid to the causes of and regional responses to H3.
Between 28.0 and 12.0 ka, relatively low values of the Si/Al ratio and the PCA1 score suggest declining inflows to the lake, leading to generally low lake level but with some fluctuations, as reflected by the EM4 (Fig. 7b). The EM4 correlates well with the NGRIP δ18O record in terms of long-term trends and is also comparable on millennial time scales. Abrupt, large-amplitude decreases in the content of EM4 indicate marked lake-level decreases from ca. 25.0 to 18.0 ka, 16.0 ka, and 12.5 ka, which correlate well with decreases in the NGRIP δ18O values, suggesting a close link between arid central Asia and the North Atlantic region.
From 25.0 to 18.0 ka, corresponding to the LGM, the lake level was extremely low and the climate was very dry, as is evident from the very low content of EM4 and the exceedingly low value of the Si/Al ratio and PCA1 score. Climate conditions during the LGM in northwestern China are still a subject for debate. Using the ratio between precipitation and evaporation (P/E), some simulations suggest climate was even wetter during the LGM than today, in the desert areas of northwestern China (Jiang et al., Reference Jiang, Lang, Tian and Guo2011), a finding that is broadly consistent with interpretations of lacustrine and geomorphological records from the region (Yang et al., Reference Yang, Wang, Liu, Li, Ren, Zhang, Ma, Rioual, Jin and Scuderi2013). Numerous lake sediment records from northwestern China (Rhodes et al., Reference Rhodes, Gasse, Lin, Fontes, Wei, Bertrand and Gibert1996; Herzschuh et al., Reference Herzschuh, Zhang, Mischke, Herzschuh, Mohammadi, Mingram, Kürschner and Riedel2005; An et al., Reference An, Colman, Zhou, Li, Brown, Jull and Cai2012; Zhao et al., Reference Zhao, An, Mao, Zhao, Tang, Zhou, Li, Dong, Duan and Chen2015) and recent general circulation modeling (Li and Morrill, Reference Li and Morrill2013), however, suggest a cold and dry climate in this region during the LGM. Such a scenario is reflected in the stage change of Ebinur Lake during this time (Fig. 7a and b).
Despite persistent periods of extremely low lake level, there were some times characterized by rapid increases in lake stage, ca.17.5 and 13.5 ka, especially the former. The grain-size and elemental records from the Ebinur Lake sediments indicate higher lake levels at ca. 17.5 ka. The timing matches well with a significant decrease in the median grain size of a loess section from the Yili Basin, central Asia (Li et al., Reference Li, Song, Lai, Han and An2016; Fig. 7e), and a decrease in the content of >25 μm sediment from Qinghai Lake (An et al., Reference An, Colman, Zhou, Li, Brown, Jull and Cai2012). These coincident changes suggest the wet event was widely distributed across arid central Asia.
As inferred from the grain-size and elemental records, earliest Holocene climate of the Ebinur Lake region was initially relatively wet, with a decreasing moisture trend. Effective moisture increased again at approximately 9.0 ka, followed by a shift toward drier conditions at 5.0 ka. Our inferred Holocene climate conditions in the Ebinur Lake region are consistent with findings of earlier studies. Environmental proxies in the AZ section from Ebinur Lake show that the study region was characterized by humid conditions in the early Holocene and even warmer and wetter climate conditions at 8.3 ka (Wu et al., Reference Wu, Wang and Wu1996, Reference Wu, Shen, Wang, Jin and Yang2005). Indeed, a relatively wet early and middle Holocene period was confirmed by numerous lake sediment records from arid central Asia. Multiproxy records from Issyk-Kul Lake suggest a wet early Holocene period (Ricketts et al., Reference Ricketts, Johnson, Brown, Rasmussen and Romanovsky2001). Lithology and pollen records from the Yili Basin show a wet early and middle Holocene, with the early Holocene (10.6–7.6 ka) being the wettest period of the past 15.0 ka (Li et al., Reference Li, Zhao, Dodson and Zhou2011). Pollen records from the central Altai Mountains also suggest that climate was humid by 12.0 ka (Blyakharchuk et al., Reference Blyakharchuk, Wright, Borodavko, Knaap and Ammann2004). A recent record from Kesang Cave shows relatively low δ18O in stalagmites from 10.0 to 3.0 ka (Cai et al., Reference Cai, Chiang, Breitenbach, Tan, Cheng, Edwards and An2017), indicating a wet early and middle Holocene.
In summary, the grain-size and element records from Ebinur Lake indicate a wet late MIS 3, a dry MIS 2, and a wet early and middle Holocene. This pattern of environmental change is recognized in other sediment records from the Junggar Basin (Tudryn et al., Reference Tudryn, Tucholka, Gibert, Gasse and Wei2010). A similar pattern was confirmed by a sediment record from the Yili Basin, which spans the last 15.0 ka (Li et al., Reference Li, Zhao, Dodson and Zhou2011), and a stalagmite record from Kesang Cave that spans the Holocene (Cai et al., Reference Cai, Chiang, Breitenbach, Tan, Cheng, Edwards and An2017). It is at least partially consistent with the loess record from the Yili Basin, between 30.0 and 10.0 ka (Li et al., Reference Li, Song, Lai, Han and An2016; Fig. 7e). Therefore, arid northwestern China might have experienced similar environmental changes across the region during the Late Quaternary, as suggested by records from multiple sites.
The environmental changes inferred from arid northwestern China seem to extend to west-central Asia. The Aral Sea was at a low stage during the LGM and rose again at the beginning of the Holocene (Boomer et al., Reference Boomer, Aladin, Plotnikov and Whatley2000). Climate simulations show that higher stages of the Caspian Sea occurred in late MIS 3 and lower stages in the LGM (Kislov et al., Reference Kislov, Panin and Toropov2014). A precipitation index (PCA1 of multiple geochemical variables) inferred from Van Lake, Turkey, shows a trend that is largely consistent with our record from Ebinur Lake (Fig. 7f). All of these lakes are located within the midlatitude westerly belt. Furthermore, shifts in our record are nearly synchronous with changes in North Atlantic Ocean SSTs (Fig. 7g; Bard, Reference Bard2002) and the NGRIP ice core δ18O record (Fig. 7h; North Greenland Ice Core Project members, 2004), which is highlighted by the apparent response of our record to North Atlantic Heinrich events (Fig. 7). We speculate that the environmental changes in arid central Asia were influenced mainly by variations in North Atlantic SSTs through the westerlies during the Late Quaternary. During warm periods, evaporation of water vapor in the North Atlantic Ocean, Mediterranean Sea, and Caspian Sea increased; meanwhile, the northward shift of the Intertropical Convergence Zone (ITCZ) drove an intensified influence of the westerlies in the middle and high latitudes, leading to a humid phase for arid central Asia (Chen et al., Reference Chen, Yu, Yang, Ito, Wang, Madsen and Huang2008; Li et al., Reference Li, Zhao, Dodson and Zhou2011). During cooler periods, a southward shift of the ITCZ weakened westerlies and promoted dry conditions in the region.
CONCLUSIONS
A high-resolution record of grain-size and elemental data from a sediment core taken in Ebinur Lake, arid northwestern China, was used to infer past changes in lake hydrology and regional climate, spanning the period from 39.2 to 3.6 ka. EMMA of grain-size data revealed four sediment types that were linked to different sedimentary environments. EM4 reflects lake-level change, and the Si/Al ratio and PCA1 score of elemental data were utilized as indicators of hydrodynamic conditions of inflow and terrigenous input to the lake. Overall, consistent trends between results of the EMMA and elemental analysis enabled the following conclusions.
Ebinur Lake formed at ca. 34.0 ka and maintained a high stage between 34.0 and 28.0 ka, with the highest stand at approximately 30.5 ka. From 28.0 to 12.0 ka, lake level was relatively low, especially from 25.0 to 18.0 ka, ca. 16.0 ka, and ca. 12.5 ka. Higher lake level occurred at approximately 17.5 ka and 13.5 ka. The lake level rose again beginning at 12.0 ka, with the highest lake level recorded at approximately 9.0 ka. Our records indicate a wet late MIS 3, a wet early and middle Holocene period, and a relatively dry MIS 2 in currently arid northwestern China. Comparisons of the Ebinur Lake record with other regional paleoenvironmental records leads us to suggest that changes in the intensity of the westerlies, which were controlled by variations in North Atlantic SSTs, exerted tremendous influence on past lake level and environmental changes in the study region.
ACKNOWLEDGMENTS
We thank Dr. Haiao Zeng and Dr. Jilili Abuduwaili for field assistance, and Mark Brenner for editorial help. We also thank two anonymous reviewers and the editors for their helpful comments and suggestions, which improved the manuscript. This research was supported by the National Key Research and Development Program of China (No. 2017YFA0603402) and the National Science Foundation of China (No. 41671200, U1603242).