Introduction
Rapid population growth in sub-Saharan Africa (SSA) has challenged efforts for sustained growth in agricultural productivity of smallholder agriculture. Although net agricultural production in SSA has been growing since 1960, population growth has led to declines in per capita production by 21% in East Africa, 40% in Central Africa and 22% in Southern Africa. It only increased in West Africa (Pretty et al., Reference Pretty, Toulmin and Williams2011). As further area expansion is hardly possible and fertility of agricultural soils is very limited due to strong weathering, the need to sustainably enhance crop and livestock production is even more pressing (Pretty et al., Reference Pretty, Toulmin and Williams2011; Vanlauwe et al., Reference Vanlauwe, Descheemaeker, Giller, Huising, Merckx, Nziguheba, Wendt and Zingore2015). System innovations unlike single technologies such as fertilizer application or the use of new high-yielding crop varieties, are integrated packages that often combine several synergistic agronomic and management components to improve crop productivity and environmental resilience (Noltze et al., Reference Noltze, Schwarze and Qaim2012). These innovations have the potential to improve food security in developing countries as they emphasize on sustainability that cuts across the ecological, economic, social and cultural realms (Flora, Reference Flora2010). System innovations are thus critical for sustainable intensification. Following this definition integrated soil fertility management (ISFM) is claimed to maintain or even enhance soil fertility while fostering ecological resilience in an economically profitable and environmentally friendly manner (Vanlauwe et al., Reference Vanlauwe, Bationo, Chianu, Giller, Merckx, Mokwunye, Ohiokpehai, Pypers, Tabo, Shepherd, Smaling, Woomer and Sanginga2010, Reference Vanlauwe, Descheemaeker, Giller, Huising, Merckx, Nziguheba, Wendt and Zingore2015).
Despite great efforts of public and private actors for wide-scale dissemination, the uptake of ISFM in SSA has been disappointing and partial adoption is common (Nkonya et al., Reference Nkonya, Koo, Marenya and Licker2012). Constraints on ISFM adoption at the farm and household level are documented in numerous studies (Mugwe et al., Reference Mugwe, Mugendi, Mucheru-Muna, Merckx, Chianu and Vanlauwe2009; Odendo et al., Reference Odendo, Obare and Salasya2009; Guteta and Abegaz, Reference Guteta and Abegaz2016; Mponela et al., Reference Mponela, Tamene, Ndengu, Magreta, Kihara and Mango2016), but analyses on plot level constraints including soil fertility parameters determining potential yields are scarce. In this context, Noltze et al. (Reference Noltze, Schwarze and Qaim2012) showed that soil texture had a significant effect on the adoption of the SRI (system of rice intensification) in Timor Leste. Corbeels et al. (Reference Corbeels, de Graaff, Ndah, Penot, Baudron, Naudin, Andrieu, Chirat, Schuler, Nyagumbo, Rusinamhodzi, Traore, Mzoba and Adolwa2014) in their multi-scale analysis also argued that parameters drawn from different scales of analysis, including soil fertility and yield indicators, could determine the adoption of conservation agriculture (CA). Given the heterogeneous nature of African soils (Tittonell et al., Reference Tittonell, Vanlauwe, Leffelaar, Rowe and Giller2005; Vanlauwe et al., Reference Vanlauwe, Tittonell and Mukalama2007), we hypothesized that soil fertility indicators have an influence on ISFM adoption. This study hence seeks to contribute to the understanding of how factors at the plot, farm and household level may hinder or promote the adoption of ISFM. To this end the study uses data from two sites located in East and West Africa that differ in adoption levels.
The ISFM paradigm
ISFM is a soil fertility management paradigm developed to counteract the increasingly alarming rate of soil fertility decline in Africa. Central to the ISFM paradigm is: (1) that no single component of soil fertility management can on its own lead to sustainable soil fertility management (Marenya and Barrett, Reference Marenya and Barrett2007); (2) that it is knowledge-driven rather than input-intensive (Tittonell et al., Reference Tittonell, Misiko and Ekise2008a); and (3) that the progressive adoption of the different ISFM components maximizes agronomic efficiency (AE) (Vanlauwe et al., Reference Vanlauwe, Bationo, Chianu, Giller, Merckx, Mokwunye, Ohiokpehai, Pypers, Tabo, Shepherd, Smaling, Woomer and Sanginga2010).
There exist different definitions of what constitutes ISFM in the literature (Mugwe et al., Reference Mugwe, Mugendi, Mucheru-Muna, Merckx, Chianu and Vanlauwe2009; Odendo et al., Reference Odendo, Obare and Salasya2009; Guteta and Abegaz, Reference Guteta and Abegaz2016; Mponela et al., Reference Mponela, Tamene, Ndengu, Magreta, Kihara and Mango2016). We follow Vanlauwe et al. (Reference Vanlauwe, Bationo, Chianu, Giller, Merckx, Mokwunye, Ohiokpehai, Pypers, Tabo, Shepherd, Smaling, Woomer and Sanginga2010), who defined complete ISFM as a set of soil fertility management practices that necessarily include the use of improved germplasm, mineral fertilizers, and organic soil amendments (i.e., animal manure, compost, mulching, and green manures), combined with the knowledge of how to adapt these practices to local conditions to maximize agronomic use efficiency of the applied nutrients and improve crop productivity. Local adaptation addresses several constraints, including soil acidity, drought or moisture stress, hard pan formation and destruction of the soil structure caused by soil erosion (Vanlauwe et al., Reference Vanlauwe, Descheemaeker, Giller, Huising, Merckx, Nziguheba, Wendt and Zingore2015). To address soil acidity, application of lime may be necessary (Kisinyo et al., Reference Kisinyo, Othieno, Gudu, Okalebo, Opala, Ng'etich, Nyambati, Ouma, Agalo, Kebeney, Too, Kisinyo and Opile2014; Vanlauwe et al., Reference Vanlauwe, Descheemaeker, Giller, Huising, Merckx, Nziguheba, Wendt and Zingore2015). Drought stress can be alleviated using water harvesting techniques such as tied ridges (Kihara et al., Reference Kihara, Bationo, Mugendi, Martius and Vlek2011), whereas on hillsides soil erosion control such as through terracing should be implemented (Vanlauwe et al., Reference Vanlauwe, Bationo, Chianu, Giller, Merckx, Mokwunye, Ohiokpehai, Pypers, Tabo, Shepherd, Smaling, Woomer and Sanginga2010). Other aspects of local adaptation are targeted manure application (Vanlauwe et al., Reference Vanlauwe, Bationo, Chianu, Giller, Merckx, Mokwunye, Ohiokpehai, Pypers, Tabo, Shepherd, Smaling, Woomer and Sanginga2010), on-farm organic input recycling, improving efficiency of external inputs and integrating scientific knowledge with indigenous knowledge in order to enable sustainable intensification (Tittonell et al., Reference Tittonell, Misiko and Ekise2008a). Integrating indigenous knowledge with scientific knowledge is vital as farmers often use their heritage knowledge to adapt technologies to their local condition e.g., use of ridges to increase soil depth for crops and to root them firmly in the soil to prevent adverse effects of flash floods.
Based on this discussion, we defined the following levels of adoption:
1. No adoption (NA): Farmers do not use any or use just one of the components of ISFM as defined by Vanlauwe et al. (Reference Vanlauwe, Bationo, Chianu, Giller, Merckx, Mokwunye, Ohiokpehai, Pypers, Tabo, Shepherd, Smaling, Woomer and Sanginga2010).
2. Partial adoption 1 (PA1): Farmers use any combination of two ISFM components.
3. Partial adoption 2 (PA2): Farmers use any combination of three ISFM components.
4. Complete adoption (CA): Farmers apply all of the ISFM components.
Materials and methods
Identifying determinants of adoption
Often system technologies are adopted partially, that is, only some of the components are applied by the farmer. Adoption of such technologies has been estimated previously using different models such as multivariate Bayesian (Aldana et al., Reference Aldana, Foltz, Barham and Useche2011) or ordered probit models (Wollni et al., Reference Wollni, Lee and Thies2010). ISFM adoption, in particular, has previously been estimated as a binomial process whereby it is either adopted or not adopted (Mugwe et al., Reference Mugwe, Mugendi, Mucheru-Muna, Merckx, Chianu and Vanlauwe2009; Odendo et al., Reference Odendo, Obare and Salasya2009; Adolwa et al., Reference Adolwa, Okoth, Mulwa, Esilaba, Mairura and Nambiro2012) or as a correlated binomial process of discrete choices (Marenya and Barrett, Reference Marenya and Barrett2007). However, the adoption of additional components of ISFM leads to an increase in AE justifying the use of an ordered regression model (ORM).
According to Long and Freese (Reference Long and Freese2001) the ORM is given as:
 $$y_i^{\ast} = X_i {\rm \beta} + {\rm \varepsilon} _i, $$
where y* is the latent variable for farmer i, εi is the random error, X i is a vector of independent variables, and β represents the parameters to be estimated. The measurement model divides y* into J ordinal categories:
 $$y_{i\;} = m{\rm \;} \;{\rm if}\;T_m - 1\; \le \; y_i^{\ast} \lt T_{m}, \;{\rm for}\;\; m\; = 1\; \;{\rm to}\;\; J,$$
where the cut-points T 1 through T J−1 are estimated with the assumption that T 0 = −∞ and T J = ∞.
In our case, the observed independent categories are tied to the latent variable by the measurement model:
 $$y_{i\;} = \left\{ {\matrix{ {1 \to {\rm no}\,{\rm adoption}} & {{\rm if}\;T_0 = - \infty \le y_i^{\ast} \lt T_{1\;} \;} \cr {2 \to {\rm partial}\,{\rm adoption}\;{\rm 1}} & {{\rm if}\;T_1 \le y_i^{\ast} \lt T_2} \cr {3 \to {\rm partial}\,{\rm adoption}\;{\rm 2}} & {{\rm if}\;T_2 \le y_i^{\ast} \lt T_3} \cr {4 \to {\rm complete}\,{\rm adoption}} & {{\rm if}\;T_3 \le y_i^{\ast} \lt T_4 = \infty.} \cr}} \right.$$
For a given value of x the probability of an observed outcome is given as:
 $${\rm Pr(}y = m\left \vert {{\rm \;} x} \right.{\rm )} = {\rm Pr(}T_{m - 1} \le y^{\ast} \lt T_m \left \vert x \right..$$
As shown in equation (4), the probability of observing y = m for a given value of x relates to the region of the distribution where y* falls between the cut-points Tm−1 and Tm. If y* is substituted with Xβ + ε then the predicted probability in the ORM becomes:
 $${\rm Pr(}y = m\left \vert {x} \right.{\rm )} = F(T_m - X{\rm \beta} ) - F(T_{m - 1} - X{\rm \beta} ),$$
where F is the cumulative distribution function (cdf) for ε. Since we estimate an ordinal logit model, F is logistic with Var (ε) = π2/3. Equation (5) can thus be simplified to:
 $${\rm Pr} \le = F(T_m - X{\rm \beta} )\;\; {\rm for} \; {\rm m} = 1\;{\rm to}\;J_1. $$
Equation (6) can be used to compute cumulative probabilities for the ORM, which is equivalent to J−1 binary regressions assuming that the slope coefficients (β) are identical across each regression. This important assumption for the ORM is known as the parallel regression or proportional odds assumption (Long and Freese, Reference Long and Freese2001). The Stata command ‘omodel’ developed by Wolfe and Gould (Reference Wolfe and Gould1998) was used to test this assumption by an approximate likelihood-ratio (LR) test.
It is common in empirical work that some β’s differ across values of J resulting in the violation of the parallel regression assumption. The partial proportional odds model overcomes these restrictions by allowing some β coefficients to be the same for all values of J, whereas others can differ (Williams, Reference Williams2006). The model is given as:
 $$\eqalign{P\left( {Y_i \gt J} \right) & = \displaystyle{{{\rm exp(\alpha} _j X1_i {\rm \beta} 1 + X2_i {\rm \beta} 2 + X3_i {\rm \beta} 3_j {\rm )}} \over {1 + \left\{ {{\rm exp(\alpha} _j + X1_i {\rm \beta} 1 + X2_i {\rm \beta} 2 + X3_i {\rm \beta} 3_j {\rm )}} \right\}}}, \cr & \qquad J = 1,2, \ldots, \; m - 1.}$$
In the equation above the β’s for X1 and X2 are the same for all categories J, while those of X3 are allowed to differ.
Description and specification of the models
An approximate LR test of proportionality of odds across categories was carried out on the ordinal logistic regression models for Tamale and Kakamega. The parallel lines assumption was rejected at the 5% level in both cases; Tamale (χ2 (23) = 44.39; Prob > χ2 = 0.0047) and Kakamega (χ2 (26) = 45.75; Prob > χ2 = 0.0097). The violation of this assumption requires the use of the partial proportional odds model. In the case of Tamale, constraints for parallel lines were removed for slope and plot size (P < 0.05). For Kakamega, the parallel lines assumptions was violated for plot area (P = 0.015), % sand (P = 0.006), total carbon (P = 0.034), and number of adult members in the household (P = 0.015). The final models for both cases do not violate the parallel lines assumption as their test statistics were insignificant (Tamale-χ2 (20) = 27.73; Prob > χ2 = 0.116 and Kakamega-χ2 (18) = 15.21; Prob > χ2 = 0.647). Given that there were four adoption categories, a series of logistic regression models were estimated in case of violation of the assumption:
• Model 1 – NA versus PA1 (combination of 2 components) and PA2 (combination of 3 components) and CA (combination of all 4 components);
• Model 2 – NA and PA1 versus PA2 and CA;
• Model 3 – NA and PA1 and PA2 versus CA.
If the variables met the proportional odds assumption their parameter estimates would be identical in the three models and could be combined into a single model. If this was not the case different estimates are shown for the unique models. The models were estimated in Stata 12 using the gologit2 (Williams, Reference Williams2006) program.
The study sites
The study was conducted in Tamale, Ghana and Kakamega, Kenya (Fig. 1). Both sites are located in the moist savanna and woodland zone that includes the Guinea Savanna of West Africa and East Africa's Highland Mosaic (Sanginga and Woomer, Reference Sanginga and Woomer2009).

Fig. 1. Map of the two study sites in Ghana and Kenya.
Tamale is a rapidly growing agglomeration and is considered the fastest growing city in West Africa (Gyasi et al., Reference Gyasi, Fosu, Kranjac-Berisavljevic, Mensah, Obeng, Yiran and Fuseini2014). It is Ghana's third largest city and the capital of its northern region. Agricultural production is dominated by vegetable production in backyards and open spaces within city confines. However, cereal cultivation, particularly of maize (Zea mays L.) is still common even within the urban areas. Maize is a major staple crop in Tamale and Kakamega and constitutes a large share of the dietary intake of the local communities (Odendo et al., Reference Odendo, Ojiem, Bationo and Mudeheri2007; Chagomoka et al., Reference Chagomoka, Unger, Drescher, Glaser, Marschner and Schlesinger2016). At the fringes of the city, beyond a 3 km radius from the center, peri-urban agriculture is dominated by cultivation of cereals such as maize and rice (Oryza sativa and Oryza glaberrima), tuber crops and vegetables. The rural areas surrounding the city have predominantly cereal-based cropping systems with maize as the dominant crop. Groundnut (Arachis hypogaea) is the most common legume. Other crops grown include yams (Dioscorea spp.), cowpea (Vigna unguiculata) and vegetables that are mostly grown along field edges. Tamale receives an annual rainfall of about 1100 mm, which is uni-modally distributed. Although the landscape is flat, sheet erosion is common due to limited tree cover. The average altitude is 183 m above sea level (asl). ISFM activities in the study area have been carried out by organizations such as the Savanna Agricultural Research Institute (SARI) for the past four years but mainly concentrated on rural areas.
Kakamega County is one of the administrative units of Kenya and consists of several urban centers including Kakamega (the headquarters of the county). The rest of the county is pre-dominantly rural. In the towns, mainly vegetables such as cabbage (Brasssica oleracea), cowpea and kale (Brassica oleracea) are grown. Other crops common in urban and peri-urban areas include banana, bean (Phaseolus vulgaris) and maize. In the rural areas, maize is the dominant staple grown mainly for subsistence. Cash crops are also grown alongside maize; in the wetter zone tea (Camellia sinensis) is cultivated, whereas in the less humid zone sugarcane (Saccharum officinarum) is the main cash crop. Cereal-legume intercropping systems dominate the area with maize–bean systems being the most common. Due to extensive ISFM activities over the last ten years soybean (Glycine max), which has a high potential for value addition, has gradually been incorporated in the cropping systems. Kakamega receives as much as 2000 mm of rainfall per annum in a bi-modal pattern. Therefore, most farmers take advantage of this to crop twice per year. The landscape is steep in some areas and average altitude is 1535 m asl.
Data collection: survey and laboratory analysis
Data were collected in a household survey between July 2014 and February 2015. To select respondents, a stratified random sampling approach was utilized at both sites. Farming households were stratified into participants in ISFM activities and non-participants. Participant farmers were randomly selected from lists of participating farmers, which were compiled with the assistance of extension officers, local research institutions, village elders and lead farmers who had been involved in disseminating ISFM activities. Non-participants were randomly selected from a list of farmers, which was obtained from the Urban Foodplus project in Tamale (Bellwood-Howard et al., Reference Bellwood-Howard, Häring, Karg, Roessler, Schlesinger and Shakya2015) and from the Agricultural Sector Development Support Programme of Kenya in Kakamega (Agricultural Sector Development Support Programme, 2014). In this way, a total of 285 farmers were selected in Tamale but information from three farmers was not utilized for analysis due to missing data. In Kakamega, a total of 300 farmers were selected, but one farmer had to be dropped because his soil samples got lost. Face-to-face interviews using a structured questionnaire were conducted. The questionnaire contained sections on socio-demographic characteristics of household members, farm characteristics, crop production and management, as well as off-farm activities. The reference period for all economic activities comprised the last 12 months prior to the interview.
In addition, soil samples (0–20 cm depth) were drawn from 322 and 459 maize plots belonging to farmers interviewed in Tamale and Kakamega, respectively. Some of these maize plots were closer to their homesteads (in-fields) whereas others were further away (out-fields). These samples were taken to capture information on soil fertility indicators influencing ISFM uptake at the plot level. Farmers often use local soil quality indicators such as tilth (or the ‘feel’ of the soil), soil color, workability of the soil, productivity in terms of crop yield, vigor of growth or intensity of leaf color and the presence of soil fauna (Barrios et al., Reference Barrios, Delve, Bekunda, Mowo, Agunda, Ramisch, Trejo and Thomas2006; Mairura et al., Reference Mairura, Mugendi, Mwanje, Ramisch, Mbugua and Chianu2007). Therefore, we deemed it appropriate to collect data on key chemical and physical indicators such as soil organic carbon (SOC), total C, total nitrogen (N), available phosphorus (P), pH and soil texture (% clay, % sand, % silt) that may mirror these indigenous criteria. To this end three to five sub-samples were collected from each maize field cultivated (as long as it was accessible) in the previous season. These sub-samples, mixed to form a composite sample, were immediately air-dried and sieved to 2-mm. Subsequently, a subsample of the soil (about 10%) was subjected to laboratory analysis: SOC (Walkley–Black method), available P as Bray-P, pH water (2.5 : 1 water) and soil texture were determined according to Okalebo et al. (Reference Okalebo, Gathua and Woomer1993). Elemental analysis (combustion method) was used to determine total N and C after grinding samples to 0.5 mm. The FLASH 2000 Organic Elemental Analyzer Thermo Scientific (Thermo Fisher Scientific Inc. Waltham, MA, USA) was used for this purpose. This instrument allows rapid, precise and environmental-friendly determinations of C, N and sulfur in soils and other materials (Jimenez and Ladha, Reference Jimenez and Ladha1993). The dry combustion used by this instrument provides more reliable data of SOC than the Walkley–Black method (Terhoeven-Urselmans et al., Reference Terhoeven-Urselmans, Vagen, Spaargaren and Shepherd2010). Unused portions of the samples were subjected to mid-infra-red (MIR) analysis. Non-destructive infra-red spectroscopy (NIRS) methods offer a quick, efficient, accurate and cost-efficient means of analyzing large numbers of soil samples (Viscarra Rossel et al., Reference Viscarra Rossel, Walvoort, McBratney, Janik and Skjemstad2006). The instrument used for analysis was a TENSOR 27 HTS-XT (Bruker Co., Billerica, MA, USA) MIR spectrometer. This instrument captures MIR spectral data using the HTS-XT diffuse reflectance method with spectral measurement ranging between 4000 and 400 cm−1 with 4 cm−1 resolution (3578 data points). Each sample was loaded onto an aluminum microtiter plate, which has 96 wells or shallow holes, in two replicates. Two spectra from each sample were averaged before calibration and analysis. For principal components analysis (PCA) and partial least-squares regression, about 90% of the MIR spectra were chosen for calibration and the remaining 10% were used for validation. Partial least-squares regression was carried out on the calibration set with reference values obtained from the conventional soil analysis. Following Terhoeven-Urselmans et al. (Reference Terhoeven-Urselmans, Vagen, Spaargaren and Shepherd2010), prediction performance was determined using the coefficient of determination (r 2) of the linear regression of predicted against measured values, the root-mean-square errors of calibration (RMSEC), and the root-mean-square errors of prediction (RMSEP).
Hereby RMSEC is computed as
 $${\rm RMSEC} = \sqrt {\displaystyle{{\mathop \sum \nolimits_{i = 1}^N (y_i - x_i )^2} \over {N - A - 1}}}, $$
where A is the number of principal components used in the model.
In general, good predictions have an r 2 ⩾ 0.75, whereas satisfactory predictions have an r 2 of 0.65–0.74 (Shepherd and Walsh, Reference Shepherd and Walsh2002; Terhoeven-Urselmans et al., Reference Terhoeven-Urselmans, Vagen, Spaargaren and Shepherd2010). R software was used to conduct PCA and partial least-squares regression, which were in turn utilized to generate predicted values for the soil variables.
Results and discussion
Prediction of soil data using calibration models
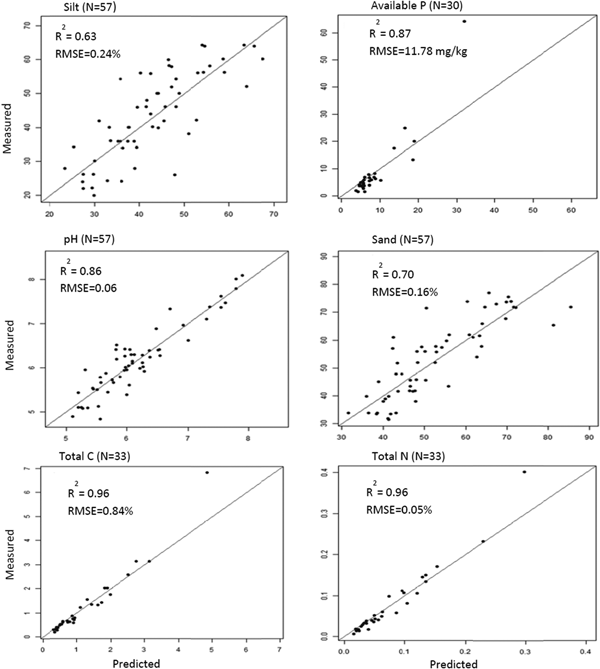
Predictions for available P, pH, total C and N were good for Tamale soils whereas soil texture predictions were mixed (Fig. 2). Predicted values for soil texture were thus readjusted using the more reliable values of sand and silt. Janik et al. (Reference Janik, Skjemstad and Merry1998) have suggested that large residuals may arise as a result of errors in the primary laboratory method rather than the spectroscopy method. For Kakamega, all soil parameter predictions had an r 2 > 0.75 (Fig. 3).

Fig. 2. Calibration models for key parameters from the topsoil of farmers’ maize fields in Tamale, Ghana. RMSE, root-mean-square error.

Fig. 3. Calibration models for key parameters from the topsoil of farmers’ maize fields in Kakamega, Kenya. RMSE, root-mean-square error.
Use of ISFM components and their combinations
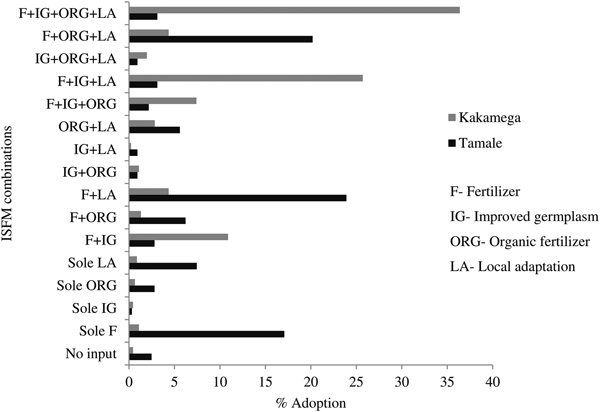
Figure 4 shows the use of individual components of ISFM and their combinations for the two study sites. In Tamale, about 2% of the farmers’ plots do not use any ISFM practices, whereas in Kakamega this share is negligible. The share of farmers in Tamale adopting improved germplasm either solely or in combination with other technologies does not exceed 5%. The extremely low adoption of improved germplasm in Tamale could be attributed to the low availability of improved maize seeds in the local market.

Fig. 4. Use of individual components of ISFM and their combinations at plot level. F, fertilizer; IG, improved germplasm; ORG, organic fertilizer; LA, local adaptation.
For the econometric analysis we defined complete ISFM adoption as adopting all components of ISFM. Partial adoption refers to the use of two or three individual components of ISFM as outlined previously. No adoption is much more widespread in Tamale compared with Kakamega (Table 1). 28% of the farmers in Tamale do not use any or use just one of the components of ISFM compared with 3% in Kakamega. Moreover, the use of any combination of two ISFM components (PA1) is higher in Tamale, while partial adoption 2 and complete adoption is much more common on plots in Kakamega.
Table 1. Adoption of ISFM per plot.

Notes: No adoption (NA): Farmers do not use any or just one of the components of ISFM as defined by Vanlauwe et al. (Reference Vanlauwe, Bationo, Chianu, Giller, Merckx, Mokwunye, Ohiokpehai, Pypers, Tabo, Shepherd, Smaling, Woomer and Sanginga2010); Partial adoption 1 (PA1): Farmers use any combination of two ISFM components; Partial adoption 2 (PA2): Farmers use any combination of three ISFM components; Complete adoption (CA): Farmers apply all of the ISFM components.
Determinants of ISFM adoption
Descriptive statistics of all the variables used in the econometric models are shown in Table 2. The estimation results on the determinants of ISFM adoption on the plot level are presented in Table 3 for Tamale and Table 4 for Kakamega. The first column shows the estimated coefficients, while the following columns indicate the marginal effects. For clarity, we present marginal effects for significant factors only. They can be interpreted as the change in the probability of observing a certain adoption level for a marginal change in the independent variable. For dummy variables, they indicate the change in probability for a change in the independent variable from zero to one.
Table 2. Descriptive statistics of all the variables used in the econometric models for Tamale (Ghana) and Kakamega (Kenya).

1 Tropical livestock units (TLUs) computed following Jahnke (Reference Jahnke1982) and Odendo et al. (Reference Odendo, Obare and Salasya2009).
Notes: HH stands for household, and no. for number; NA stands for no adoption, PA1 for partial adoption 1, PA2 for partial adoption 2, and CA for complete adoption. Standard deviation is in italics.
Table 3. Results for the generalized logit model and marginal effects (dy/dx) for ISFM adoption in Tamale, Ghana.

1 Tropical livestock units (TLUs) computed following Jahnke (Reference Jahnke1982) and Odendo et al. (Reference Odendo, Obare and Salasya2009).
2 Dummy for association membership; 1, member of an agricultural association.
3 Dummy for slope; 1, medium or steep slope.
Notes: HH stands for household, P for phosphorus, no. for number, yrs. for years and assoc. for association; NA for no adoption, PA1 for partial adoption 1, PA2 for partial adoption 2, and CA for complete adoption. Robust standard errors are in parentheses.
*P < 0.1, **P < 0.05, ***P < 0.01.
Table 4. Results for the generalized logit model and marginal effects (dy/dx) for ISFM adoption in Kakamega, Kenya.

1 Dummy for slope; 1, medium or steep slope.
2 Dummy for off-farm occupation; 1, HH with off-farm occupation.
3 Tropical livestock units (TLUs) computed following Jahnke (Reference Jahnke1982) and Odendo et al. (Reference Odendo, Obare and Salasya2009).
4 Dummy for association membership; 1, member of an agricultural association.
Notes: HH stands for household, P for phosphorus, no. for number, yrs. for years and assoc. for association; NA for no adoption, PA1 for partial adoption 1, PA2 for partial adoption 2, and CA for complete adoption.
Robust standard errors are in parentheses.
*P < 0.1, **P < 0.05, ***P < 0.01.
Concerning plot level characteristics, in Tamale higher clay content (P < 0.1) reduces the number of ISFM components adopted (Table 3). A unit increase in clay content decreases the likelihood of complete adoption by 2%. It is well known that many West African soils are inherently infertile having not benefited from volcanic rejuvenation (Bationo et al., Reference Bationo, Lompo and Koala1998). As these soils are mainly Ochrosols and are derived from sandstone parent material (Braimoh and Vlek, Reference Braimoh and Vlek2006), they generally have low clay content. Where clay content is low, soil cation exchange capacity (CEC) depends mostly on the top-soil carbon content (Buerkert et al., Reference Buerkert, Bationo and Dossa2000). However, organic amendments such as manure and compost are often scarce and labor-demanding (Schlecht et al., Reference Schlecht, Buerkert, Tielkes and Bationo2007). Hence, the capacity of these soils to bind to nutrients and make them available to plants is low. Thus it may not be entirely surprising that farmers, who are often resource-constrained, may opt to judiciously allocate scarce inputs across their fields opting to use less on plots they perceive to be fertile, so as to raise overall crop productivity (Schlecht and Buerkert, Reference Schlecht and Buerkert2004).
In Kakamega, a unit increase in total C increases the likelihood of complete adoption by 42% (Table 4). The higher soil fertility in Kakamega is depicted by the higher PCA scores of the various technical soil fertility indices including total C (Fig. 5). The enhanced soil carbon content here is likely to elevate soil CEC increasing the availability of applied nutrients to plants. The higher rainfall received in this region coupled with the higher organic matter is likely to provide suitable conditions for faunal and microbial activity increasing mineralization and lowering C : N ratios. This leads to higher crop productivity, which is likely to induce farmers to intensify crop production. Moreover, it was reported that input use intensification is often higher in the more densely populated and fertile regions of Africa, such as western Kenya, than in the less densely populated and intensely used areas of West Africa (Tittonell et al., Reference Tittonell, Shepherd, Vanlauwe and Giller2008b; Giller et al., Reference Giller, Tittonell, Rufino, van Wijk, Zingore, Mapfumo, Adjei-Nsiah, Herrero, Chikowo, Corbeels, Rowe, Baijukya, Mwijage, Smith, Yeboah, van der Burg, Sanogo, Misiko, de Ridder, Karanja, Kaizzi, K'ungu, Mwale, Nwaga, Pacini and Vanlauwe2011). Mairura et al. (Reference Mairura, Mugendi, Mwanje, Ramisch, Mbugua and Chianu2007) similarly reported preference of farmers in central Kenya to plant high value crops in soils they perceived to be fertile as judged by the darkness of their color, as it is commonly assumed that the soils have higher soil organic matter (SOM) concentration. The concentration of nutrients by farmers in western Kenya could also be attributed to differences in resource endowment among heterogeneous farming households whereby resource-rich farmers continually enrich their fields with fertilizer and organic inputs (Tittonell et al., Reference Tittonell, Vanlauwe, Leffelaar, Rowe and Giller2005; Vanlauwe et al., Reference Vanlauwe, Descheemaeker, Giller, Huising, Merckx, Nziguheba, Wendt and Zingore2015). Indeed, this is affirmed by the positive influence of off-farm occupation on the uptake of the complete set of ISFM practices (P < 0.01) at this location (Table 4).

Fig. 5. PCA scores depicting the difference in fertility status between farmers’ fields in Tamale (Ghana) and Kakamega (Kenya). PC, principal component.
Soil texture has been linked to the workability of a soil and is known to be an important indicator of soil quality (Barrios and Trejo, Reference Barrios and Trejo2003; Barrios et al., Reference Barrios, Delve, Bekunda, Mowo, Agunda, Ramisch, Trejo and Thomas2006). While an increase in sand content (P < 0.1) decreases the number of ISFM components used in Tamale (Table 3), it (P < 0.01) increases the probability of complete ISFM uptake in Kakamega (Table 4). A unit increase in sand content increases the likelihood of complete ISFM adoption by about 2%. Soils that have been described to be permeable and easy to work with tools i.e., sandy soils, are often preferred by farmers (Desbiez et al., Reference Desbiez, Matthewsa, Tripathi and Ellis-Jones2004). This is particularly important where farmers rely more on manual labor than on mechanized equipment to plough, as in Kakamega's case. According to Mango (Reference Mango1999), farmers in western Kenya prefer soils that are light and easy to work with. Hence, they are likely to invest soil fertility technologies, especially the labor-intensive ones, in fields with such soils. However, in Tamale the workability of soils is not an issue and may even have an adverse effect on ISFM adoption, because farmers here tend to use tractors for ploughing.
Other plot level characteristics such as slope and plot size also influence ISFM adoption at both sites. In Tamale, a steeper slope (P < 0.01) decreases the number of ISFM components adopted (Table 3), whereas in Kakamega it (P < 0.1) is the reverse (Table 4). The latter result makes sense as farmers owning fields with steep slopes are expected to employ soil conservation technologies such as terraces. Kakamega is characterized by very steep terrain in some places and hence such innovations are necessary to avoid soil erosion. Similar results were reported by Wollni et al. (Reference Wollni, Lee and Thies2010), where slope had a positive effect on the adoption of soil conservation technologies. In Tamale, however, farmers consider fields that have steep or undulating terrain to be marginal. A factor that may preclude them from investing in soil fertility innovations. At both locations, plot size (P < 0.01) reduces the number of ISFM components adopted. In Tamale, a marginal increase in acreage decreases the likelihood of complete adoption by about 1%. In Kakamega, it increases the probability of non-adoption by also about 1%. As production inputs are costly and organic amendments are often unavailable or require considerable labor outlays, using ISFM on larger parcels of land may not be possible.
Concerning farm and household level variables, we found that the number of adult household members increases the likelihood of adoption at both sites (Tables 3 and 4). This seems plausible as the use of ISFM components requires considerable amounts of labor. Moreover, off-farm employment (P < 0.01) increases the number of ISFM components adopted in Kakamega. Having off-farm occupation increases the likelihood of complete ISFM adoption by 14% (Table 4). Off-farm activities are an important source of income for many households and our results suggest that this additional income can foster ISFM adoption.
Farmer associations (P < 0.01) are also important for increasing ISFM adoption in Kakamega (Table 4). Membership in associations increases the likelihood for complete adoption by almost 17%. Farmer associations are the main platforms for delivery of extension messages and trainings, particularly in rural areas. They also facilitate linkages with institutions that provide farm inputs, information and credit. Farmers’ participation in associations has been shown to spur the uptake of system innovations (Ogunlana, Reference Ogunlana2004; Noltze et al., Reference Noltze, Schwarze and Qaim2012). The prominence of associations in Kakamega, particularly in terms of influencing complete adoption, could be attributed to the cohesive nature of farmer groupings that has been fostered by group liability; an innovative tool applied by various microfinance institutions e.g., One Acre Fund, operating in Kenya. The role of institutions is crucial for the successful scale-up of ISFM beyond plot-level as they are envisaged to foster enabling environments thus minimizing risks to investments in sustainable innovations (Vanlauwe et al., Reference Vanlauwe, Coyne, Gockowski, Hauser, Huising, Masso, Nziguheba, Schut and van Asten2014). The variable membership in farmer associations could potentially be endogenous due to self-selection of farmers into groups and the appropriate interpretation of the influence is then one of statistical association rather than causality. We also estimated both models without this variable to test for systematic bias. The results, which are available from the authors on request, hardly change in terms of magnitude and their significance levels implying that the other estimates would be valid even if membership in farmer associations is endogenous.
Another variable of interest is livestock ownership, which significantly (P < 0.01) influences ISFM adoption in Kakamega, but has no effect in Tamale (Tables 3 and 4). A unit increase in tropical livestock units (TLUs) enhances the probability of complete adoption in Kakamega by almost 5%. Livestock ownership is apparently important for complete ISFM adoption, which necessitates the integration of manure; a major source of SOM (Schlecht et al., Reference Schlecht, Buerkert, Tielkes and Bationo2007). The lack of effect in Tamale is due to the low use of manure on maize fields even by adopters. According to Giller et al. (Reference Giller, Tittonell, Rufino, van Wijk, Zingore, Mapfumo, Adjei-Nsiah, Herrero, Chikowo, Corbeels, Rowe, Baijukya, Mwijage, Smith, Yeboah, van der Burg, Sanogo, Misiko, de Ridder, Karanja, Kaizzi, K'ungu, Mwale, Nwaga, Pacini and Vanlauwe2011), farmers in the Guinea savanna zone of Ghana use little or no manure.
Conclusions and recommendations
Our results highlight the importance plot level factors, particularly soil texture, soil carbon, and plot size, for the analysis of ISFM adoption. Interestingly, access to fields with higher clay content seems to preclude farmers from intensifying input use in Tamale. This is consistent with farmers’ tendency to judiciously allocate scarce resources. In Kakamega, however, higher total C tends to spur complete ISFM adoption. Therefore, the differentiated soil quality influence on farmers' adoption decisions may be due to agro-ecological differences and underlying soil fertility constraints.
In Tamale, we find that adoption decisions by farmers are mainly influenced by plot level factors, with the exception of the availability of household labor. For Kakamega, we found that household and farm level factors are important determinants of ISFM adoption. These include off-farm income, livestock ownership and membership in farmer associations, suggesting that only resource-endowed farmers are able to adopt ISFM innovations.
Low clay content in Tamale seems to be a major constraint to crop production. This coupled with the relatively low use of organic resources portends negative ramifications for SOM buildup and uptake of nutrients. Therefore, extension and other change agents may promote farmer use of locally available amendments such as shea butter chaff. The supplementary use of shea butter chaff, a by-product of shea butter processing from the Shea tree (Vitellaria paradoxa) could be a viable option at least for small-scale producers in Tamale. Strengthening of farmer associations, particularly in Kakamega, is also important as they play an important role in exposing farmers to new ideas and concepts and linking them to relevant institutions. In Tamale, improved seeds are hardly available for farmers due to structural problems in the maize seed sector in Ghana. In an effort to correct this, Ghana's parliament introduced a seed law (the Ghana Plant Breeders Bill) to protect plant breeders’ rights. However, even if the bill will pass, the distribution of improved seeds also needs to be enhanced.
The results for Kakamega show that off-farm income sources are important drivers of ISFM adoption thus income shortfalls are likely to hinder farmers from applying the full set of ISFM practices. In this light, governmental programs to improve access to credit could help to increase the use of improved seeds and to cushion farmers against the risks associated with the adoption of system innovations. These interventions would facilitate the farmer to explore the combination of different ISFM technologies under prevailing local conditions to optimize resource and nutrient use efficiency for the sustainable increase in crop productivity. However, further research on the impact of ISFM adoption on yields and household incomes and the benefits and costs of different strategies to foster ISFM adoption is required.
Acknowledgements
This study was partly funded within UrbanFoodplus project (FKZ: 031A242A) by the German Federal Ministry of Education and Research (BMBF) and the German Ministry for Economic Cooperation (BMZ) under the initiative GlobE-Research for the Global Food Supply. This paper also benefited from comparative work in the rural–urban interface within FOR2432, funded by Deutsche Forschungsgemeinschaft (DFG). We are grateful for the logistical support and advice received from the University for Development Studies (UDS), the CSIR-Soil Research Institute, SARI, and Kenya Agricultural Research and Livestock Organization (KARLO). We also thank the Ministry of Food and Agriculture (MoFA) officers, village elders and, last but not least, farmer and institutional actor participants in Kenya and Ghana for their cooperation. Lastly, we gratefully acknowledge the German Academic Exchange Service (DAAD) for granting a scholarship to the first author.