


Introduction
Bivalves often exhibit intraspecific morphological variation in shell shapes between localities (Holme, Reference Holme1961; Eager et al., Reference Eager, Stone and Dickson1984; Márquez & van der Molen, Reference Márquez and Van der Molen2011; Signorelli et al., Reference Signorelli, Márquez and Pastorino2013), habitat types (Zieritz & Aldridge, Reference Zieritz and Aldridge2009) and latitude (Beukema & Meehan, Reference Beukema and Meehan1985). Intraspecific shell shape variation can be used to discriminate populations or stocks (Palmer et al., Reference Palmer, Pons and Linde2004; Márquez et al., Reference Márquez, Robledo, Peñaloza and Van der Molen2010, Reference Márquez, Trivellini and Van der Molen2017). However, shell shape often varies within a population and can be a useful indicator for evaluating habitat suitability (Holopainen & Kuiper, Reference Holopainen and Kuiper1982; Kakino, Reference Kakino1996). Variations in shell morphology often reflect environmental characteristics rather than genetic effects (Yokogawa, Reference Yokogawa1998; Kwon et al., Reference Kwon, Park, Lee, Park, Hong and Chang1999; Costa et al., Reference Costa, Aguzzi, Menesatti, Antonucci, Rimatori and Mattoccia2008), suggesting phenotypic plasticity in shell shapes, as suggested for some species (Soares et al., Reference Soares, Callahan and Ruyck1998; Sousa et al., Reference Sousa, Freire, Rufino, Méndez, Gaspar, Antunes and Guilhermino2007; Zieritz et al., Reference Zieritz, Hoffman, Amos and Aldridge2010; Inoue et al., Reference Inoue, Hayes, Harris and Christian2013).
Asari clam Ruditapes philippinarum is a commercially important bivalve inhabiting tidal flats in Japan. Their shell sharpness and thickness vary among localities (Watanabe & Katayama, Reference Watanabe and Katayama2010; Caill-Milly et al., Reference Caill-Milly, Bru, Mahé, Borie and D'Amico2012, Reference Caill-Milly, Bru, Barranger, Gallon and D'Amico2014). This morphological variation reflects the environmental adaptability of clams, as the shell height and width become greater in unsuitable habitats (Choe & Oshima, Reference Choe and Ohshima1958; Kakino, Reference Kakino1996; Saito et al., Reference Saito, Tomarino, Yamaji, Kawai and Imabayashi2007). However, it is unclear which external or internal factors cause different phenotypes. If external factors, equivalent to surrounding environments, largely govern shell shapes, individuals would respond similarly to the environment regardless of the variation in individual growth (internal factor). On the contrary, if the individual growth rate is the driver affecting shell shapes, the shell shape variation would be associated with individual growth even under the same environments.
This study aimed to: (1) confirm the ecophenotypic plasticity in clam shell shape, and (2) clarify which external or internal factors affect shell morphology. In asari clam, marginal shell growth can be used to explore the process of shell shape formation because it has been suggested that the direction of shell growth of transplanted clams is related to the environment rather than the shell shape at the time of transplantation (Choe & Oshima, Reference Choe and Ohshima1958). In the present study, a cross-translocating experiment was conducted in the field. Clams from suitable and unsuitable habitats were released to both habitats, and the marginal shell growth and changes in shell shapes were compared between origins and destinations.
Materials and methods
Study site
Matsukawaura Lagoon, Fukushima, Japan (37°49′ N 140° 59′E) was chosen as the study site. This lagoon has an area of 6 km2, and almost half of the lagoon is intertidal. The tidal range is ~1.5 m, salinity is usually above 25, and water temperature fluctuates seasonally from 5–27°C (Tomiyama, Reference Tomiyama2016, Reference Tomiyama2018). The asari clam is the most dominant bivalve in this lagoon and is the target species for the clam fishery.
Two sites were selected for clam collection and a field experiment (sites were the same as Tomiyama, Reference Tomiyama2016). Site 1 (suitable habitat) was located near the mouth of the lagoon, which was connected to the open sea (Figure 1). This site is a fishing ground for the asari clam. The site had a sandy substratum (median grain diameter = 2.23 mm, average silt-clay content = 2.79%), and was densely inhabited by the clams at an average density of 296 individuals m−2. Site 2 (unsuitable habitat) was located in the western part of the lagoon, ~700 m from Site 1. This site was a non-fishing ground, and the substratum at the intertidal zone was muddy sand (median grain diameter = 1.82 mm, average silt-clay content = 7.35%), whereas the substratum in the subtidal zone was mud. The clam inhabited only the areas in the intertidal zone at an average density of 93 individuals m−2. Local fishers empirically recognized the relatively low soft body mass of clams at Site 2, and clams at this site were not harvested commercially.
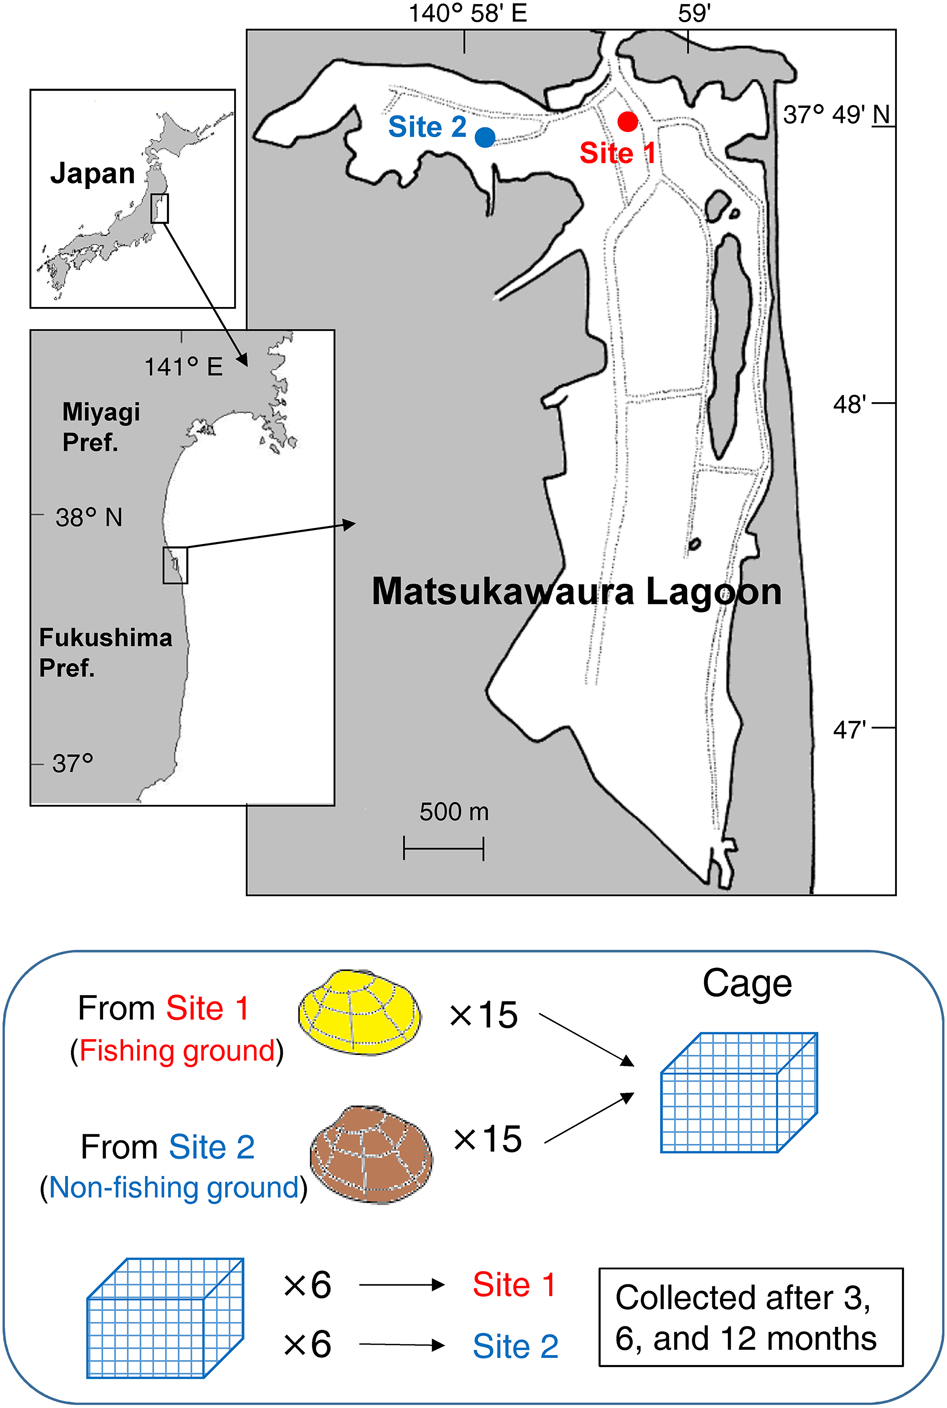
Fig. 1. Map of the study site and the schema of the field experiment.
Clam collection
To investigate the shell morphology for the field experiment, wild asari clams (N = 213 at Site 1; N = 209 at Site 2) were collected by digging the intertidal flat substratum and sieving through a 9 mm mesh at each site in May 2008. Additional subsamples of wild clams (N = 20 at Site 1; N = 11 at Site 2) were also collected in the same manner in August 2008.
For collected clams, the shell length (SL, mm), shell height (SH, mm), and shell width (SW, mm) were measured with a sliding caliper to the nearest 0.1 mm (Figure 2), following procedures developed by Watanabe & Katayama (Reference Watanabe and Katayama2010). For clams collected in May 2008, 180 clams per site were subjected to a field experiment after the measurement.
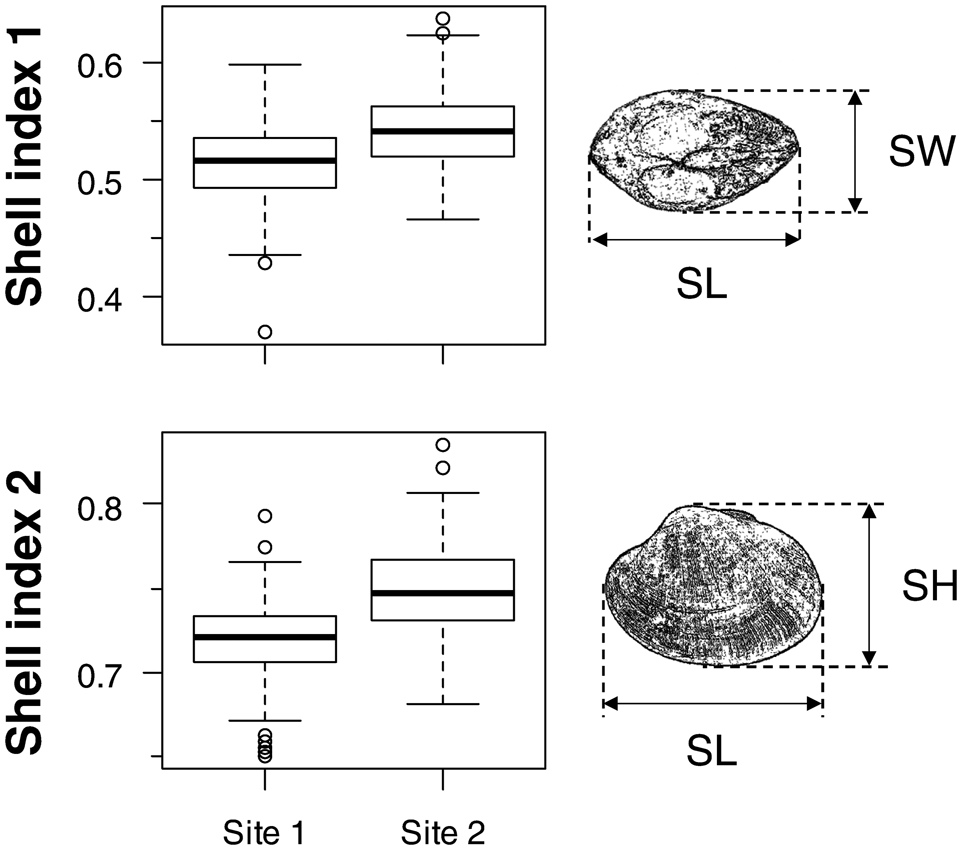
Fig. 2. Shell indices of wild asari clam collected from Sites 1 and 2. Shell indices 1 and 2 show the ratio of shell width (SW) or shell height (SH) relative to shell length (SL). Sample sizes were 233 and 220 for Sites 1 and 2, respectively. Boxes show the 25% and 75% quartiles and median, dashed vertical bars show the maximum and minimum values, and open circles show outliers. Significant differences were observed between sites (Mann–Whitney U test; SI1: U = 14932, P < 0.001; SI2: U = 10826, P < 0.001).
Field experiment
A field caging experiment was conducted at both sites until May 2009. A total of 360 asari clams of 26–48 mm SL were used. They were labelled by numbering their shells with a permanent marker. Clams were randomly divided into 12 groups consisting of 15 individuals per site per group, and a total of 30 clams from two sites were assigned to each group. Clams of each group were placed in a nylon-netting cage (25 × 25 × 15 cm, 6 mm mesh), and a total of 12 cages (6 cages per site) were buried at intertidal flats of Sites 1 and 2 in May 2008 (6 days after collection; Figure 1).
After 3, 6 and 12 months, two cages were collected from each site (one from the upper intertidal flat and the other from the lower intertidal flat) and brought to the laboratory. The surviving clams were subjected to post-experiment measurements of SL, SH and SW.
Analysis
To evaluate shell morphology, shell indices 1 and 2 (SI1 and SI2; following Watanabe & Katayama, Reference Watanabe and Katayama2010), determined by SW × SL−1 and SH × SL−1, respectively, were used. It has been suggested that both indices are negatively correlated with the nutritional condition in asari clams and that SH relative to SL (SI2) was more sensitive to the nutritional condition than SI1 (Watanabe & Katayama, Reference Watanabe and Katayama2010).
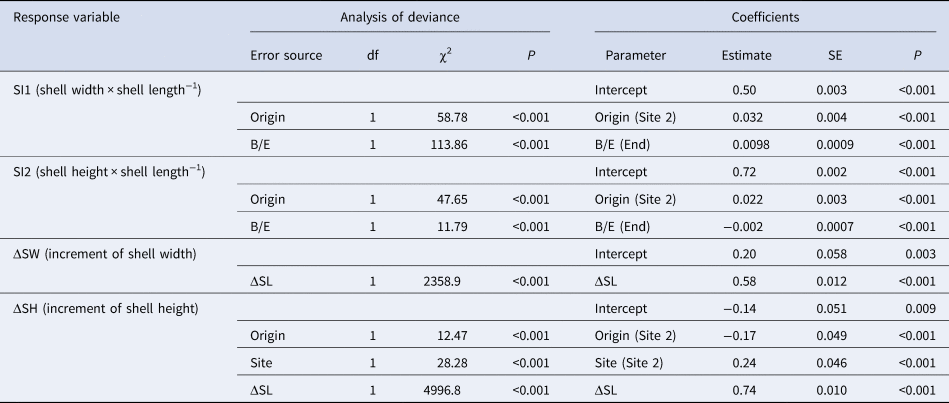
For wild clams (including caged clams before the field experiment, N = 453), SI1 and SI2 were compared between sites using the Mann–Whitney U test. Linear mixed models (LMMs) were constructed for SI1 and SI2 to explore the factors affecting shell shape variation. Initial explanatory variables were site and SL, and random variables were the month of collection and upper/lower intertidal flats. Models were fitted by maximum likelihood, and significant variables among both random and explanatory variables were selected by backward elimination.
Three analyses were performed for caged clams (post-experiment). Initially, clams with low growth (<0.5 mm increase in shell length (ΔSL)) were eliminated from the analyses to avoid the influence of measurement errors and to evaluate the marginal shell growth patterns. A total of 96 and 87 individuals originating from sites 1 and 2, respectively, were used. First, LMMs were constructed for the SI1 and SI2 of clams at recapture. Initial explanatory variables were the origin site of clams, site of release, and beginning/end of the experiment to test whether the indices changed during the experiment. Cage, duration (3, 6 and 12 months), and the individuals were incorporated as random variables. The models were fitted by maximum likelihood, and both random and explanatory variables were selected by backward elimination.
Second, increases in SW and SH (ΔSW and ΔSH) relative to ΔSL were analysed by LMM to test whether ΔSW and ΔSH vary between sites and/or origins. The ΔSW and ΔSH were used as response variables, and the original site of clams, site of release, and ΔSL were used as initial explanatory variables. Cage and duration were incorporated as random variables. Models were fitted by maximum likelihood, and both random and explanatory variables were selected by backward elimination.
Third, to examine the factors affecting the direction of marginal shell growth, generalized linear mixed models (GLMMs) with Gaussian family and log-link function were constructed. The response variables were ΔSW and ΔSH. Initial explanatory variables were site, log-transformed individual growth rate (mm SL per 30 days), and log-transformed initial index of SI1 or SI2. The log-transformed ΔSL was incorporated as an offset term. The random variables were cage and duration. Models were selected based on the Akaike information criterion (AIC). To test whether the growth rates of clams vary between sites and/or origins, a LMM was constructed for the growth rate during each period, using the origin site of clams and site of release as explanatory variables and cage as a random variable. The model was fitted using the maximum likelihood and was selected.
All statistical analyses were performed using the R software (www.r-project.org) and packages ‘lme4’, ‘lmerTest’, ‘MuMIn’ and ‘car’.
Results
Shell morphology of wild clams
Shell indices SI1 and SI2 of wild clams were both significantly greater at Site 2 than at Site 1 (Figure 2). In the LMM, clam SL positively affected SI1, whereas SL negatively affected SI2 (Table 1). Greater indices at Site 2 than at Site 1 were also observed in the model. SL was not significantly different between the sites (Mann–Whitney U test, U = 24638, P = 0.48).
Table 1. Selected linear mixed models for shell indices in wild asari clam
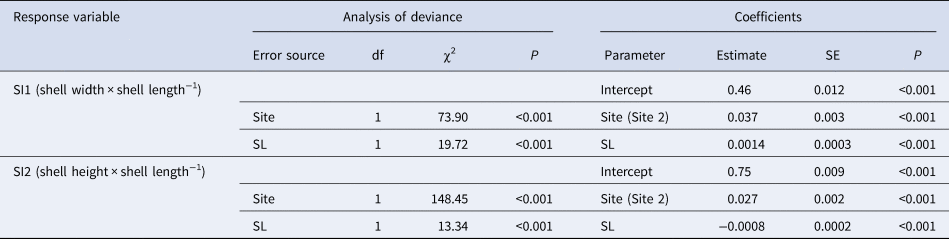
Analysis of deviance was carried out using the Type II Wald χ2 test. All initial explanatory variables of the site and shell length (SL) were selected in both models. The coefficient of site (Site 2) was evaluated based on Site 1.
Shell morphology of translocated clams
Shell index 1 was mostly greater at the end of the experiment than at the beginning (Figure 3), and the beginning or end was selected as an explanatory variable in the LMM (Table 2). The selected LMM showed that the origin of clams affected SI1: clams originating from Site 2 showed greater SI1. The contribution of beginning/end was greater than the origin of clams (Table 2). On the contrary, SI2 at the end of the experiment was lower than at the beginning (negative coefficient for ‘end’ in Table 2), and the variation in SI2 was largely governed by the origin (greater χ2 in the ‘origin’ than ‘beginning/end’).
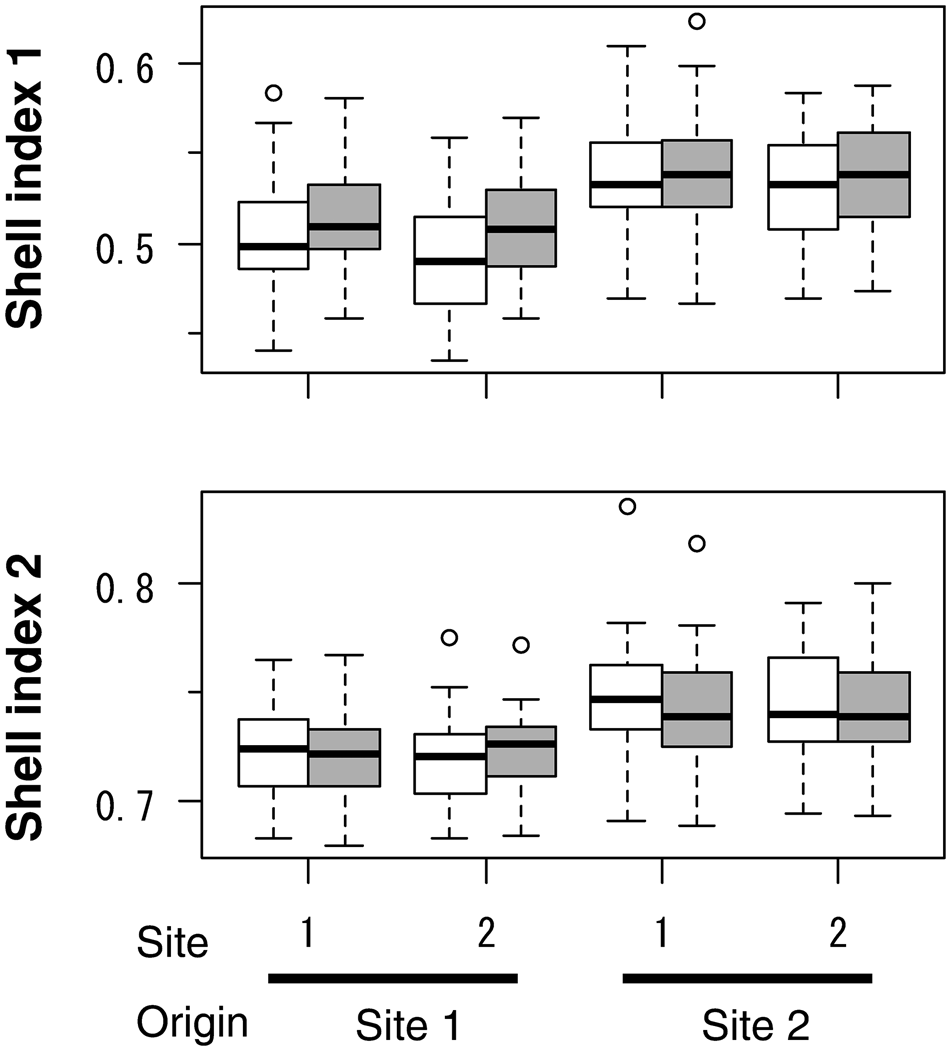
Fig. 3. Shell indices of caged asari clam in the field experiment. Data of survivors with growth of ≥0.5 mm shell length are shown. Open and solid boxes indicate values at the beginning and the end of the experiment, respectively. Site shows the location of caging, and origin shows the site where the clams inhabited before collection for the caging. Sample sizes were 53, 43, 51 and 36 for clams from Site 1 to Site 1, from Site 1 to Site 2, from Site 2 to Site 1, and from Site 2 to Site 1, respectively. Boxes show the 25% and 75% quartiles and median, dashed vertical bars show the maximum and minimum values, and open circles show outliers.
Table 2. Selected linear mixed models for shell indices in caged asari clam with ≥0.5 mm increase in shell length (ΔSL) in the field experiment
Analysis of deviance was carried out using the Type II Wald χ2 test. The B/E and ΔSL indicate the beginning or end of the experiment and the increment of shell length, respectively. The coefficients of origin and site were evaluated based on Site 1.
The site and origin were not selected in the LMM for ΔSW. In contrast, ΔSH was greater at Site 2 than at Site 1, and clams originating from Site 2 exhibited a greater ΔSH (Figure 4, Table 2).
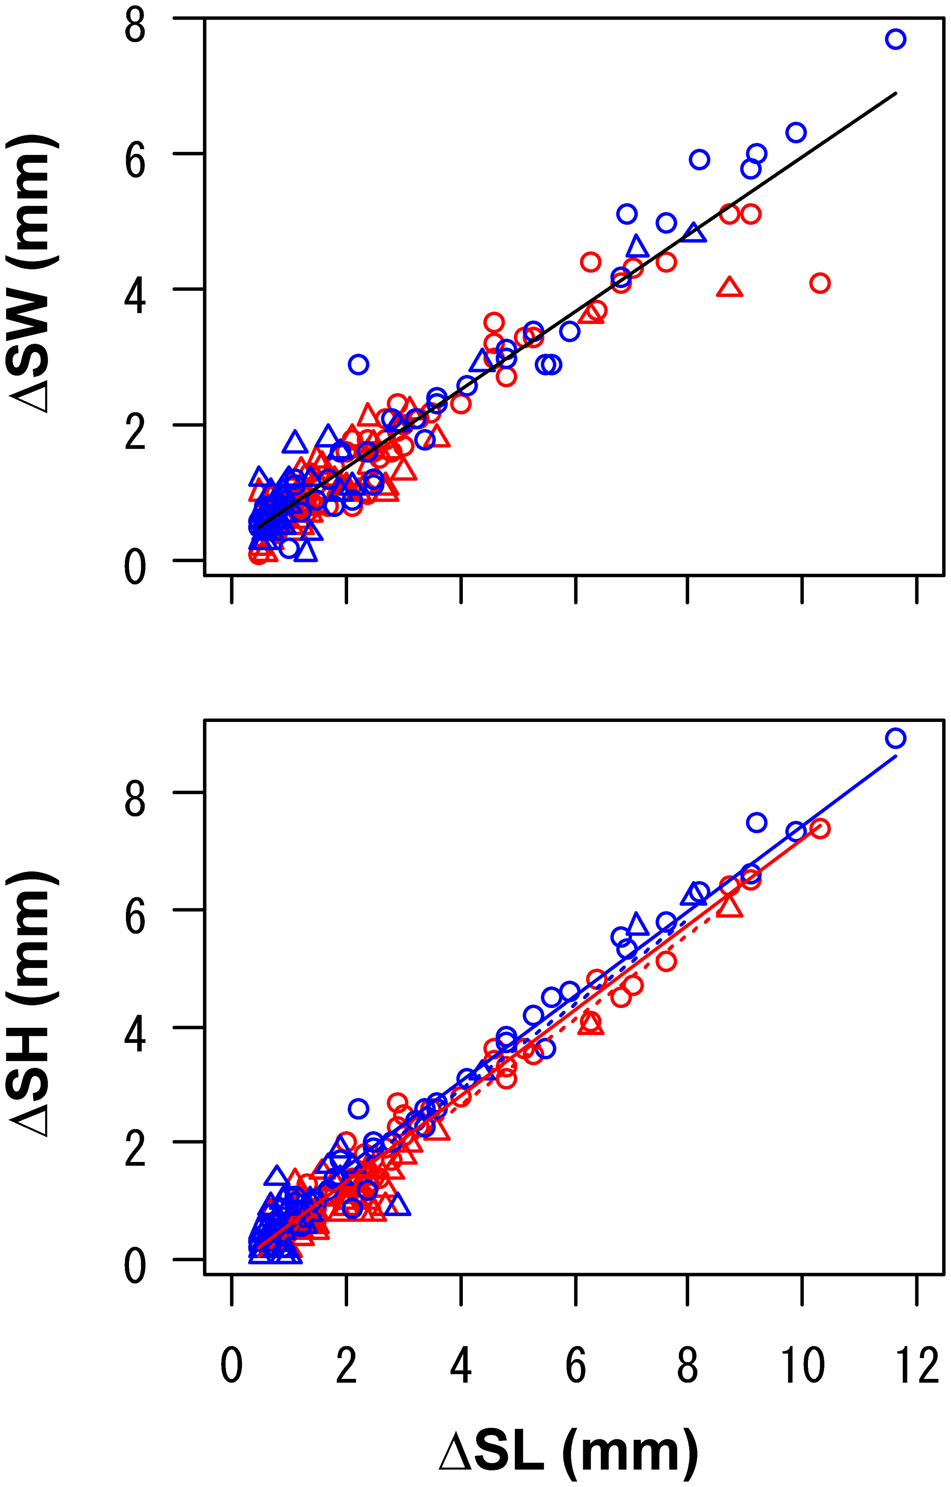
Fig. 4. Relationships between the increment of shell length (ΔSL) and that of shell width (ΔSW) or shell height (ΔSH) in caged asari clam in the field experiment. Data of survivors with increments of ≥0.5 mm in shell length are shown. Data were pooled for cages with different durations. Sample sizes were the same as Figure 3. Circles with solid lines and triangles with dotted lines show the origin of clams as Sites 1 and 2, respectively. Red and blue colours (in online version) show the sites for release (i.e. caging) as Sites 1 and 2, respectively. Lines show linear predictions derived from the linear mixed models (Table 2).
The growth rate of clams did not differ between the sites but differed between origins (Figure 5). In the LMM for growth rate during each of 3, 6 and 12 months, the site was consistently eliminated and the origin was selected as an explanatory variable: clams originating from Site 1 exhibited greater growth rates. In the GLMM for the change in shell indices, ΔSW ΔSL−1 was governed largely by the individual growth rate, whereas ΔSH ΔSL−1 was driven by the site (Table 3). Slower-growing individuals tended to increase ΔSW ΔSL−1 more than faster-growing individuals, and clams released at Site 2 exhibited a slightly larger ΔSW. In contrast, clams released at Site 2 exhibited a greater ΔSH, but a small contribution of growth rate was also observed, although the effect of growth rate was positive.
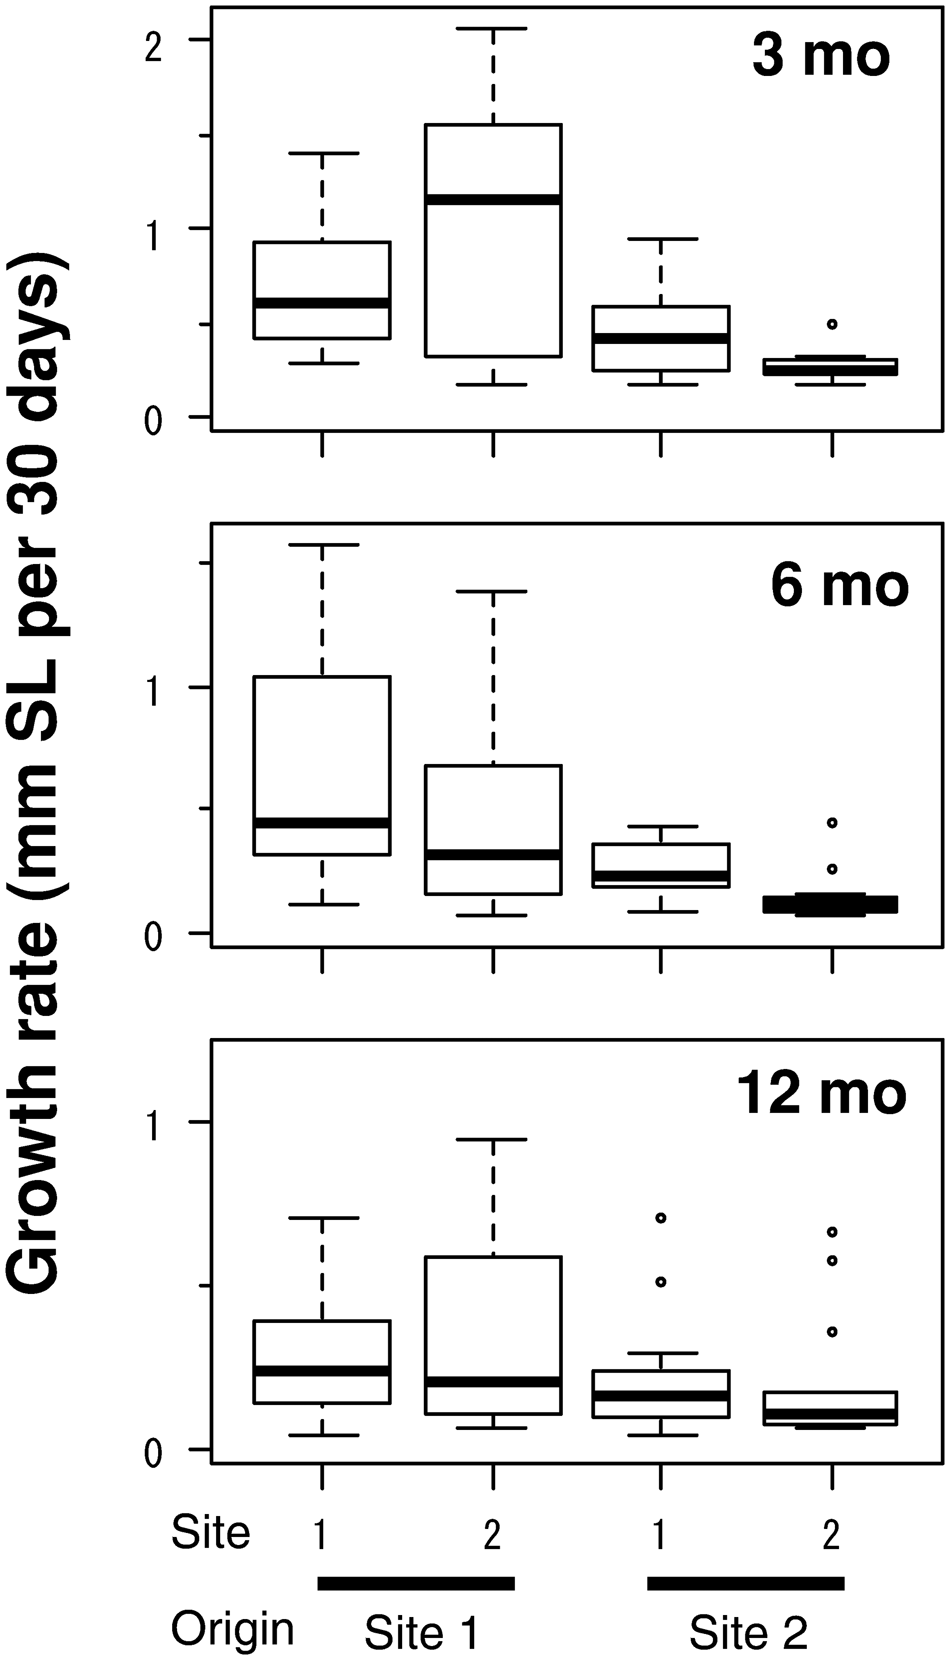
Fig. 5. Growth rate in shell length of caged asari clam in the field experiment. Data of survivors with increments of ≥0.5 mm in shell length are shown. Sample sizes were the same as Figure 3. Boxes show the 25% and 75% quartiles and median, dashed vertical bars show the maximum and minimum values, and open circles show outliers.
Table 3. Selected generalized linear mixed models (Gaussian family with log-link function) for shell shape in caged asari clam in the field experiment.
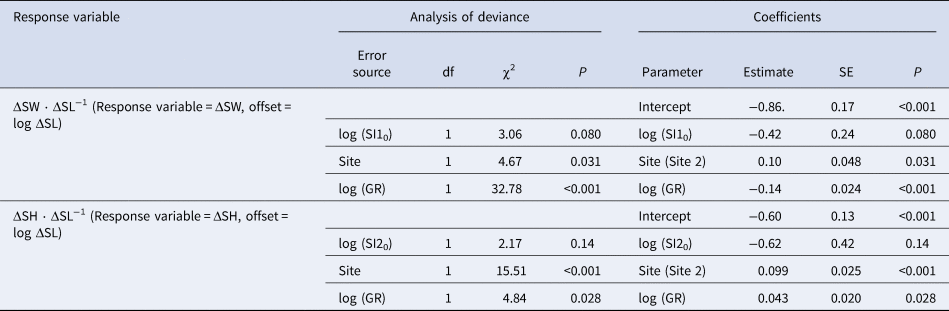
Analysis of deviance was carried out using the Type II Wald χ2 test. The ΔSW, ΔSL, ΔSH, SI10, SI20, and GR indicate increments in shell width, shell length, and shell height, initial shell index 1, initial shell index 2, and growth rate (mm shell length per 30 days), respectively. The coefficient of site (Site 2) was evaluated based on Site 1.
Discussion
This study confirmed that clams exhibit ecophenotypic plasticity in marginal shell growth. Individuals transplanted from the unsuitable site (Site 2) to suitable habitat (Site 1) showed a decrease in SH relative to SL (SI2, Figure 3), whereas individuals transplanted from Site 1 to Site 2 exhibited an increase in both SW and SH. This result coincides with previous suggestions regarding shell morphological plasticity in this species (Choe & Ohshima, Reference Choe and Ohshima1958; Kakino, Reference Kakino1996) and other species (Stirling & Okumuş, Reference Stirling and Okumuş1994).
The present study is the first to elucidate that shell shape varies not only by the environment (external factor) but also by individual growth rates (internal factor). ΔSW was primarily driven by the growth rate, whereas ΔSH was chiefly affected by the environment (site), suggesting that fast-growing individuals in unsuitable habitats exhibit relatively small ΔSW and large ΔSH. To our knowledge, such a different pattern in the marginal growth direction between width and height has been reported for the first time. The following observations support this pattern. The SW relative to SL (SI1) mostly increased in caged clams during the experiment, irrespective of the release site or the origin of the clams (Figure 3). This result indicates that clam growth was reduced, possibly due to the artificial caging effect. The SH relative to SL (SI2) increased in the clams originating from suitable habitat (Site 1) and released at unsuitable habitat (Site 2), whereas it decreased in the clams originating from Site 2 and released at Site 1.
Different directions for shell marginal growth between SW and SH were also observed in the experiment in 2009, in which clams were caged at various densities (Tomiyama & Sato, Reference Tomiyama and Sato2021). ΔSW ΔSL−1 was primarily explained by the individual growth rate, similar to the present study, whereas ΔSH ΔSL−1 was explained solely by the original SI2. No density-dependent effect was detected for either index. Thus, the different responses of marginal shell growth in SW and SH are likely.
For asari clams, the ratio of SW to SL (SI1) has been demonstrated to correlate with the nutritional condition of the clam (Watanabe & Katayama, Reference Watanabe and Katayama2010) or the current velocity of the habitat (Kakino, Reference Kakino2002). Although the relationships between either SI1 or SI2 and shell growth rate determined from the microstructure of shell sections were weak (Watanabe & Katayama, Reference Watanabe and Katayama2010), clams with low growth rates can be expected to exhibit relatively greater ΔSW and ΔSH. Our models showed that SI1 was regulated by growth, whereas SI2 was affected mainly by the environment. Such different patterns of relative growth were also observed in asari clams in a previous study (Cigarría & Fernández, Reference Cigarría and Fernández1998), in which clams in denser conditions showed smaller SH, whereas no difference in SW was observed between clams at various densities.
The mechanisms underlying the variation in the shell growth directions remain unclear. Environmental conditions do not affect the shell biomineralization process (Gizzi et al., Reference Gizzi, Caccia, Simoncini, Mancuso, Reggi, Fermani, Brizi, Fantazzini, Stagioni, Falini, Piccinetti and Goffredo2016). SW is related to shell thickness, and slow-growing individuals have thicker shells (Watanabe & Katayama, Reference Watanabe and Katayama2010). It is unclear why SH responds differently to SW response, although many studies have suggested the relevance of environmental factors to shell shape variations (e.g. reviewed by Costa et al., Reference Costa, Aguzzi, Menesatti, Antonucci, Rimatori and Mattoccia2008). Differences in environmental factors between sites, such as substratum (sandy at Site 1) and food supply (greater current velocity at Site 1), were probably related to habitat suitability of asari clams and would affect their shell shapes. However, variations in elevation or other environmental factors in microhabitats within each site may also affect the shell growth direction. Further studies are required to reveal the mechanisms regulating marginal shell growth patterns and shell morphology of clams.
In conclusion, this study demonstrated the plasticity of clam shell shapes through a cross-transplantation experiment. Notably, shell growths in width and height relative to the length were possibly regulated by different mechanisms. The SW relative to SL was most closely related to the internal factor (growth rate), whereas SH relative to SL was related to external factors (site for transplantation). Such implications are expected to contribute to the understanding of the mechanisms of shell-shape plasticity in bivalves.
Acknowledgements
I thank the staff of the Fukushima Prefectural Research Institute of Fisheries Resources (formerly Soma Branch, Fukushima Prefectural Fisheries Experimental Station) for their cooperation in the field experiments. I also thank the anonymous reviewers for their helpful comments on the draft.
Financial support
This research received no specific grant from any funding agency, commercial or not-for-profit sectors.


