Introduction
Solenopsis invicta Buren, the red imported fire ant (RIFA), is an invasive pest originating from South America. RIFA have been introduced into USA, West Indies, Asia (China, Hong Kong, Taiwan), New Zealand and Australia (ISSG, 2007) and have potential destructive impacts on lifestyle and economy. Aggressive defence characteristics include the ability to sting repeatedly with alkaloid venom, causing pain, anaphylaxis, suffocation or even death in humans, livestock, domestic pets and wildlife animals (Nattrass & Vanderwoude, Reference Nattrass and Vanderwoude2001; Jetter et al., Reference Jetter, Hamilton and Klotz2002). Non-defence characteristics of RIFA infestations also can have severe negative impacts through attraction to electrical equipment (MacKay et al., Reference MacKay, Vinson, Irving, Majdi and Messer1992; Jetter et al., Reference Jetter, Hamilton and Klotz2002) and the effect of the omnivorous feeding habits upon ecosystem biodiversity and agriculture (Porter & Savignano, Reference Porter and Savignano1990; Banks et al., Reference Banks, Adams and Lofgren1991; Morrison et al., Reference Morrison, Williams, Oi and Potter1997; Vinson, Reference Vinson1997; Allen et al., Reference Allen, Forys, Rice and Wojcik2001; Stiles & Jones, Reference Stiles and Jones2001; Jetter et al., Reference Jetter, Hamilton and Klotz2002; Maloney & Vanderwoude, Reference Maloney and Vanderwoude2002).
These negative impacts of the introduction of RIFA, along with their large populations and rapid spread, mean that aggressive elimination and control methods are required for an eradication program. For this to be successful, an understanding of the social characteristics and spread mechanisms of RIFA is needed. It has long been accepted that there are two social forms, the monogyne form that has a single reproducing queen per nest and the polygyne form with multiple reproducing queens per nest. The two forms have marked differences in their social and reproduction characteristics (Ross & Keller, Reference Ross and Keller1995). Monogyne queens initiate an entirely new nest after in-flight mating and have the ability to fly distances of up to several kilometres to establish the new nest, whereas polygynes often return to an established nest after mating, or occasionally mate in the nest, and have been reported to typically move less than a few meters from the natal nest (Holway et al., Reference Holway, Lach, Suarez, Tsutsui and Case2002). It was further reported that the behavioural differences between the two forms were dictated by variation in the product of the Gp-9 gene, which probably encoded for a pheromone binding protein (Ross & Keller, Reference Keller and Ross1998; Krieger & Ross, Reference Krieger and Ross2002). This olfactory mechanism enabled recognition of social form, and it was thought that the different social forms would attack those of the other (Keller & Ross, Reference Keller and Ross1998). The two codominant Gp-9 alleles were labelled B and b, with monogynes represented as homozygous genotype BB and polygynes represented by the presence of the b allele. There are a number of studies that support this distinction (Shoemaker & Ross, Reference Shoemaker and Ross1996; Ross & Keller, Reference Keller and Ross1998; DeHeer et al., Reference DeHeer, Goodisman and Ross1999; Krieger & Ross, Reference Krieger and Ross2002; Valles & Porter, Reference Valles and Porter2003). Within a polygyne colony, female sexuals are represented predominantly as heterozygous Bb as a result of lethal attack upon BB sexuals by Bb workers and a very low viability of bb sexuals (Ross, Reference Ross1997; Keller & Ross, Reference Keller and Ross1998; Fritz et al., Reference Fritz, Van der Meer and Preston2006). Polygyne worker ants are represented by the genotypes Bb (predominant), BB and bb, although bb individuals have been reported to largely perish before adulthood whether alates or workers (Ross, Reference Ross1997; Fritz et al., Reference Fritz, Van der Meer and Preston2006).
Comparison of the Gp-9 nucleotide sequences reported by Krieger & Ross (Reference Krieger and Ross2002) indicates that there are 11 nucleotide substitutions occurring in the coding and non-coding regions, allowing differentiation between the B and b alleles. In addition, Krieger & Ross (Reference Krieger and Ross2002) reported that there are variants of both alleles, with nucleotide differences between the variants occurring usually within non-coding regions. These authors report also a ‘cryptic’ b allele, so far found only in native South America that resembled the B-like sequences rather than the b-like sequences in three positions within coding regions.
Three nucleotide polymorphisms in the coding region (located at codons 42, 95 and 139) are generally considered to be diagnostic for the social form and PCR-based methods for form differentiation have been reported. Krieger & Ross (Reference Krieger and Ross2002) reported a restriction digestion of PCR amplicons (PCR-RFLP). This required amplification of an ∼800 bp region of the gene, followed by digestion using a restriction endonuclease that cuts the amplicon of both genotypes once, and cuts the b allele once further by virtue of a single nucleotide polymorphism (SNP) located at base 1334 of GenBank accession AF427893 (codon 139). Also, Valles & Porter (Reference Valles and Porter2003) reported a multiplex PCR where differential primers utilised the same polymorphism. Examination of the sequences reported by Krieger & Ross (Reference Krieger and Ross2002) shows that the variants within each social form do not differ further at this site, so the B- or b-like variants were not differentiated by either test. In 2007, Gotzek et al. (Reference Gotzek, Shoemaker and Ross2007) studied the Gp-9 sequence from RIFA from multiple sites in USA and the South American native range, and reported a higher number of variants in South America than USA. They concluded that in the native range, all three diagnostic SNPs were required for polygyny status but the codon 139 SNP was sufficient in USA. More recently, Shoemaker & Ascunce (Reference Shoemaker and Ascunce2010) reported individual TaqMan® probe assays to identify the three diagnostic coding SNPs.
In 2001, S. invicta were identifed in southeast Queensland, Australia. As part of the control and monitoring process, it was necessary to rapidly identify the social form of discovered colonies. Both of the aforementioned PCR-based methods were tested for this application. With the PCR-RFLP, the large amplicon required high quality DNA that was not always obtained, depending upon sampling and storage methods for the ants. Often, trapped or sampled ants may be dead or dehydrated and extracted DNA may be too degraded for efficient amplification. The digestion products of the amplicons range from 100 to 500 bp and a high concentration of amplified material was required to observe these clearly (personal observation). Obtaining sufficient amplicon material proved to be time consuming and expensive if DNA degradation had occurred. The multiplexed PCR of Valles & Porter (Reference Valles and Porter2003) also was not successfully implemented, with amplification being weak or unsuccessful for reasons unknown. Hence, there remains a need for a cost-effective method that is suitable for high throughput testing of potentially partially degraded Australian field samples in order to obtain a rapid response to the likelihood of RIFA spread from newly discovered nests.
In recent years, high resolution melt (HRM) has been conveniently incorporated into PCR thermal cyclers, making preamplification and melting steps consecutive and simple to perform. With both reactions being performed in the same tube and apparatus, it is possible to normalise the amplifications for ease of interpretation of the HRM. Here, we describe a HRM method for determination of the melting characteristics of the Gp-9 region flanking the codon 139 SNP used by Krieger & Ross (Reference Krieger and Ross2002) and Valles & Porter (Reference Valles and Porter2003), and demonstrate the utility of HRM to differentiate Gp-9 genotypes in RIFA samples found in Australia.
Materials and methods
Samples
In southeast Queensland, RIFA samples of approximately 100 live worker ants were collected from each nest mound into 5-ml vials and transported to a storage facility. It was noted that occasionally the ants were no longer alive upon arrival, and some samples became dehydrated. At the storage facility, the samples were washed overnight three times in absolute ethanol and stored in ethanol at −20°C. For transfer to the laboratory, to meet air transport (IATA) regulations, subsamples of approximately ten ants from each nest were removed from each vial and placed in a sterile 5-ml vial with tissue soaked in absolute ethanol. On receipt at the laboratory, vials were stored at −20°C until required.
DNA extraction
To eliminate miscalling of a colony social form caused by testing a worker of the BB genotype from a polygyne colony (reported by Fritz et al., Reference Fritz, Van der Meer and Preston2006, to comprise up to 30% workers), approximately eight ants from each sample were transferred into a sterile 1.5 ml-tube (‘bulk sample’). DNA was extracted using DNeasy Blood and Tissue extraction kit (QIAgen, Doncaster, VIC) according to the manufacturer's instructions with minor modification. The ants were crushed using a sterile toothpick, mixed with 50 μl kit buffer ATL and further homogenised with the toothpick. An additional 130 μl buffer ATL and 20 μl Proteinase K solution (QIAgen, concentration not stated) were added prior to lysis for 2–3 hours at 56°C. The remainder of the procedure was as specified by the manufacturer. Where individual worker ants were used for some of the experiments described herein, the volume of elutant was reduced to 50 μl.
The purity and quantity of the eluted DNA was estimated with UV photo-spectrometry. The integrity of the DNA was observed through 1% agarose gel electrophoresis and ethidium bromide staining.
Reference samples
DNA samples from five bulk samples were tested as described by Krieger & Ross (Reference Krieger and Ross2002). Four replicate PCRs from each sample were co-purified using QIAquick columns (QIAgen, VIC) to obtain sufficient amplified material for the reported BsaA1 (New England Biolabs, Genesearch, QLD) digestion. Having been tested thus, these were used subsequently as reference/control samples.
Modified amplification of template region
Given the observed degradation of the extracted DNA, a smaller (∼390 bp) region of Gp-9 was amplified using PCR. The purpose of this step was to provide sufficient quality and quantity of template material for downstream analyses.
Seven previously reported Gp-9 nucleotide sequences from S. invicta were obtained from GenBank (AF427893, AF459414, AF427897, AF427894, AF427900, AF427898 and AF427899) and were aligned and examined using Sequencher v4.8 software (Gene Codes, Ann Arbor, MI, USA). Primers were designed to represent both Gp-9 alleles, to contain the subsequent amplicon used for HRM, and to contain the SNP used by Krieger & Ross (Reference Krieger and Ross2002) and by Valles & Porter (Reference Valles and Porter2003).
PCR mixtures contained 1× polymerase buffer (MBI Fermentas, Quantum, Murrarie, QLD), 1.5 mM magnesium chloride, 200 μM dNTP's, 10 μg bovine serum albumin, 10 pmol primer Gp9-pre3 (5′-CAAATTATTGACGTTTTTGTCTTTC-3′, corresponding to position 1264–1288 of Genbank accession AF427893), 10 pmol Gp9-pre4 (5′-AAGGAGCAAGCTTTTGTCAC-3′, corresponding to 1652–1633 of AF427893), one unit Taq polymerase (MBI Fermentas), approximately 100 ng DNA extracted from ant sample and a volume balance of sterile nuclease-free water to 50 μl. Reactions were cycled using a Px2 thermal cycler (Thermo, Integrated Sciences, NSW) with 94°C for 2 min, 40× (94°C for 30 s; 55°C for 30 s; 72°C for 40 s), and 72°C for 2 min. Amplification consistent with the expected ∼390 bp was confirmed using 10 μl of the reaction for 1.5% agarose gel electrophoresis and ethidium bromide staining.
At first, the PCR products were purified using QIAquick columns, but experiments indicated that this was not necessary for subsequent PCR-HRM.
PCR-HRM
Primers were designed to give an amplicon of 76 bp that included the Type 1 SNP at codon 139 used previously to differentiate B and b alleles. Primers were designed using Primer3 software (Rozen & Skaletsky, Reference Rozen, Skaletsky, Krawetz and Misener2000). Predicted amplicons were checked for secondary folding using DINAMelt (Markham & Zuker, Reference Markham and Zuker2005) and for anticipated melting temperature using POLAND (Steger, Reference Steger1994: via http://www.biophys.uni-duesseldorf.de/local/POLAND/poland).
Amplification reaction mixtures for HRM contained 1× Sensimix HRM (Bioline, NSW), 1 μl Evagreen (Bioline), 2.5 pmol primer Gp9-L2 (5′-TCTGGAGCTGATTATGATGAAGAG-3′, corresponding to 1305–1328 of AF427893), 2.5 pmol primer Gp9-R3 (5′-TTTGATCTCCTGGTTGAGCAC-3′, corresponding to 1380–1360 of AF427893), 8.5 μl sterile nuclease-free water and 2 μl of the previously amplified 390 bp template. In most cases, the template was diluted 10−2 using sterile nuclease-free water but was adjusted according to visual examination of the amplicon intensity on agarose gel. Experiments also were conducted where template was diluted up to 10−6. Reactions were cycled using a Rotorgene 6000 (QIAgen, VIC) at 95°C for 10 min and up to 40× (95°C for 10 s; 56°C for 15 s), with fluorescence acquired on the green channel, or until fluorescence reached a plateau. Following a hold at 60°C for 2 min, the amplified reactions were heated to 85°C with fluorescence acquired at 0.1°C increments on the HRM channel. All acquired data was analysed with Rotogene 6000 software.
Confirmatory tests
Three steps were implemented to confirm the social form inferred by the developed method. Firstly, the ∼390 bp amplicon was purified as described above. Concentrations of eluted amplicons were estimated using UV photospectrometry. Approximately 500 ng amplicon was mixed with 5 U BsaA1 (New England Biolabs, Genesearch, Arundel, QLD) and 1× buffer supplied by the manufacturer. Mixtures were incubated at 37°C overnight, and digestion products were observed with 4% agarose gel electrophoresis (AppliChem Low EEO, Quantum Scientific, QLD) and ethidium bromide staining. Analysis of the aligned Gp-9 nucleotide sequence data described above indicated that the 390 bp would digest to either two fragments of 200 and 189 bp (BB homozygotes) or four fragments of 200, 189, 117 and 72 bp (Bb heterozygotes) by virtue of the aforementioned SNP.
Secondly, the nucleotide sequences of the 390 bp amplicons were determined from individual worker ants from two nests determined by PCR-HRM to be monogyne (BB) and four polygyne (three Bb and one bb). Reactions were performed using Applied Biosytems Bigdye v3.1 chemistry according to the manufacturer's instructions and in both directions with at least one direction in duplicate. Reactions were resolved using Applied Biosystems 3500xL genetic analyser, and proofread and aligned with reported sequences using Sequencher v4.8 software (Gene Codes, Ann Arbor, MI, USA).
Finally, DNA from ten colonies was tested by Dr D. Shoemaker according to Shoemaker & Ascunce (Reference Shoemaker and Ascunce2010).
Results
DNA extraction
DNA eluates obtained from the ants were reasonably pure (A260/A280 1.6–1.9; A260/A230 1.4–1.9; A320=0). Concentrations of eluates ranged from 17 ng μl−1 to 28 ng μl−1. Agarose gel electrophoresis showed marked degradation had occurred, observed as smearing of the DNA throughout the length of the gel lanes.
Reference/control material
The five samples tested with the previously reported PCR-RFLP method, of Krieger & Ross (Reference Krieger and Ross2002), were determined to consist of two samples with digestion fragments consistent with the reported 545, 428, 283 and 117 bp identifiers, and three samples with fragments consistent with the reported 545 and 283 bp identifers only. Because the test samples consisted of diploid worker ants only, it was concluded that two samples were Bb heterozygotes and three were BB homozygotes.
Amplification of 390 bp region
Observed with agarose gel electrophoresis, the described PCR produced amplicons consistent with the expected size of 390 bp from every sample tested, and primer polymerisation was minimal. Amplification from semi-degraded specimens was notably weaker than those where little degradation was observed.
PCR-HRM
Pre-amplification
Amplification demonstrated by an increase in fluorescence was observed from all the previously amplified templates. Cycle threshold (Ct) values were obtained using an arbitrary threshold of 0.1. A plateau was normally reached within the 40 cycles where Ct values were less than 25. Where Ct values were 25 to 30, the addition of five extra cycles were necessary. Serial dilution up to 10−6 showed no adverse effect on the amplification. The Ct values increased, but plateaus were reached within the 40 cycles for dilutions up to 10−5 and within 45 cycles for 10−6. There were no differences, other than expected Ct variations, between the quality of amplification curves observed for the PCR template that had been purified and those that had not, indicating that purification from previous PCR reactants was not a necessary step prior to PCR-HRM.
Direct application of the PCR-HRM conducted upon DNA extracted from ant samples (no prior amplification of the 390 bp amplicon) showed no amplification. In these cases, a Ct value of approximately 40 was sometimes observed, and it was assumed that this represented some primer polymerisation as the same artefact was observed in the negative control reaction where no DNA was added.
High Resolution Melt
When the melting data was presented as a normalised curve, distinct non-parallel curve shapes were observed (see fig. 1a). The BB homozygote samples showed a single sigmoidal melting temperature curve. The heterozygotes showed a melt-curve that started with a lower melting temperature and then became close to that of the homozygotes, a two-phase curve as expected for heterozygous samples.

Fig. 1. Graphical representations of high resolution melt data for five reference S. invicta samples. Samples 1 and 5 represent polygyne (Bb) colonies and samples 2, 3 and 4 represent BB monogyne colonies.
Also, when observed as ‘difference plots’, it was possible to determine if a sample represented a BB homozygote or heterozygote (fig. 1b). Using a BB base-line, Bb samples showed a lower melting temperature (fig. 1b, i); and, using a Bb base-line, the BB samples showed a higher melting temperature (fig. 1b, ii).
When observed as a dF/dT curve, the amplicons from homozygous (BB) samples had a single melting temperature peak at approximately 75±0.3°C, whereas the heterozygous samples had two peaks, indicating the melting of additional amplicons at approximately 73.5°C (fig. 2). It was noted that the BB homozygous samples showed peaks of similar height, whereas the peak heights of the heterozygotes varied. In some cases, the two peaks were of equivalent height (frequency); but, in other samples, the higher temperature melting peaks were repeatedly higher compared to the lower temperature peaks. This appeared to correspond with normalised melt curve located in between the two distinct curve types (fig. 1a), with ‘difference plots’ that showed less marked differentiation (fig. 1b), and with the lower confidence genotype autocalls. These samples included one of the heterozygous reference samples. When this sample was utilised as a third control, for this melt pattern, it was observed to form a small group of samples with similar melt characteristics, which we termed B>b.

Fig. 2. dF/dT data for HRM using five control S. invicta samples.
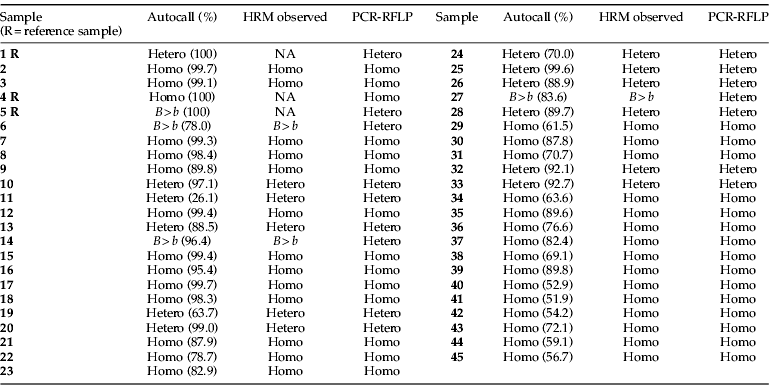
The Rotorgene 6000 software performed an autocall, matching a sample genotype to named reference samples, and assigned each call as a percentage confidence. The results for 45 randomly selected samples are shown in table 1. Of the samples described here, the percentage confidence for the autocalls ranged from 26% to over 99%. However, visual analysis of the curves in the different representations made it straightforward to determine the genotype of the sample irrespective of the autocall percentage.
Table 1. Autocalled and observed HRM results compared with PCR-RFLP (Krieger & Ross, Reference Krieger and Ross2002) for 45 samples of S. invicta from SE Queensland.

NA, not applicable as these sample were used as baselines for data comparisons; R. reference sample; homo, BB homozygote; hetero, Bb heterozygote; B>b, heterozygote (see text for differentiation); autocall, genotype generated from Rotorgene software; HRM observed, genotype determined from combined visual examination of the various representations of the HMR data: normalized curve, d(homozygote), d(heterozygote), d(B>b) and dF/dT.
PCR-RFLP
The restriction endonuclease digestion of the purified 390 bp amplicons yielded a visible restriction pattern from the PCRs. All patterns correlated with the HRM results, where the BB homozygotes were digested into closely sized fragments of 200 and 189 bp and the heterozygotes into four fragments of 200, 189, 117 and 72 bp. The RFLP patterns for the five reference samples are shown in fig. 3, and the results for the 45 samples are listed in table 1. The small group of samples that had the B>b HRM profile showed lower intensities of the two fragments formed from the b allele but were confirmed nonetheless as heterozygotes.

Fig. 3. Agarose (4%) gel electrophoresis of BsaA1 digested 390 bp amplicons from representative sample of RIFA genotypes. Lanes 1 and 8, 50 bp DNA ladder (MBI Fermentas); lane 2, sample #1, polygyne, heterozygote, restriction fragments 200, 189, 117 and 72 bp; lane 3, sample #2, monogyne, BB homozygote, restriction fragments 200 and 189 bp; lane 4, sample #3, monogyne, BB homozygote, restriction fragments 200 and 189 bp; lane 5, individual RIFA from polygyne colony #2003, bb homozygote, restriction fragments 200, 117 and 72 bp; lane 6, sample #4, monogyne, BB homozygote, restriction fragments 200 and 189 bp; lane 7, sample #5, polygyne, heterozygote B>b, restriction fragments 200, 189, 117 and 72 bp. Depicted are faint remnant undigested amplicons (390 bp), faint primer polymerisation (50–55 bp), duplexes of 200 and 189 bp (B allele), and further digestion of the 189 bp fragment into 117 and 72 bp (b allele).
PCR-HRM performed on single ants
When ten single ants from each of a number of colonies determined by PCR-HRM to be polygyne were tested individually, the proportion of heterozygotes and homozygotes varied between colonies. This was consistent with the variation in peak height and two-phase melt curve noted for the pooled samples designated B>b, Bb and b>B (fig. 4). In one polygyne colony, bb homozygotes were noted. These bb individuals were observed to have a single sigmoidal melt curve, indicating denaturation at a lower temperature than the monogynes, and a single peak at approximately 73.5°C on the dF/dT graph (fig. 4). Restriction digests confirmed this genotype (fig. 3, lane 5).

Fig. 4. Variation within ten individual worker genotypes in polygyne colonies.
HRM melt curves (left) and dF/dT (right) indicate the proportions of BB homozygotes, bb homozygotes and Bb heterozygotes in four polygyne colonies.
Nucleotide sequence
Nucleotide sequencing of the 390 bp amplicons obtained from two monogyne and four polygyne colonies confirmed the identity of the amplicon as the Gp-9 gene fragments. Because the amplicons were sequenced directly (without cloning), the SNP site in three heterozygous polygyne samples was represented by double peaks (G/A). The fourth polygyne sequence was generated from a sample determined to be a bb homozygote. The sequences of the HRM fragment aligned to the corresponding region of the Gp-9 sequence variants published by Krieger & Ross (Reference Krieger and Ross2002) are depicted in fig. 5. The Australian data have not been reported in full or submitted to GenBank as, without cloning individual amplified fragments, they are of limited value. The intention was to only confirm the identity of the amplicons with the Gp-9 gene.

Fig. 5. HRM fragment sequence of two monogyne colony and four polygyne colonies from SE Queensland compared to published Gp-9 sequences (Krieger & Ross, Reference Krieger and Ross2002). *, SNP at location 1334 of AF427903; underlined sequence depicts restriction site BsaAI (b allele sequences only). R, A/G double peak.
Discussion
The results presented here demonstrate that HRM can differentiate between the B and the b alleles at codon 139 previously utilised by Krieger & Ross (Reference Krieger and Ross2002) and Valles & Porter (Reference Valles and Porter2003), to discriminate the two social forms of S. invicta, and that this may be applied to RIFA in Australia. HRM is fast (one day for entire procedure) and cheap to perform compared to the PCR-RFLP and the TaqMan® assays. HRM chemistry is a similar cost to reagents for a conventional PCR, hence the cost of the HRM test is equivalent to a cost of two PCRs. In comparison, the aforementioned PCR-RFLP required four concurrent PCRs, a PCR clean-up column and the restriction enzyme. Both methods, however, are cheaper than the three fluorescent-labelled probes required for the TaqMan® assay. Moreover, HRM has significantly less handling than the previously reported PCR-RFLP, making it more suited to high-throughput analysis, although the necessity for the pre-PCR results in a longer test duration than the TaqMan® assay.
Ambiguous results have not been observed with the samples analysed in this study nor from several thousand subsequent samples tested. However, if needed, confirmation could be achieved by DNA sequencing or restriction digestion of the 390 bp amplicon, without the necessity of further amplification. Moreover, the nucleotide sequence of the 390 bp amplicon includes a second polymorphism reported to differentiate the social forms (bases 1398-9 of AF427893) and identify the cryptic allele b’.
The HRM method is suitable for genotyping of partially degraded DNA, likely due to the short (390 bp) amplicon used as template material. Our previous attempts to implement the method described by Krieger & Ross (Reference Krieger and Ross2002) demonstrated that sufficient quantities of the 800+ bp amplicon for the endonuclease digestion could be amplified from similarly degraded DNA only after at least four replicate amplification reactions. It is unknown from the data presented here whether the observed degradation was attributed to the sampling or the method of DNA extraction. Nevertheless, the amplification of 390 bp fragment was necessary to provide sufficient template for the PCR-HRM.
Of interest was the observed variation of b frequency in polygyne colonies and the corresponding variation in autocall confidence percentage. Mendelian law indicates the diploid polygyne workers may consist of BB, Bb, bB and bb genotypes. However, it has been reported that bb workers frequently perish (Ross, Reference Ross1997). In the United States, polygyne workers have been reported as approximately one third BB and two thirds Bb genotypes, while in South America a higher proportion of polygyne workers have the BB genotype (Ross, Reference Ross1997; Fritz et al., Reference Fritz, Van der Meer and Preston2006). To investigate briefly if the variable frequencies observed with HRM were a result of PCR artefact or a true representation, a number of individuals were tested from colonies that showed different apparent proportions when bulk samples were tested. The frequency appeared to be representative, with B>b colonies showing presence of homozygous BB workers as well as Bb; and, in the b>B colony, homozygous bb workers were detected along with Bb and BB individuals. However, further controlled experiments, using larger numbers of colonies and individuals, are needed before the method can claim to represent allelic frequency in a colony.
Gotzek et al. (Reference Gotzek, Shoemaker and Ross2007) reported that three nucleotide differences from three coding sites within the Gp-9 gene are necessary to determine the polygynous form in South America. With this in mind, ten of the RIFA samples tested here were tested also by Dr DeWayne Shoemaker (USDA, Gainesville, FL, USA) using three independent TaqMan® probe assays. For all samples, the identified genotypes were the same as identified with the described HRM. The ten samples were further tested by Dr Shoemaker using the method described by Valles & Porter (Reference Valles and Porter2003), and the same results were obtained (data not described). This suggests that, at least in Australia, the three markers may not be required. This may be a result of reduced genetic diversity associated with a population bottleneck with few founding queens, and this hypothesis is consistent with the limited number of COI haplotypes detected in the Australian samples (D. Shoemaker, personal communication) compared to the native range. However, should HRM (or any assay detecting a single SNP in this gene) indicate polygyny where this is unexpected or questionable, it may be further investigated through nucleotide sequencing of the of the Gp-9 gene, using additional HRM to detect the other two polymorphic sites within the gene or using the TaqMan® assays.
In summary, we have described an alternative method for the reliable, objective and easily interpretable differentiation between Gp-9 B and b alleles, and determination of social form, of S. invicta colonies in Australia. This assay is suited for high-throughput analysis and, importantly, suited to partially degraded DNA obtained from field samples where liquid nitrogen or absolute ethanol cannot be legally or safely utilised at the sampling site. This method will assist in the rapid classification of RIFA nests into polygynes or monogynes, hence aiding the assessment and prediction of dispersal of the ants. The method could be applied to other RIFA-affected regions where the allelic diversity of the Gp-9 gene has been investigated and the correlation of SNPs within this gene with social form has been considered.
Acknowledgements
This work was funded by the States and Territories of Australia through the National Fire Ant Eradication Program.
The authors thank Dr Sam Billingham and Ms Evette Kairuz from Bioline (Aust), Alexandria, NSW, for the donation of Quantace HRM mix for the establishment of the method described.
The authors thank also Dr DeWayne Shoemaker, USDA, Gainesville, Florida, for confirmatory testing of RIFA DNA.