Introduction
Sugarcane (Saccharum officinarum L.) is a perennial forage with high potential dry matter yield. It is used widely in the production of sugar, ethanol and animal feed in both tropical and sub-tropical climates (Pate et al., Reference Pate, Alvarez, Phillips and Eiland2002; van der Weijde et al., Reference van der Weijde, Alvim Kamei, Torres, Vermerris, Dolstra, Visser and Trindade2013). World sugarcane production in 2014 was estimated at about 1.9 billion tons of sugarcane from about 27.7 million ha in more than 90 countries. Brazil, India, China, Pakistan, Thailand and Mexico are among the world's largest producers of sugarcane. It is also grown in countries such as the USA, Portugal and Spain (FAO, 2016), but only in late summer and early autumn.
The use of sugarcane as feed for dairy cattle with high genetic potential is limited by its low crude protein (CP) content and fibre quality, which reduces voluntary consumption and limits animal performance. However, both sugarcane and maize silage are used in Brazil to supplement dairy cattle diets during the dry season, which also occurs in other countries due to the limitation in pasture production (Kawashima et al., Reference Kawashima, Sumamal, Pholsen, Chaithiang and Boonpakdee2002; Suksombat and Mernkrathoke, Reference Suksombat and Mernkrathoke2005; Lima et al., Reference Lima, Carvalho, Mattos, Nussio, Castro and Amaral2012). Generally, these roughages are used separately in cattle diets. Sugarcane is used in the diets of dairy cows of low genetic potential and maize silage is used for high-producing cows. However, recent studies have shown that sugarcane can be used by cows with high genetic potential. Migliano et al. (Reference Migliano, Silano, Martins, Arcari and Santos2016) report that sugarcane can be supplied in the diets of Holstein cows, with an average production of 17–19 kg of milk per day per cow, provided that the diet contains 130 g/kg CP. Andrade et al. (Reference Andrade, Rodrigues, Detman, Valadares Filho, Castro, Trece, Silva, Fischer, Weiss and Marcondes2016) reported that the use of fresh or ensiled sugarcane with or without additives can be offered to cows producing 22 kg of milk per day, in a roughage to concentrate ratio (R : C) of 400 : 600 g/kg DM, without affecting intake or the production of milk.
However, the use of a sugarcane mixture with maize silage (500 : 500 g/kg DM) in diets of high-yielding cows has shown a higher R : C and similar milk production compared with the exclusive use of sugarcane. In a study carried out by Magalhães et al. (Reference Magalhães, Campos, Cabral, Mello, Freitas, Torres, Valadares Filho and Assis2006), it was reported that maize silage can be substituted for sugarcane by up to 330 g/kg in the diet of cows with average yields of 24 kg of milk/day, in an R : C of 600 : 400 g/kg DM. However, Pires et al. (Reference Pires, Susin, Simas, Oliveira Júnior, Fernandes, Araújo and Mendes2010) reported that in isonitrogenous diets, maize silage can replace sugarcane at up to 500 g/kg of roughage, in an R : C 500 : 500 g/kg DM, without negative effects on dairy cattle performance in Holstein cows producing up to 18 kg milk/day. Furthermore, Lima et al. (Reference Lima, Carvalho, Mattos, Nussio, Castro and Amaral2012) found that replacing 80 g/kg of maize silage neutral detergent fibre (NDF) by sugarcane NDF is recommended for Holstein cows with high genetic potential, during mid-lactation.
Studies have shown that ruminants fed low-quality fibre have decreased dry matter intake (DMI) with the intense production of acetate during the metabolism of digestion and absorption of nutrients. This is responsible for an increase in internal heat (e.g. heat increment) and imposes higher energy costs and contributes to decreased animal performance (West, Reference West1999). Thus, feed intake has a substantial effect on heat production and should be considered in an effective nutritional and environmental management programme, since fibre-rich diets also contribute to heat stress (West, Reference West1999). It should also be considered that high-production cows are more vulnerable to thermal stress due to the high metabolic rate needed for milk production (Renaudeau et al., Reference Renaudeau, Collin, Yahav, de Basilio, Gourdine and Collier2012).
Titto et al. (Reference Titto, Negrão, Titto, Canaes, Titto and Pereira2013) mentioned that an evaporative cooling system is important to maintain milk production throughout the year, but in tropical countries, in the autumn and winter, this would be unnecessary because of low environmental temperatures (ETs). In this sense, a balanced high-quality diet coupled with environmental cooling is important to minimize possible heat stress. West (Reference West1999) reported that the use of high-quality roughage in the diet of cows during hot weather would provide more digestible fibre content, a higher fermentable sugar content and therefore, an increase in the production of volatile fatty acids and consequently better responses in milk production.
As global climate change advances, the production of dairy cattle under real freestall-type feedlot conditions in the tropical summer period will probably need to include an evaporative cooling system (fans and nebulizers) to minimize the possible effects of thermal discomfort in lactating pregnant cows. However, food is one of the factors that contribute to the maintenance of internal heat in the process of digestion and absorption of nutrients. It is also known that diets with low-quality bulk produce higher amounts of heat and incur higher energy costs in the production process. Thus, one way of diminishing the negative effects of sugarcane fibre quality in the diets of high-production cows would be to increase the use of concentrates, but with caution, as mentioned in the literature (Gonzalez et al., Reference Gonzalez, Manteca, Calsamiglia, Schwartzkopf-Genswein and Ferret2012; Souza et al., Reference Souza, Sousa, Mesquita, Mesquita and Silva2017). Another strategy for using sugarcane in the diets of high-production cows would be to mix maize silage (500 : 500 g/kg DM) with the objective of improving the fibre quality of the diet and maximizing the use of maize silage in the herd, in order to maintain the production and quality of milk due to qualitative factors of the roughage (sucrose and starch) used in the diet.
Knowing the functional relationships of the environment with the physiological and behavioural mechanisms of the acclimatization of animals to stressful environments will contribute to the choice of management methods that promote animal welfare and production efficiency, especially during the stressful summer months (Bernabucci et al., Reference Bernabucci, Lacetera, Baumgard, Rhoads, Ronchi and Nardone2010). Thus, the diet of cows and environmental conditions may impose physiological, productive and qualitative responses in milk with better efficiency of feed utilization. The current study was developed under natural climatic conditions in a freestall-type feedlot system, with and without the inclusion of an evaporative cooling system. The goal was to develop practical strategies to increase feed intake, milk production, milk quality and productivity in cows, whilst minimizing the possible negative effects of heat stress to improve thermal comfort. The approach was to compare the productivity and physiological responses and milk quality of Holstein cows fed a maize silage-based diet or roughage mixture with maize silage and sugarcane under two environmental conditions and to compare physiological parameters twice daily, with and without evaporative cooling.
Materials and methods
Location and conditions of the experiment
The experiment was conducted in Americana, Sao Paulo, Brazil (22°45′S, 47°16′W, 545 m asl). According to the Köppen classification system (Alvares et al., Reference Alvares, Stape, Sentelhas, Gonçalves and Sparovek2014), the climate is characterized as Cwa (Humid subtropical, summer rainy season and a dry season in winter) with average temperatures below 18 °C in the cold months and above 25 °C in the hottest months of the year. The region has an average annual temperature of 22 °C and an average annual rainfall of 1368 mm, with prevailing winds from the south-east (CEPAGRI, 2016).
During the experimental collection period from November to February, the rainfall was 571 mm and the average maximum and minimum temperatures were 30.9 and 18.3 °C, respectively. The ET and relative humidity (RH) were measured in-house, as a reference and in the freestall-type feedlot. A thermo-hygrometer data logger (Testo-171®, metallic) was programmed to take readings every 30 min over a period of 80 consecutive days. The ET and RH reference values in-house ranged from 23 to 25 °C and from 57 to 74%, respectively.
Animals and installations
Eight Holstein multiparous cows (137 ± 10.0 days of lactation, 21 ± 3.7 kg milk/day) with a mean body weight (BW) of 527 ± 36.5 kg were split into two groups and housed in a freestall-type feedlot system adapted with a waterproof canvas centre partition, with an evaporative cooling system including a fan with (W) or without (Wo) nebulizers. The installation was divided into eight pens, with four pens per environmental condition (W and Wo). The area for the animals was 5.0 × 2.2 m2 with separate troughs, automatic water availability and access to two beds of fine washed sand for resting.
The adapted freestall-type feedlot had the following dimensions and characteristics: 36 × 12 m2, open sides, an east-west circulation corridor of 2.9 m wide, a ceiling height of 3.8 m on each side, a gabled roof covered with clay tiles and rustic concrete flooring.
The nebulization system was set 2.5 m above the centreline between the feeders and the sand bed and consisted of a polyvinyl chloride tube with five nebulizers spaced at 1.8 m. The water flow in the sprinkler line was 30 l/h in an air-conditioned environment. Nebulizers were automatically activated to sprinkle every 7 min for a duration of 1 min to prevent the floors becoming wet. The 1/4 hp (horsepower) fan was installed at a height of 2.5 m and angled downward 10° from vertical and had the following characteristics: 0.9 m internal diameter, 300 m3/h flow rate, 495 rpm (rotations per minute) and produced air flows up to 2.5 m/s at the rear of the animal. A temperature sensor was suspended in the lateral portion of the freestall-type feedlot without the fan and nebulizers. This site reflected the ambient temperature and avoided interference from other heat emissions. The temperature sensor was connected via a cable to the central operating system, which prompted the activation of automated ventilation and nebulization at 22 °C and turned them off at <22 °C.
Characterization of environmental parameters
During the experimental period, ET and RH were recorded with a thermo-hygrometer data logger (Testo-171®, metallic) that was installed in the central portion of each experimental area (environment). The temperature-humidity index (THI) was determined according to Johnson (Reference Johnson1980), using the dew point temperature (DPT) and enthalpy (H) (kJ/kg dry air). The following classification system for THI, respiratory rate (RR) and rectal temperature (RT), respectively, was adopted from Renaudeau et al. (Reference Renaudeau, Collin, Yahav, de Basilio, Gourdine and Collier2012): <68 no heat stress; heat stress threshold 68 to 71, >60 breaths/minute (BPM) and >38.5 °C; mild-moderate heat stress 72 to 79, >75 BPM and >39.0 °C; moderate-severe stress 80 to 89, >85 BPM and >40.0 °C; severe heat stress 90 to 98, 120 to 140 BPM and >41.0 °C.
The following temperature levels were defined, according to Igono et al. (Reference Igono, Bjotvedt and Sanford-Crane1992): <21 °C cold, 21–27 °C comfortable and >27 °C warm. The following environmental parameters were collected to characterize the thermal condition of the installations during the experiment: AT, RH, H, DPT and THI.
Diets
Two diets based on the total mixed rations (TMR) of cows were established, according to the chemical composition of roughage and concentrates required to produce 20 kg milk/day (Tables 1 and 2) (NRC, 2001). The concentrate formulation was prepared according to the ingredients of the concentrated mixture (g/kg): ground maize 376.3, soybean meal 193.8, wheat bran 191.0, cottonseed 162.2, limestone 17.0, sodium bicarbonate 8.6, urea 26.3, ammonium sulphate 3.6, mineral salt 14.5 and common salt (sodium chloride) 6.7. The first diet was a roughage mixture of maize silage and chopped sugarcane (500 : 500 g/kg DM) plus concentrate (RM-based diet) and the second was maize silage plus concentrate (MS-based diet)
Table 1. Chemical compositions of roughage and concentrate ingredients used for the initial formulation of the experimental total mixed ration (TMR)

a g/kg DM (DM, dry matter; CP, crude protein; EE, ether extract; NDF, neutral detergent fibre; ADF, acid detergent fibre; LIG, lignin; NFC, non-fibrous carbohydrates).
Table 2. Proportions of ingredients and chemical composition of the experimental total mixed ration (TMR)
a Composition of the concentrate mixture, g/kg: ground maize, 376.3; soybean meal, 193.8; wheat bran, 191; cottonseed, 162.2; limestone,17; sodium bicarbonate, 8.6; urea, 26.3; ammonium sulphate, 3.6; mineral salt, 14.5; common salt (sodium chloride), 6.7.
b Average values estimated by NRC (2001) depending on the results obtained in the laboratory.
TMR, total mixed ration; MS, maize silage and concentrate, based diet; RM, roughage mixture, sugarcane plus maize silage, 500 : 500 g/kg DM, and concentrate, based diet.
The experiment began 137 days after calving and lasted for 80 days, during which all animals were subjected to each of the four treatments. The cows were placed in freestall-type feedlots with individual stalls and were assigned to each of four treatments, each treatment lasting a period of 20 days, using a two 4 × 4 Latin square design simultaneously. Each experimental period was divided into 11 days of adaptation (wash-out period) and 9 days for data and sample collection. Treatments were arranged in a 2 × 2 × 2 factorial design with the following factors: a source of roughage, distinct environment and measurement time. Two sources of roughage in the diets (MS-based diet plus concentrate and an RM-based diet plus concentrate) fed as a total mixed ration; two environmental conditions (with evaporative cooling system, a fan and nebulizers (W) and without (Wo)); and two measurement times for physiological parameters (09.40 and 14.00 h) were evaluated.
Feed management
The experiment consisted of one daily feed, which occurred at 07.00 h and provided the total daily amount, and at 14.00 h any feed remaining was heaped in the central part of the trough to stimulate consumption.
Diet DM was adjusted weekly to ensure minimum food wastage (100 g/kg). Dry matter intake of the diet (kg/day) and milk production (kg/day) were measured daily and recorded only during the collection periods.
Sampling and processing of feed
Feed samples were collected manually, dried in a forced-air oven at 55 °C for 72 h and ground using a Wiley mill (1 mm sieve). Sub-samples were analysed for the following: DM at 105 °C (index no. 934.01), ash (index no. 942.05) and ether extract (EE) (index no. 920.39), according to AOAC methods (1990). The CP was determined according to Wiles et al. (Reference Wiles, Gray and Kissling1998). Neutral detergent fibre (without sodium sulphite and alpha amylase, expressed inclusive of the residual ash) and acid detergent fibre (ADF, expressed inclusive of the residual ash) were isolated sequentially, according to Van Soest et al. (Reference Van Soest, Robertson and Lewis1991). Lignin was extracted with 72% w/w sulphuric acid (Robertson and Van Soest, Reference Robertson, Van Soest, James and Theander1981). Non-fibre carbohydrate (NFC) was calculated as 1000 – CP – NDF – EE – ash (Sniffen et al., Reference Sniffen, O'Connor, Van Soest, Fox and Russell1992).
Management of cows, milk quality and yield
The animals were milked twice daily (06.00 and 15.00 h) in a tandem milking parlour, using individual balloon installations to measure milk production. Milk production was corrected to 3.5 g/kg milk fat (FCM = 0.432 + 0.1625 × milk fat (g/kg), Sklan et al., Reference Sklan, Ashkenazi, Braun, Devorin and Tabori1992). Within each evaluation period and for 9 consecutive days, milk samples were collected from each cow twice daily. The milk samples were placed in 60-ml plastic bottles with two bronopol tablets (2-bromo-2-nitropropane-1,3-diol) and sent to the laboratory for analysis. The concentrations of fat, CP, lactose and total milk solids (raw milk) were estimated using infrared absorption (Bentley Instruments, 1995a). The milk urea nitrogen (MUN) (mg/dl) concentration was assessed by an enzymatic assay that was monitored using spectrophotometric transreflectance (Bentley Instruments, 1998). The somatic cell count (SCC × 103 cells/ml) was determined by flow cytometry (Bentley Instruments, 1995b).
The net energy required for lactation of milk was estimated using the formula: NEL milk, (Mcal/kg) = 0.0929 × fat (g/kg) + 0.0547 × CP (g/kg) + 0.0395 × lactose (g/kg) (NRC, 2001), and transformed to MJ/kg by multiplying by the factor 4.184. The NEL milk production was estimated as follows: NEL MP (MJ/days) = NEL milk × milk production (kg/d). The free water intake (FWI) was estimated as follows: 14.3 + 1.28 × milk (kg/day) + 0.32 × DM (g/kg) diet (NRC, 2001). The N intake was estimated from diet N concentration and DMI. The positive energy balance (EBAL, MJ/day) was estimated according to Rhoads et al. (Reference Rhoads, Rhoads, Van Baale, Collier, Sanders, Weber, Crooker and Baumgard2009). To estimate the EBAL, it was assumed that the cows were already adapted to the environmental conditions of the freestall-type feedlot system. Thus, the inclusion of the evaporative cooling system (fan and nebulizers) was added to improve the thermal comfort of the cows.
Rectal temperature was measured with a digital clinical thermometer inserted into the rectum for 3 min between 08.40 to 09.40 h and 13.00 to 14.00 h daily. The RR was measured simultaneously and involved counting flank movements for a period of 15 s (expressed per min). Body surface temperature (BS) was also measured simultaneously via a digital infrared pyrometer sighting-laser (Raytek®) with an emissivity ratio of 0.4. Measurements were performed approximately 1.5 m from the cow's reading site. The RT, RR and BS were measured for 9 consecutive days during each of the four 20-day periods, within two Latin square designs. A preliminary test of BS measurements was conducted on all cows for 9 consecutive days in the morning and afternoon during the first experimental period, using black and white meshes. It was decided to continue the measurement of BS using the white meshes because the results were 5 ± 2.4 °C higher compared with the black meshes.
The following productivity parameters were evaluated: voluntary DMI in kg/day and g/kg of BW (g/kg), nitrogen (N) intake, NEL milk, NEL MP, EBAL, milk production, FCM, efficiency of milk production (milk/DMI), efficiency of milk production corrected for fat (FCM/DMI) and milk N. Physiological parameters (RR, RT and BS) and physico-chemical properties of the milk (lactose, total solids, CP, fat, MUN and SCC) were also determined.
Statistical analyses
Initially, the data were analysed for homogeneity of variance and normality of residuals to meet the assumptions for analysis of variance. When necessary, the data were transformed for each variable and the tested models are included in the table footnotes. All data were analysed with Proc Mixed in the Statistical Analysis Systems software package, version 9.1 (SAS, Reference SAS Institute2003).
The variables analysed were productivity and physiological parameters, and physico-chemical properties of the milk. The productivity parameters and physico-chemical properties of the milk were analysed in a replicated 4 × 4 Latin square, in a 2 × 2 factorial design as per Eqn (1):
 $$Y_{ijklm} = \mu + Sq_i + A_j + P_k + D_l + E_m + DE_{lm} + e_{ijklm},$$
where Y ijklm = observation, μ = constant common to each observation, Sq i = i-th effect of the square (i = 1, …, 2), A j = j-th effect of the animal within square (j = 1, … , 8), P k = k-th effect of the period (k = 1, … , 4), D l = l-th effect of diet (l = 1, … , 2), E m = m-th effect of environment (m = 1, … , 2), DE lm = lm-th effect of interaction diet × environment (lm = 1,…, 2), and e ijklm = residual error, assumed independent and identically distributed in a normal distribution with a mean of zero and residual variance δ 2 constant and common to all observations. Significant differences were accepted when P ⩽ 0.05. For significant interactions, orthogonal contrasts were performed to compare the effects of diets and environmental conditions. The subsequent models differ only by the inclusion of the new factors. For physiological parameters, measurement time was included in a 2 × 2 × 2 factorial design. The environmental parameters were analysed using repeated measures and the same collection period in a 2 × 2 factorial design (measurement time and environmental condition).
Results
The majority of the variables were transformed for statistical analysis, as described in table footnotes.
Feed composition
Tables 1 and 2 show the composition of the diets and their individual ingredients. The roughage to concentrate ratios (R : C) was 559 : 441 g/kg and 485 : 515 g/kg for the MS- and RM-based diets, respectively. The initial estimated DMI was 18.7 kg/day for the MS-based diet and 19.3 kg/day for RM-based diet (NRC 2001) (Table 2). The MS- and RM-based diets had 506 g/kg DM and 525 g/kg DM, respectively. Both diets had similar CP, total digestible nutrients (TDN), NEL diets, EE, ADF and ash contents; NDF, NFC and sugars differed by 5.0, 4.2 and 8.4%, respectively (Table 2).
Environmental parameters
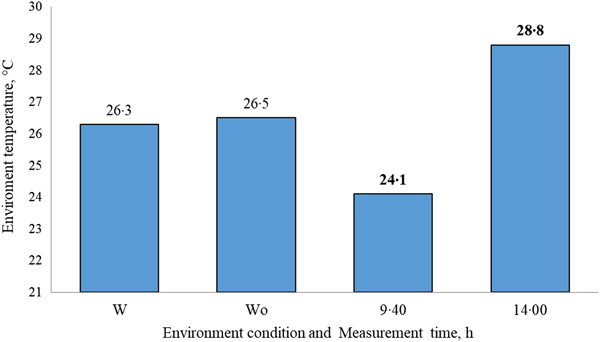
There was a significant interaction (P < 0.05) of the environmental condition (W and Wo) with the measurement time (09.40 and 14.00 h) for almost all environmental variables (Table 3). The exception was environment temperature (ET), which was only affected by the main factors, measurement time and environmental condition (Fig. 1). All analysed environmental variables were used to estimate THI. The purpose of assessing each variable was to determine which components could be adjusted to improve the environmental condition of the facility for the cows. Evaluation of the two measurement times within each environmental condition (W and Wo) revealed that THI was higher at 14.00 than at 09.40 h, under both environmental conditions (76.6 v. 71.9 with W and 75.9 v. 72.3 with Wo, P < 0.05, respectively). Furthermore, at 14.00 h, THI was higher under W than Wo condition (76.6 v. 75.9, P < 0.05, respectively). The ET at 14.00 h was higher than at 09.40 h (28.8 v. 24.1 °C, P < 0.05, Table 3).

Fig. 1. Average values of temperature obtained as a function in the principal factors effects (environment condition and measurement time). s.e., standard errors; P-value, probability. P < 0.001 for measurement time, P = 0.315 for environment condition and P = 0.928 for measurement time × environment conditions interaction. s.e. = 0.13.
Table 3. Average values of environmental parameters obtained in the morning (09.40 h) and afternoon (14.00 h) of the period during the measurement phases

a, b: Values followed by letters columns, lowercase in the same variable were significantly different (P < 0.05).
A, B: Values followed by letters in the rows, uppercase in the same variable were significantly different (P < 0.05).
a Mean values are original, but data transformed for the purpose of statistical analysis (Y variable): DPT and H = Y 2. N = 288, total number of observations statistically analysed by each variable. Int, statistical interaction (Time × Env); s.e., standard errors; P-value, probability. Factor: Env, environment (W, with fan and nebulizers, Wo, without fan and nebulizers). RH, relative humidity of the air; DPT, dew point temperature, H, enthalpy, energy in the environment; THI, temperature and humidity index.
The RH was always lower at 14.00 h than at 09.40 h, within both environmental conditions (W and Wo) (53.1 v. 67.9% and 45.2 v. 70.3%, P < 0.05). Furthermore, RH was higher at 14.00 h under W conditions (53.1 v. 45.2%, P < 0.05) due to the water spray (nebulizers). The DPT was higher at 09.40 h with both environmental conditions (W and Wo). At 09.40 h, the DPT was higher under Wo conditions than W (19.5 v. 18.8 °C, P < 0.05), whereas at 14.00 h the inverse occurred. At 14.00 h, DPT was higher with W conditions than Wo (19.0 v. 16.7 °C, P < 0.05).
Enthalpy was higher at 14.00 h than at 09.40 h under W conditions (78.5 v. 73.4 kJ/kg dry air, P < 0.05, Table 3). The effect of interaction between environmental condition and measurement time resulted in a H value that was higher with Wo than W conditions (75.1 v. 73.4 kJ/kg dry air, P < 0.05) at 09.40 h. However, at 14.00 h, H was higher with W than Wo conditions (78.5 v. 74.5 kJ/kg dry air, P < 0.05), which may reflect a higher RH at ET when the nebulizers were operating.
Intake, excretion and animal performance
No interaction effect of diet (RM-based and MS-based) with environmental condition (W and Wo) was evident. However, significant main effects were isolated (diet or environmental condition) for several variables (Table 4). Dry matter content was higher in the RM- than the MS-based diet (525 v. 506 g/kg, respectively, P < 0.05). Dry matter intake and FWI were similar with both diets, but DMI was higher under in W conditions than Wo (20.7 v. 19.8 kg/day, respectively, P < 0.05). The NDF consumption of cows, estimated on the basis of DMI of the TMR diet, remained at 7.3 and 7.8 kg NDF/day for the RM- and MS-based diets, respectively. However, the MS-based diet led to higher milk production due to NEL milk, NELMP, milk/DMI and feed N efficiency use. Consequently, milk production efficiency (milk/DMI), milk N and feed N efficiency use increased due to lower SCC compared with the RM-based diet. The inverse trends occurred with the RM-based diet. The higher DM content of the RM-based diet resulted in higher MUN (15%) compared with the MS-based diet.
Table 4. Means of productive parameters, the efficiency of utilization, milk composition and water intake under the effects of roughages based on total mixed ration (TMR) and environment conditions

a Mean values are original, but data transformed for the purpose of statistical analysis (Y variable): DMI, Milk, FCM and NEL MP = Y 2; milk N = Y 1.5; Milk/DMI and SCC = log 10 (Y). N = 288, total number of observations statistically analysed by each variable.
Factor: Roug, roughage, base of TMR; RM, roughage mixture, sugarcane plus maize silage, 500 : 500 g/kg DM, and concentrate, based diet; MS, maize silage and concentrate, based diet. DMD, dry matter diet; DMI, dry matter intake; Milk/DMI, efficiency of milk production; FCM (kg/day), fat-corrected milk for 3.5 g/kg = (0.432 + 0.1625 × milk fat (g/kg), Sklan et al., Reference Sklan, Ashkenazi, Braun, Devorin and Tabori1992); CP, crude protein; SCC, somatic cells count. Factor: Env, environment (W, with fan and nebulizers; Wo, without fan and nebulizers); NEL, net energy required for lactation: MP, milk production daily (Mcal/day) = 0.0929 × fat (g/kg) + 0.0547 × crude protein (g/kg) + 0.0395 × lactose (g/kg) × milk production, NRC (2001). The following transformation factor was considered to NEL MP (MJ/day) =Mcal/day × 4.184. FWI (kg/day) = free water intake = (14.3 + 1.28 × milk, kg/day + 0.32 × DM g/kg of diet; NRC 2001, p. 179) Int., statistical interaction (Roug × Env); s.e., standard errors; P-value, probability.
The effect of environmental condition (W and Wo) revealed higher intakes of DM and correspondingly lower milk/DMI, N intake and MUN under W conditions (P < 0.05) (Table 4). The inverse trends occurred under Wo conditions with the same variables. Under W and Wo conditions, regardless of base diet, intake by cows was 7.7 and 7.4 kg NDF/day, respectively. However, there was no effect of environmental condition on the following milk parameters: milk production, FCM, milk N, NEL MP and SCC, or on the FWI of the cows.
There was an interaction effect of diet (RM × MS) and environmental condition (W × Wo) for the variables FCM/DMI, DMI (g/kg BW), NEL milk and feed N efficiency use (Table 5). However, FCM/DMI was higher in cows fed the MS-based diet under Wo conditions than the RM-based diet (1.19 v. 1.11, P < 0.05) and was similar under W conditions. With the MS-based diet, the FCM/DMI was higher in Wo than W conditions (1.19 v. 1.08, P < 0.05). The DMI (g/kg BW) was higher in animals fed the MS-based diet in W than Wo conditions (4.00 v. 3.74, P < 0.05). With the RM-based diet, the NEL milk was similar under both environmental conditions, but under W conditions, the NEL milk was higher with the RM- than MS-based diet (3.02 v. 2.97 MJ/kg, P < 0.05). However, with the MS-based diet, the NEL milk was higher in Wo than W conditions (3.04 v. 2.97 MJ/kg, P < 0.05). With the RM-based diet, feed N efficiency use was higher in W conditions than Wo (0.188 v. 0.203, P < 0.05). While with the MS-based diet, values were similar in both environment conditions (0.189 v. 0.188 with W and Wo, respectively). In W condition, RM- and MS-based diet produced similar effects the feed N efficiency use (0.188 v. 0.189).
Table 5. Means of efficiency production, intake dry matter in g/kg of body weight, energy of milk and feed N efficiency use the interaction among roughages based on total mixed ration (TMR) and environment conditions
a, b: Values followed by letters columns, lowercase in the same variable were significantly different (P < 0.05).
A, B: Values followed by letters in the rows, uppercase in the same variable were significantly different (P < 0.05).
a Mean values original, but data transformed for the purpose of statistical analysis (Y variable): NEL milk = log 10 (Y); Feed N efficiency = 1/Y. N = 288, total number of observations statistically analysed by each variable. Int.,statistical interaction (Roug × Env); s.e., standard errors; P-value, probability.
Factors: Roug, roughage, base of TMR; RM, roughage mixture, sugarcane plus maize silage, 500 : 500 g/kg DM, and concentrate, based diet; MS, maize silage and concentrate, based diet. Factor: Env, environment (W, with fan and nebulizers; Wo, without fan and nebulizers). NEL- net energy required for lactation: NEL milk (Mcal/kg) = 0.0929 × fat (g/kg) + 0.0547 × crude protein (g/kg) + 0.0395 × lactose (g/kg), NRC (2001), and transformed to MJ/kg by multiplying the factor 4.184. FCM, fat milk correct for 3.5 g/kg; DMI, dry matter intake; FCM/DMI, efficiency of milk production corrected to fat; Feed N efficiency = efficiency of feed nitrogen utilization = milk nitrogen output/intake feed nitrogen.
Milk composition
Roughage source (e.g. feed-based diet) × environmental condition revealed an interaction effect with respect to the total solids, lactose, CP and fat content in the milk in g/kg (P < 0.05) (Table 6). The RM-based diet was superior to the MS-based diet for milk total solids under W conditions (126.8 v. 124.8 g/kg, respectively, P < 0.05), while with the MS-based diet, milk total solids were higher under Wo than W conditions (127.4 v. 124.8 g/kg, P < 0.05). The lactose in milk was higher with the MS- than the RM-based diet (P < 0.05), under both environmental conditions (W and Wo). However, the environmental conditions with the diets (RM- and MS-based diet) to lactose did not have significant difference (45.0 v. 45.2 g/kg, RM- and 46.0 v. 45.7 g/kg, MS-, P > 0.05). The CP in milk was higher for the MS- than the RM-based diet, but only under W conditions (32.5 v. 32.8 g/kg, P < 0.05). Within of effect the RM-based diet, under Wo conditions, there was a higher CP content in milk (32.3 v. 32.8 g/kg, P < 0.05). Under W conditions, the RM-based diet yielded milk with a higher fat content than the MS-based diet (39.4 v. 37.6 g/kg, P < 0.05). With the MS-based diet, there was a higher fat content in milk under W conditions than under Wo (37.6 v. 39.6 g/kg, respectively, P < 0.05). However, when the milk fat production (kg/day) under Wo conditions was evaluated, it was found that the RM-based diet yielded milk with a higher fat content than the MS-based diet (0.83 v. 0.80 kg/day, respectively, P < 0.05), while milk fat production values were similar for the two environmental conditions.
Table 6. Means of milk composition and the interaction among roughages based of total mixed ration (TMR) and environment conditions

a, b: Values followed by letters columns, lowercase in the same variable were significantly different (P < 0.05).
A, B: Values followed by letters in the rows, uppercase in the same variable were significantly different (P < 0.05).
a Mean values original, but data transformed for the purpose of statistical analysis (Y variable): lactose = Y 2; crude protein and fat, g/kg = 1/Y; fat, kg/day = Y 2. N = 288, total number of observations statistically analysed by each variable. Int., statistical interaction of factors; s.e., standard errors; P-value, probability.
Factor: Roug, roughage, base of TMR; RM, roughage mixture, sugarcane plus maize silage, 500 : 500 g/kg DM, and concentrate, based diet; MS, maize silage and concentrate, based diet. Factor: Env, environment (W, with fan and nebulizers; Wo, without fan and nebulizers).
There was no effect of interaction between the roughage source and the environmental conditions with respect to total solids, lactose and CP content of the milk in kg/day (Table 7). The RM-based diet was superior to the MS-based diet for total solids, lactose and CP of milk (2.68 v. 2.61, 0.98 v. 0.94 and 0.69 v. 0.67 kg/day, respectively, P < 0.05). However, the environmental conditions (W and Wo) the total solids, lactose and CP were similar.
Table 7. Means of milk composition (kg/day) under the effects of roughages based of total mixed ration (TMR) and environment conditions

a Mean values original, but data transformed for the purpose of statistical analysis (Y variable): CP = Y 1.5; Total solids = Y 2. N = 288, total number of observations statistically analysed by each variable.
Factor: Roug, roughage, base of TMR; RM, roughage mixture, sugarcane plus maize silage, 500 : 500 g/kg DM, and concentrate, based diet; MS, maize silage and concentrate, based diet. CP, crude protein. Factor: Env, environment (W, with fan and nebulizers; Wo, without fan and nebulizers); s.e., standard errors; P-value, probability.
Physiological parameters
There was a roughage × environment interaction effect, but only for the BS variable (Fig. 2). For other factors and variables, statistical significance was only observed in the main factors (roughage, environment and time) (Table 8).
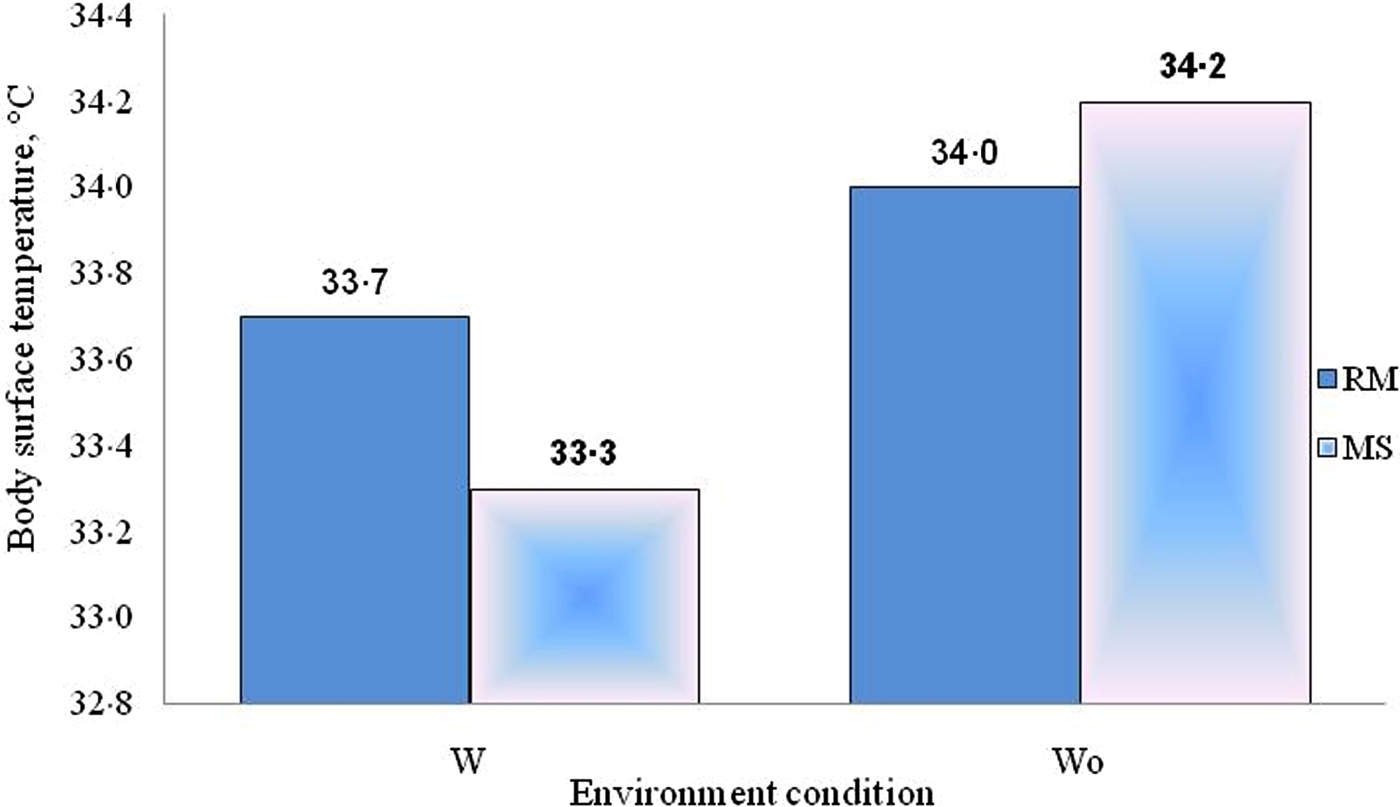
Fig. 2. Mean of body surface temperature of cows submitted to effects of roughage base of total mixed ration and environment conditions. RM, roughage mixture, sugarcane plus maize silage, 500 : 500 g/kg DM, and concentrate, based diet; MS, maize silage and concentrate, based diet. W, with fan and nebulizers; Wo, without fan and nebulizers. Mean values original, but data transformed for the purpose of statistical analysis (Y variable): BS, body surface temperature = Y 2. s.e., standard errors; P-value, probability. P = 0.297 for roughage-based diet, P < 0.001 for environment conditions and P = 0.016 for roughage × environment conditions interaction. s.e. = 0.13.
Table 8. Mean of physiology parameters of cows submitted to effects of roughage base of total mixed ration (TMR), measurements time (09.40 and 14.00 h) and environment conditions

a Mean values are original, but data transformed for the purpose of statistical analysis (Y variable): BS = body surface temperature = Y 2.
RT, rectal temperature and RR, respiratory rate, breaths/minutes. Int, statistical interaction of factors; s.e., standard errors; P-value, probability. N = 576, total number of observations statistically analysed by each variable.
Factor: Roug, roughage, base of TMR, RM, roughage mixture, sugarcane plus maize silage, 500 : 500 g/kg DM, and concentrate, based diet; MS, maize silage and concentrate, based diet. Factor: Env, Environment (W, with fan and nebulizers; Wo, without fan and nebulizers).
Under both environmental conditions, the cows generated similar BS with the MS- compared with the RM-based diet (33.3 v. 33.7 °C with W and 34.2 v. 34.0 °C with Wo, respectively, P < 0.05). With the MS-based diet, Wo had the greatest effect on BS compared with W condition (34.2 v. 33.3 °C, P < 0.05) (Fig. 2). Thus, RR, within the environment factor, was higher under Wo than W conditions (49.7 v. 47.1 breaths/min, P < 0.05, Table 8). The RT was more significant for the roughage effect in the RM-based diet (38.5 v. 38.4 °C, P < 0.05) than MS-based diet, while RT values with the two different environments were similar
Regarding the relationship between roughage factor and measurement time, only RT was higher with the RM-based diet than MS-based diet (38.5 v. 38.4 °C, respectively, P < 0.05) in roughage factor. With regard to measurement time alone, all physiological responses (RR, BS and RT) were higher at 14.00 h (58.2 breaths/min, 34.9 and 38.6 °C, respectively) compared with 09.40 h (38.6 breaths/min, 32.7 and 38.3 °C, respectively, P < 0.05). This may have been a result of the metabolic heat that originated from the process of digestion and absorption of food and physiological alterations caused by increased THI.
There were significant differences among all variables according to the measurement time and environmental conditions, except for RT for the environmental factor. The measurement time at 14.00 h generated a higher RR, BS and RT than at 09.40 h. (Table 8). Only RR and BS showed a significant difference in relation to the environmental condition (W and Wo); Wo conditions generated a higher RR and BS than W conditions (49.7 v. 47.1 breaths/min and 34.1 v. 33.5 °C, P < 0.05, respectively).
Discussion
Environmental parameters
The ET of the freestall-type feedlot system was always higher at 14.00 h than at 09.40 h, a difference of +4.7 °C or a 16% increase. The RH was always less at 14.00 h than at 09.40 h, with both environmental conditions (W and Wo), representing significant differences of 22 and 36%, respectively.
The variations in environmental variables, such as RH, ET, DPT and H with W and Wo conditions and measurement times affected THI estimates directly, as they were uncontrolled factors. The ET and RH had the most influence on THI due to the scale of their variation between morning and afternoon. The THI was higher at 14.00 h compared with 09.40 h, for both W and Wo conditions, representing an increase of +6.0 and +5.0%, respectively. The environmental conditions approached the heat stress threshold in the morning (71.9 and 72.3 THI). In the afternoon period (14.00 h, 28.8 °C, ET), the THI value exceeded the heat stress threshold point, moving to the mild-moderate heat stress category (76.5 and 75.8 THI), in agreement with Renaudeau et al. (Reference Renaudeau, Collin, Yahav, de Basilio, Gourdine and Collier2012). Armstrong (Reference Armstrong1994) reported that cows with high milk production experience heat stress with a THI of 72. However, Zimbelman and Collier (Reference Zimbelman and Collier2011) reported that a THI close to 68 initiated a decrease in milk production.
Hence, the environmental conditions of the freestall-type feedlot system were sufficient to induce high-intensity physiological responses of the mild-moderate stage of heat stress in cows during the afternoon period. A similar observation was reported by Titto et al. (Reference Titto, Negrão, Canaes, Titto, Leme-dos-Santos, Henrique, Calviello, Pereira and Titto2017) in lactating cows at thermal comfort in a freestall-type feedlot system with fans and nebulizers. When the ET exceeds the maximum comfort for the animal, the RH assumes critical importance in the elimination of heat (Sota, Reference Sota1996). This was observed in the current results for ET and RH at 14.00 h, where RH was higher under W conditions. However, under conditions of high humidity, saturated air inhibits the evaporation of water from the skin and the respiratory system, providing a more stressful environment for the animal (Sota, Reference Sota1996; Chaiyabutr et al., Reference Chaiyabutr, Chanpongsang and Suadsong2008). Thus, the combination of high RH and high temperature at 14.00 h raised the THI to 76.6 under W conditions, exceeding that under Wo conditions (75.9), probably explaining the higher RR and BS at 14.00 h observed in the relationship of measurement time with environment factors. However, in relation to the effect of the environmental factor, W conditions provided an improvement in the RR and BS, representing an improvement in the thermal conditions of the environment. This fact is consistent with a report by Chaiyabutr et al. (Reference Chaiyabutr, Chanpongsang and Suadsong2008) in that an evaporative cooling system is effective in cooling the animals, but under conditions of high RH, the air compromises the evaporation of water, resulting in high THI and thus interfering with the thermal comfort of the animal. This finding was also reported by Avendaño-Reyes (Reference Avendaño-Reyes and Chaiyabutr2012), who mentioned that moisture accumulates in a freestall-type feedlot area due to the cooling system and the faeces and urine of the animals on the floor; this is a disadvantage of the system since the cows remain in that same condition for hours.
Intake, excretion and animal performance
There was no interaction effect between the factors roughage source and environmental condition for the productive parameters, the efficiency of utilization and milk composition. Thus, response variables only within the main factors are discussed.
The lower NDF intake with the RM-based diet was probably due to the lower roughage to concentrate ratio (R : C of 485 : 515 g/kg) required for CP and dietary energy adjustments (179 v. 174 g/kg, CP and 6.9 v. 7.1 MJ/kg DM, for RM- and MS-based diets, respectively). Another probable cause is the dietary fibre quality; the MS-based diet was probably more digestible, as reflected in higher milk production (milk and FCM), milk N, NEL MP, milk/DMI, feed N efficiency and MUN compared with the RM-based diet. Although the RM-based diet had a lower NDF content, it probably had less digestible fibre, as confirmed by Campos et al. (Reference Campos, Sampaio, Vieira and Bose2001). These authors evaluated the quality of sugarcane, which had contents of 331 g/kg DM, 479 g/kg NDF, 290 g/kg ADF and 469 g/kg NFC, in relation to the same maize silage component (296, 513, 291 and 323 g/kg, respectively) and obtained lower in vitro digestibility of DM and NDF of sugarcane than maize silage (606 and 318 g/kg v. 663 and 391 g/kg, respectively). Interestingly, Pires et al. (Reference Pires, Susin, Simas, Oliveira Júnior, Fernandes, Araújo and Mendes2010) reported comparable DMI, FCM production and contents of CP and fat in the milk of cows receiving diets similar to those in the present study.
With respect to the environmental conditions, W conditions had higher DMI and feed N efficiency use, and lower milk/DMI, N intake and MUN compared with Wo conditions. This indicates that the environmental conditions and physiological factors (e.g. endocrine profile) also interfered with dietary metabolism. This finding agrees with results of Rhoads et al. (Reference Rhoads, Rhoads, Van Baale, Collier, Sanders, Weber, Crooker and Baumgard2009), Bernabucci et al. (Reference Bernabucci, Lacetera, Baumgard, Rhoads, Ronchi and Nardone2010), Baumgard and Rhoads et al. (Reference Baumgard and Rhoads2012) and Zhang et al. (Reference Zhang, Ying, An, Lian, Zhou and Han2014), who evaluated the effect of the environment on the physiological responses of lactating cows. The effect of the interaction between roughage and environmental conditions showed the effect on physiological responses of lactating cows via results from FCM/DMI, DMI g/kg BW and NEL milk. Within the MS-based diet, Wo conditions led to greater efficiency of milk production corrected for fat (FCM/DMI) due to the lower DMI in g/kg BW and higher NEL milk. However, the MS-based diet under Wo conditions presented lower EBAL compared with W condition (67.2 v. 76.4 MJ/day, respectively), probably due to the higher energy expenditure required to recover from the Wo environmental conditions. The inverse occurred for W conditions, e.g. higher EBAL for W condition than Wo (76.4 v. 67.2 MJ/day).
Milk production and FCM were higher with MS- than the RM-based diet. This is in contrast to the results of Pires et al. (Reference Pires, Susin, Simas, Oliveira Júnior, Fernandes, Araújo and Mendes2010), who obtained higher FCM production with a sugarcane : maize silage (500 : 500 g/kg DM) diet compared with 100% maize silage-based diet. It is likely that the thermal sensation caused by W conditions negatively affected the performance of the cows, because the environmental THI was in the range considered to impose mild-moderate heat stress (72–79 THI), as reported by Renaudeau et al. (Reference Renaudeau, Collin, Yahav, de Basilio, Gourdine and Collier2012) and according to Armstrong (Reference Armstrong1994), and above the comfort temperature of 27 °C (Igono et al., Reference Igono, Bjotvedt and Sanford-Crane1992). There was probably an energy cost (e.g. 25–30% of body energy) associated with heat stress dissipation, as mentioned by Wheelock et al. (Reference Wheelock, Rhoads, Van Baale, Sanders and Baumgard2010), thus reducing feed efficiency.
Under Wo conditions, the RM- and MS-based diets produced similar results for the variables FCM/DMI, DMI (g/kg BW), NEL milk and EBAL. It is likely that the RM-based diet, under Wo conditions, did not need the cooling system due to the greater use of concentrates in the diet and a greater roughage to concentrate ratio (485 : 515 g/kg), which represents 30% less roughage in the diet. The concentrate promotes a fibre dilution effect in the diet and the associative effect of NFC sources (sucrose and starch of RM), which provide greater energy in the digestive process.
The feed efficiency results (milk/DMI and FCM/DMI) were related directly to the effect of roughage in the diet and the environmental conditions. The milk/DMI was higher with the MS- than RM-based diet, but the milk/DMI and FCM/DMI were 2.8 and 9.2% higher, respectively, in Wo conditions than W. An alternative interpretation is that the responses are a reflection of the short treatment periods used (<3 weeks). For example, the lack of a nebulizer decreased DMI but not milk yield, so efficiency appears to have improved. However, an alternative interpretation is that, in the short term, in the stressful environment condition, the cows were able to maintain their low milk yields in spite of the decrease in DMI through repartitioning of metabolizable energy away from body tissue deposition.
Similarly, differences in milk composition due to the diet could be the result of diluting effects of milk yield changes. In this respect, the yields of the milk components were also analysed. Only the fat in the milk (kg/day) presented an effect of the interaction between roughage and environmental conditions, while the other variables showed only an effect of roughage. There was probably a dilution effect because the RM-based diet led to lower production of milk and FCM, kg/day and higher concentrations of total solids, lactose and CP (kg/day). These results are likely to be related to changes in the ET, RH, DPT and H variables that interfere directly with the THI. Thus, the increase in RH caused by the cooling system, e.g. the nebulizers, increased the THI when combined with the high air temperature. Consequently, under W conditions, there was a change in the thermal sensation of the cows and they suffered from thermal discomfort, especially during the hottest periods of the day. This was confirmed by the decreased feed efficiency under W conditions. Thus, Wo conditions provided a more conducive environment for the animals to demonstrate either their biological efficiency or their adaptive mechanisms in response to environmental stressors. The biological efficiency was probably due to less energy expenditure in dissipating heat from dietary metabolism and to increased FWI to maintain animal homeothermy. According to Bernabucci et al. (Reference Bernabucci, Lacetera, Baumgard, Rhoads, Ronchi and Nardone2010), the main immediate physiological responses of internal and environmental heat reduction, when it exceeds the capacity of heat dissipation, is to increase the RR, decrease DMI and increase water intake. Heat production and its dissipation into the environment is an interactive process, which depends directly on animal physiology and the hydrometric conditions of the air.
Milk composition
The total solids content of milk was higher with RM compared with the MS-based diet under W conditions, while with the MS-based diet, the milk total solids content was higher under Wo than W. However, under Wo conditions, of the milk total solids, CP and fat content in the milk were similar for the RM- and MS-based diets. The higher fat content of milk from cows receiving the RM-based diet compared with the MS- corresponded to higher total solids in the milk. This could be related to the dietary quality of the RM-fibre, which probably provided a higher concentration of acetic acid in the rumen fermentation processes. Similarly, Pires et al. (Reference Pires, Susin, Simas, Oliveira Júnior, Fernandes, Araújo and Mendes2010) found a higher fat content in the milk from of dairy cows receiving a diet based on sugarcane : maize silage (500 : 500 g/kg DM) plus concentrate.
The lower lactose content of milk (e.g. 45.2 g/kg) produced by cows receiving the RM- compared with MS-based diet was most likely related to the higher SCC (622 × 103 v. 446 × 103 cells/ml, respectively) representing a 28.3% increase. Henao-Velásquez et al. (Reference Henao-Velásquez, Múnera-Bedoya, Herrera, Agudelo-Trujillo and Cerón-Muñoz2014) obtained a reduction in the lactose concentration in milk with an increase in SCC. The health condition of the mammary gland and, therefore, the SCC, is a determinant of milk composition, such that any inflammatory condition can lead to decreasing contents of lactose and fat, and affect milk production negatively (Coldebella et al., Reference Coldebella, Machado, Demétrio, RibeiroJúnior, Meyer, Corassin and Cassoli2004; Summer et al., Reference Summer, Malacarne, Sandri, Formaggioni, Mariani and Franceschi2012). Indeed, there was lower milk production, milk/DMI, NEL MP, EBAL, N milk and feed N efficiency use but higher N intake, MUN and SCC in cows receiving the RM- compared with the MS-based diet. Evaluation of the SCC data when grouped into bands showed relative frequencies of 58.3, 12.2 and 29.5% for the ranges 14–297, 317–500 and >500 × 103 cells/ml of milk, respectively; these values were based on a total of 288 observations. Probably, the higher SCC values led to an increase in the means value of the treatments. High SCC values may be related to sub-clinical or environmental mastitis because they were confined to the freestall arrangement. According to Hiitiö et al. (Reference Hiitiö, Vakkamäki, Simojoki, Autio, Junnila, Pelkonen and Pyörälä2017) there is an increase in the prevalence of sub-clinical mastitis in a free-stall system with an automatic milking machine. A study carried out in the region of Araras, Sao Paulo, Brazil, by França et al. (Reference França MM, Campana, Veronesse, Nascimento and Morais2017) reported mean SCC increases from 179 to 1390 × 103 cells/ml of milk according to five pathogens prevalence causing mastitis. In a study conducted in Pirassununga, Sao Paulo, Brazil, Botaro et al. (Reference Botaro, Cortinhas, Dibbern, Prada e Silva, Benites and dos Santos2015) evaluated cows with or without intra-mammary infection by Staphylococcus aureus and found an increase in SCC from 138 to 933 × 103 cells/ml of milk.
Until 2008, the SCC established in Brazil by the Ministry of Agriculture, Livestock and Supply (MAPA) was up to 750 × 103 cells/ml of milk. In 2011, new targets were established of 400 × 103 cells/ml of milk and in 2016 the targets were set at 100 × 103 cells/ml of milk, according to the changes in normative instructions number 51, 62 and 07 of MAPA. However, the average SCC value in Brazil is 593 × 103 cells/ml of milk (Pithan-Silva, Reference Pithan-Silva2017), which differs from many developed countries.
Thus, animals with a high genetic potential for milk production are most affected by heat stress because they depend on a higher DMI, which results in excessive production of metabolic heat (Kadzere et al., Reference Kadzere, Murphy, Silanikove and Maltz2002). Heat stress causes a decrease in the total volume of milk, total solids, CP and milk fat (Kadzere et al., Reference Kadzere, Murphy, Silanikove and Maltz2002). Thermal discomfort was likely to be responsible for the significantly lower CP (RM-based diet) in milk from cows under W conditions in comparison with Wo. This was reflected in the lower milk/DMI and feed N efficiency use and higher MUN. These results support the reports of Sota (Reference Sota1996) and Chaiyabutr et al. (Reference Chaiyabutr, Chanpongsang and Suadsong2008), who mentioned that, under conditions of high humidity and air temperature, air saturation inhibits skin water evaporation, causing discomfort and interfering with the physiological metabolism of the animal. This may increase the calorific cost of maintenance to dissipate heat stress, according to Wheelock et al. (Reference Wheelock, Rhoads, Van Baale, Sanders and Baumgard2010).
The milk obtained from cows receiving the MS-based diet had a similar CP content under W and Wo conditions. However, under W conditions, the MS-based diet led to higher CP content in milk from cows that received the RM-based diet, but under Wo conditions, the CP content of milk was similar with the RM- and MS-based diets. In turn, the production of total solids, lactose and CP (in kg/day) with the RM-based diet showed a concentration effect due to lower daily milk production. Alternatively, the CP content increased in milk and was consistent with the higher SCC with the RM-based diet, which was reflected in the increased N concentration of the milk (MUN). Henao-Velásquez et al. (Reference Henao-Velásquez, Múnera-Bedoya, Herrera, Agudelo-Trujillo and Cerón-Muñoz2014) reported that lactose and MUN concentrations are affected by several factors during lactation, especially on lactation days.
The milk fat content (g/kg) was higher for cows receiving the RM- rather than the MS-based diet under W conditions, but the contents were similar with both diets under Wo conditions. The different fat content of the milk between the diets may be related to the mitigation of heat stress caused by the physiological process of fibre digestion under W conditions. However, when evaluating the production of fat in milk (kg/day) under Wo conditions, the RM-based diet provided higher fat production than the MS-based diet. Fermentation of the fibrous portion of sugarcane in the rumen, particularly for the RM-based diet, may have produced a high proportion of acetic acid because it is a low-quality fibre and provides greater internal heat in digestion and absorption metabolism, as reported by West (Reference West1999). For example, Campos et al. (Reference Campos, Sampaio, Vieira, Bose and Sarmento2002) found a higher proportion of acetic acid during in vitro digestion of mixed sugarcane : maize silage (500 : 500 g/kg DM) compared with these roughages alone.
The MUN content has been used to indicate the nutritional status of ruminants, mainly reflecting the CP of the diet (Broderick and Clayton, Reference Broderick and Clayton1997; Chizzotti et al., Reference Chizzotti, Valadares Filho, Valadares, Chizzotti, Marcondes and Fonseca2007), among other factors. Accordingly, the increase in MUN content in the current study indicated that the animals had less efficient N utilization, particularly when fed the RM-compared with the MS-based diet. This was probably due to a large amount of concentrate in the RM-based diet, which was required to correct the protein-energy imbalance caused by the inclusion of sugarcane and to satisfy the nutritional requirements of milk production. More concentrate should have decreased MUN through decreased ammonia absorption, according to the forage type, consequently lower N-urea losses in milk. However, this did not occur. Perhaps the higher diet CP concentration with the sugarcane diet contributed to the increased MUN concentration. A similar finding was reported by Gomes et al. (Reference Gomes, de Oliveira, Pereira, Vieira, Henrique, Fernandes and Leonel2016), who observed a higher concentration of MUN in dairy cows with diets based on sugarcane compared with diets based on maize silage at the same level of milk production. Gomes et al. (Reference Gomes, de Oliveira, Pereira, Vieira, Henrique, Fernandes and Leonel2016) also found better use of N with diets based on maize silage, with a R : C ratio of 780 : 220 g/kg, due to lower N-urea losses in plasma, urine and milk compared with a sugarcane-based diet (R : C ratio of 600 : 400 g/kg) or with a diet based on elephant-grass silage (R : C ratio of 760 : 240 g/kg). Santiago et al. (Reference Santiago, Campos, Oliveira, Valadares Filho, Santos, Souza and Santiago2013), using urea and ammonium sulphate levels (9 : 1 w/w) in the diet of dairy cows based on sugarcane as roughage, found that up to 12 g/kg of natural sugarcane could be supplied without affecting performance, but with less efficiency in the use of nitrogen ingested.
The effect of environmental conditions on the concentration of MUN is indicative of its association with the metabolic and physiologic processes of the animals. This was reflected in the improved feed N utilization associated with the MS-based diet and W conditions, with lower concentrations of MUN. In contrast, Wo conditions and an RM-based diet led to lower feed N utilization and higher MUN. This is in agreement with Broderick et al. (Reference Broderick, Stevenson and Patton2009), who also obtained increased MUN and urinary N excretion and low efficiency of N utilization in diets, with a high protein content of the milk.
Physiological parameters
In terms of the relationship between environmental factors and sources of roughage in the diet, there was an increase in BS associated with the MS-based diet and Wo conditions, probably due to increased heat output during digestion and absorption metabolism and environmental heat transfer. With the use of the cooling system (W), there was a decrease in the BS of cows with the MS-based diet. Under W and Wo conditions, the BS was similar between the diets. The increased BS of cows that occurred at 14:00 h was a physiological response to the cows’ thermoregulatory mechanism. According to Bernabucci et al. (Reference Bernabucci, Lacetera, Baumgard, Rhoads, Ronchi and Nardone2010), an increase in BS occurs when the metabolic and environmental heat transfer exceeds the heat dissipation capacity. However, evaluation of the factors roughage and measurement time revealed that the highest RT, RR and BS occurred at 14.00 h, and the RM-based diet provided higher RT than the MS-based diet. This probably reflects the physiology of digestion and absorption metabolism, and the higher THI at 14.00 h possibly exacerbated the increase in body heat, in agreement with findings of West (Reference West1999). This reinforces and confirms the results of RR and BS under Wo conditions, observed mainly in measurement time and environmental condition.
The interaction of roughage type with the environment in the RM-based diet did not affect the BS of cows, regardless of the environmental condition (W or Wo), since the cows’ capacity for heat dissipation was not exceeded (Bernabucci et al., Reference Bernabucci, Lacetera, Baumgard, Rhoads, Ronchi and Nardone2010). However, due to the isolated effect of the roughage factor for RM-based diet, there was an increase in RT, which indicates there was an intense ruminal fermentation process. This probably occurred due to the higher proportion of NFC and sugar in RM- compared with MS-based diet (358 v. 343 g/kg and 154 v. 141 g/kg, respectively), representing 4.4 and 8.4% of DM, and also the dietary fibre source. However, RT did not reach the critical limit (>38.5 °C) proposed by Renaudeau et al. (Reference Renaudeau, Collin, Yahav, de Basilio, Gourdine and Collier2012).
According to Baumgard and Rhoads (Reference Baumgard and Rhoads2012), cow suckling under heat stress initiates a variety of post-absorptive metabolic changes that are largely independent of reduced food intake and EBAL. Apparently, these changes in nutrient distribution are adaptive mechanisms employed to prioritize the maintenance of euthermia. According to Bernabucci et al. (Reference Bernabucci, Lacetera, Baumgard, Rhoads, Ronchi and Nardone2010), acclimatization is an adaptive process in animals to new environmental conditions, linked to behavioural, metabolic and hormonal changes which are characteristic of homeostasis or homeorhetic mechanisms used to survive new physiological conditions.
The THI at 09.40 h was in the range 71.9–72.3 for the cows under both W and Wo conditions (i.e. between the heat stress threshold and mild-moderate stress). In the afternoon (14.00 h), the environmental conditions changed and THI was 75.8 to 76.5 under Wo and W conditions, respectively; this was associated with the higher value of RR, BS and RT (58.2 breaths/min, 34.9 and 38.6 °C, respectively). In a similar experiment, Chaiyabutr et al. (Reference Chaiyabutr, Chanpongsang and Suadsong2008) obtained higher THI and, consequently, increased RT and RR in cows lactating in a non-cooled system. However, the use of a fan and nebulizers (W conditions) provided heat abatement and promoted lower RR and BS, similar to RT under Wo conditions. This may have led to the high DMI and EBAL, but lower production efficiency, with a positive effect by reducing MUN. This represents less loss of N and greater efficiency in the use of nitrogen from the feed compared with Wo conditions. Chaiyabutr et al. (Reference Chaiyabutr, Chanpongsang and Suadsong2008) mentioned that use of evaporative cooling in their studies was not sufficient to completely eliminate heat stress with a THI above 75, which is harmful to milk production.
Another explanation for the changes in RR, BS and RT maybe linked to measurement times. It was found that, at the 14.00 h measurement time, cows had significantly greater changes in these physiological parameters than at 09.40 h. Stressful effects, especially heat stress, accumulate in the animal's body throughout the day. The results of RR, BS and RT were higher with Wo conditions than with W, and higher in the afternoon (14.00 h) compared with the morning (09.40 h). Similar results were obtained by Chaiyabutr et al. (Reference Chaiyabutr, Chanpongsang and Suadsong2008) and Titto et al. (Reference Titto, Negrão, Canaes, Titto, Leme-dos-Santos, Henrique, Calviello, Pereira and Titto2017). However, in the afternoon period, RT, BS and RR did not exceed the levels considered normal for the thermal comfort of the cows, as shown by Renaudeau et al. (Reference Renaudeau, Collin, Yahav, de Basilio, Gourdine and Collier2012) and Igono et al. (Reference Igono, Bjotvedt and Sanford-Crane1992) with an RT of 38.5 °C.
Titto et al. (Reference Titto, Negrão, Canaes, Titto, Leme-dos-Santos, Henrique, Calviello, Pereira and Titto2017) evaluated the physiological responses of high-production cows in indoor climatic rooms with meteorological monitoring, with a THI range 75.5–96.6, air temperature of 26.0–38.0 °C and relative air humidity of 71–84%, from 08.00 to 13.00 h for 7 consecutive days. These authors had to reduce the temperature and relative air humidity rapidly after 6 h of experimentation because RT and RR had reached critical and damaging values for the cows (39 °C and 70 breaths/min, respectively, which are characteristic of heat stress). In addition, at the end of the experiment, there was a 26.6% reduction in milk production with the imposition of heat stress.
In general, the DMI of cows in the current study was not affected by the diet but was affected by the environmental conditions. The MS-based diet increased milk production and provided improved EBAL (76.4 v. 67.2 MJ/day with W and Wo, respectively) and feed N utilization use. The RM-based diet showed inverse trends and led to greater MUN.
The use of an evaporative cooling system in the freestall-type feedlot, using a fan and nebulizers, provided increased DMI, EBAL and N intake, and decreased feed efficiency without affecting milk production. In the absence of an evaporative cooling system (Wo conditions), there was an increase in MUN and decrease in feed N utilization use.
The measurement time and environmental conditions play an important role in the physiological behaviour of cows during the course of daily milk production. The afternoon heat associated with higher ET and higher relative air humidity, e.g. a tropical climate, provided an increase in THI and probably caused more thermal discomfort in cows in the freestall-type feedlot system, thus increasing the RR and BS under W conditions. However, because it provided higher DMI, and did not affect milk production, higher EBAL was observed with both diets under W condition (76.4 v. 69.9 MJ/day, MS- and RM-based diets, respectively). The reverse effect was observed under Wo conditions, with lower EBAL values. (67.2 v. 67.7 MJ/day, with MS- and RM-based diets, respectively). Although it was not the focus of the present experiment, it was observed that, during the hottest times of the day, the cows lay flat on the floor or beds with intense breathing movements or in the standing position with a slight back and forth movements, in order to maximize heat loss under Wo conditions. Under W conditions, it was observed that the animals positioned themselves below the ventilation and nebulization line and later moved to their respective beds after food intake. This agrees with the observations of Vilela et al. (Reference Vilela, Leme, Titto, Neto, Pereira, Balieiro and Titto2013), who reported that animals use behavioural mechanisms and evaporative thermolysis for thermal regulation of the body.
A roughage mixture based on sugarcane and maize silage at 500 : 500 g/kg DM plus concentrate showed promising results and could be a viable alternative to replace maize silage in the diet of pregnant dairy cows and those in the middle third of lactation. The RM-based diet, in the absence of an evaporative cooling system, met the requirements of maintaining milk yield and component concentration similar to the MS-based diet. The relative air humidity, affected by the evaporative cooling system (fan and nebulizers), combined with the high ET, were the factors that contributed most directly to THI. The RT was a physiological response more related to the type of diet and measurement time than the presence or absence of a cooling system in the freestall-type feedlot. In general, cows were more efficient in their thermoregulatory systems with the use of an evaporative cooling system, where they presented lower body temperatures and RR, which was reflected in a higher DMI and higher feed N efficiency use.
Author ORCIDs
F. P. Campos http://orcid.org/0000-0001-9220-450X.
Financial support
The authors are grateful for the financial support from the Sao Paulo Research Foundation (FAPESP), SP, Brazil (grant n° 2005/50926-0).
Conflicts of interest
The authors declare that there are no conflicts of interest.
Ethical standards
The Ethics Committee on Animal Experimentation, Institute of Zootechny, IZ/APTA/Ministry of Agriculture and Supplies of Sao Paulo, Brazil, reviewed and approved the experimental protocol, which is registered under number 089.