


NOMENCLATURE
- A exit
-
cross-section area of the turbojet/ramjet flowpath
- A th,plug
-
throat area near the plug
- De
-
diameter of the diffuser exit plane
- Hc
-
captured height of the inlet
- H bleed
-
height of the bleed cavity
- Ht
-
height of the throat
- L
-
length of the inlet model
- Ld
-
length of the diffuser
- f
-
frequency of pressure oscillation
- M
-
flow or flight Mach number
- P
-
static pressure
- P∞
-
free stream static pressure
- Pav
-
average pressure
- Sp
-
standard deviation of static pressure
- PSD
-
power spectral density
- T
-
non-dimensional time
- TR
-
throttle ratio of turbojet/ramjet flowpath
- δi
-
angle of compression ramp
- σ
-
total pressure recovery
- π
-
static pressure ratio
1.0 INTRODUCTION
Turbine-Based Combined Cycle (TBCC) propulsion systems have been extensively studied in recent years(Reference Hiraiwa, Ito and Sato1-Reference Wang, Wang and Zhang4). It is one of the candidate propulsion systems for access to space. TBCC propulsion systems are reusable and enable horizontal take-offs that may significantly reduce launch costs and improve safety(Reference Bilardo, Curran and Hunt5). Turbine and ramjet engines are integrated into the propulsion system to enable future vehicles that operate across a broad range of Mach numbers, including the subsonic, supersonic and hypersonic flight regimes. The TBCC inlet is an essential component of the propulsion system. It is used to diffuse air from freestream velocity to a lower velocity acceptable for combined cycle systems in a broad range of Mach numbers(Reference Mahoney6). Any unstable operation in a TBCC inlet may result in structural damage, engine surge or non-recoverable thrust loss(Reference Marshall, Gupta and Lewis7).
A number of experimental and numerical studies have performed on TBCC inlets, but few of them investigated shock oscillation. In the 1990s, the Japanese have implemented the Hypersonic Transport Propulsion System Research Project (HYPR). A sub-scale model engine of a ramjet for hypersonic transport was designed and tested in a freestream of Mach 5 in a ramjet engine test facility. The results indicate that the increase of the fluctuation of the shock position and pressure in the inlet lead to a decrease in the margin to unstart. Also, it was shown that the terminal shock position in the supersonic inlet can be controlled with fuel flow rate(Reference Takao, Yoshinari and Hidemasa8). An experimental study was conducted to evaluate the performance of a TBCC inlet concept, consisting of a low speed turbojet inlet and high-speed dual-mode scramjet inlet at the NASA Langley Research Center. Results indicated that the inlets did not interact with each other sufficiently to affect inlet operability. Flow spillage resulting from a high-speed inlet unstart did not propagate far enough upstream to affect the low-speed inlet. Also, a low speed inlet unstart did not cause the high-speed inlet to unstart(Reference Albertson, Emami and Trexler9). Zhang et al(Reference Zhang, Guo and Xie10) designed an over-/under-configuration TBCC inlet with a variable geometry bleed cavity. Numerical simulations and high-speed wind-tunnel experiments were conducted on this inlet to validate the feasibility of the scheme and the aerodynamic characteristics during TBCC inlet mode transition(Reference Zhang, Guo and Xie11).
A great amount of experimental and numerical studies of shock oscillation have been done in regular supersonic and hypersonic inlets. For instance, the unstart oscillatory flow of mix-compression hypersonic inlet was investigated numerically by Fan et al(Reference Fan, Chang and Bao12). The results showed that the dominant frequency of unstart oscillatory flow of hypersonic inlets is reduced by the bleeding of the boundary layer. A shock oscillation phenomenon in supersonic inlets was studied both numerically and experimentally by Nakayama et al(Reference Nakayama, Sato and Akatsuka13). The computed frequency and amplitude showed good agreement with those of the experiment. Ogawa et al(Reference Ogawa, Watanabe and Murakami14) investigated the shock wave oscillations occurring in the internal flow passage. The peak frequencies of the shock oscillation varied with the boundary-layer conditions.
In summary, the research of shock oscillation phenomena was performed for regular supersonic and hypersonic inlets. The investigation of TBCC inlets focuses on the design of the flowpaths and the inlet mode transition. The shock oscillation phenomenon in TBCC inlets has not been investigated yet. This paper investigates the shock oscillation phenomenon appearing at three different operating conditions of a tandem configuration TBCC inlet at Mach 2.0, both numerically and experimentally.
2.0 METHODOLOGY
2.1 Experiment
The tandem configuration TBCC inlet is designed to work within Mach 0-3.0 with mode transition at Mach 2.0. This paper investigates the shock oscillations at the mode transition point, which is critical for combined cycle propulsion systems. A model of the tandem configuration TBCC inlet at Mach number 2.0 and Mach number 3.0 is shown in Fig. 1. The TBCC inlet consists of three parts: supersonic external compression ramps, subsonic diffuser with rectangular section at the entrance transitioning to circular section at the exit, and turbojet/ramjet flowpaths. The compressed air flow is separated into two streams after the third ramp, one is bled out of the inlet through a bleed cavity and the other enters the diffuser. The function of the bleed cavity is to bleed the mass flow at off-design condition. Boundary-layer bleed may also help prevent inlet unstart at the mode transition point. The diffuser geometry was designed mathematically according to Reference Zhang, Liu, Guo and XieRef.15. After the diffuser, the passage is separated into two passages; the inner circular passage is the turbojet flowpath and the outer annular passage is the ramjet flowpath. The area ratio of the turbojet flowpath to the ramjet flowpath is 0.77. The main parameters of the inlet are listed in Table 1. Among them, δ1 ~δ3 are three angles of external compression ramps, Hc is the captured height of the inlet, H bleed is the height of bleed cavity, Ht is the height of the throat, De is the diameter of the diffuser exit plane, L is the length of the inlet model and Ld is length of the diffuser.

Figure 1. Tandem configuration TBCC inlet model.
Table 1 Main parameters of tandem configuration TBCC inlet
The operational modes of engines can be simulated by turbojet and ramjet mass-flow plugs. These two plugs are placed at the exit of the two flowpaths (Fig. 2). The positions of the two plugs are controlled by two motors, so the movement of the turbojet and ramjet plugs can be controlled separately. The Throttling Ratio (TR) is used to define the axial positions of these two plugs according to
 $$\begin{equation}
TR = (1 - {A_{th}}{,_{{\rm{plug}}}}/{A_{{\rm{exit}}}}) \times 100\% \,,
\end{equation}$$
$$\begin{equation}
TR = (1 - {A_{th}}{,_{{\rm{plug}}}}/{A_{{\rm{exit}}}}) \times 100\% \,,
\end{equation}$$
where A th,plug is the throat area near the plug and A exit is the cross-sectional area of the turbojet/ramjet flowpath. During a wind-tunnel experiment, TR can be set to any value between 0% (fully opened) and 100% (fully closed).

Figure 2. Tandem configuration TBCC inlet mass-flow plugs.

Figure 3. Tandem configuration TBCC inlet model in NH-1 high-speed wind tunnel.
The experiment was conducted at the NH-1 high-speed wind tunnel of Nanjing University of Aeronautics and Astronautics. The facility runs in a blow-down mode with a usable run time greater than 40s. The tunnel has a rectangular working section with a constant cross-section 600mm wide by 600mm high, and the length of the working section is 1,580 mm. In the experiment, the inflow Mach number is 2.0, the total temperature is 300K, the total pressure is 208kPa and the turbulence of the inflow is about 0.3%-0.45%. During the test, the angles of attack and yaw were 0°, and only the throttle ratio of the turbojet and ramjet flowpaths changed.
Low- and high-response static pressure measurements were performed by two systems. Low-response pressure measurements were performed by a PSI9001 series pressure scanner system at 30 samples per second with the range of 500kPa and accuracy of ± 0.05% F.S. High-response pressure measurements were performed by dynamic pressure transducers and a TST5913 data acquisition system at 10,000 samples per second. The transducers are labelled by R1–R4, D1-D5 and U1-U5 in Fig. 4. These transducers have an accuracy of ± 0.2% F.S. of the full range (500kPa) and a natural response frequency of 50kHz.

Figure 4. High-response pressure transducers in TBCC inlet.
2.2 Numerical simulation
Numerical simulations of the steady and unsteady flow fields were performed with the FLUENT solver. The unsteady Reynolds-averaged Navier-Stokes equations in three dimensions are solved by using a finite volume spatial discretisation method. In the computations, the inviscid flux scheme is Roe's method and the monotonic upwind scheme for conservation laws (MUSCL) approach is used for variable extrapolation(Reference Cheng, Tan, Sun and Tong16). The turbulent flow is modelled by the Spalart-Allmaras(Reference Spalart and Allmaras17), of which the governing equations are discretised by a second-order upwind scheme. The wall function was used in the near wall region in this research. The fluid is treated as compressible ideal gas. The computational domain includes the flow field surrounding the tandem TBCC inlet and its boundary condition is set as pressure far-field. The no-slip adiabatic wall conditions are imposed in the solid wall boundaries. The geometry is symmetrical and the yaw angle of the model is equal to 0°. The flowfield is symmetrical, too. Therefore, the computational domain is chosen just as the half of the actual one and the symmetry boundary condition was used. Dual-time stepping method is used in the unsteady simulation. A typical computational mesh is shown in Fig. 5.

Figure 5. Typical computational mesh used for steady and unsteady calculations (600,000 cells).
In the experiment, turbojet and ramjet plugs are used to simulate the operating modes of both engines. In the computational fluid dynamics (CFD) simulation, two different boundary conditions were compared. One is the plug boundary condition, which uses a plug to simulate the operating modes of engines. The other is a pressure outlet boundary condition, which uses pressure to simulate the operating modes of engines. Figures 6 and 7 show streamlines and total pressure contour of two different sections at different boundary conditions. From these two figures, we can note that the difference between the two boundary conditions is small. In addition, the pressure boundary condition is more flexible than the plug boundary condition. It is easy to change the backpressure of the turbojet/ramjet flowpaths when the operational condition of the turbojet/ramjet engines change. But for the plug boundary condition, it is more complicated. The axial positions of the two mass flow plugs should change; thus, the model should be re-meshed. The pressure boundary condition was adopted in the present work.

Figure 6. Flow visualisation of TBCC inlet with different boundary conditions.

Figure 7. Total pressure of TBCC inlet with different boundary conditions.
3.0 RESULTS
As we know, the inlet is used to compress the airflow though the external compression ramps, internal contraction and the diffuser. In the supersonic inflow, the oblique shock generates from ramps; after the oblique shock, the static pressure increases slightly. Then the airflow is compressed through the contraction of the flowpath. The throat, which is the minimum cross-sectional area in the inlet system, comes after this contraction of the flowpath. Ideally, a terminal shock, which increases the static pressure of the airflow significantly and decreases the airflow from supersonic to subsonic non-linearly, is designed to located at the throat. Finally, the pressure of the airflow increases steadily though the diffuser. During the wind-tunnel test, the oblique shock and terminal shock can be characterised through the static pressure along the flowpath.
The wind-tunnel experiment was conducted at the condition of keeping the ramjet flowpath throttle ratio constant and increasing the turbojet flowpath throttle ratio steadily. Figure 8 shows the wall static pressure measured by low-response pressure transducers along the flowpath at the condition of TRramjet = 80% and different TRturbojet. The six turbojet throttle ratios are 15.0%, 26.0%, 32.6%, 40.0%, 48.1% and 57.0%, respectively. At each throttle ratio, the turbojet plug was fixed for 4-5s for data acquisition. From Fig. 8, we found that in the first TR, the terminal shock was located downstream of the throat; in the second TR, the terminal shock was located at the throat. In the first two TRs, the operating condition of the TBCC inlet was supercritical. In the third TR, the terminal shock was located at the shoulder of the third ramp. The operating condition of the TBCC inlet was critical. In the last three TRs, the terminal shock was located upstream the cowl lip, and the TBCC inlet operated at a subcritical condition.

Figure 8. Low-response wall static pressure along the flowpath at different TRs.
Figure 9 shows the wall static pressure measured by high-response transducers as the throttle ratio of the turbojet flowpath increased. There are six TRs of wall static pressure signal during a test. Wall static pressure oscillated at each TR with different amplitudes. From the difference between D3 and D2 pressure signals in the first TR of the test, we infer that the terminal shock was located between the D2 and D3 pressure transducers. The enlarged zone in Fig. 9 indicated that the terminal shock is unstable. In the second TR, the pressure at the D1 probe increases rapidly, so the terminal shock is located in front of the D1 probe. The pressure fluctuations measured at the D1, D2 and U2 probes may be caused by the oscillation of the terminal shock. In the third TR, the pressure at the R4 probe oscillated dramatically indicating that the terminal shock moved forward to the shoulder of the third ramp and remained unstable. In the fourth TR, the pressure at the U1 probe oscillated even more than at the R4 probe. That indicated the terminal shock was extremely unstable near the U1 probe. In the last two TRs, the pressure fluctuations were not as dramatic as before. The pressure signal at the R3 probe almost remained steady in the test, which means the terminal shock remained behind the R3 probe, even with the terminal shock located upstream of the cowl.

Figure 9. High-response wall static pressure at different TRs.
The results of the experiment indicate that the terminal shock was unstable in the diffuser, at the shoulder of the third ramp and upstream the cowl lip. Unsteady numerical simulation was conducted, based on the inflow conditions of the wind-tunnel experiment, to analyse the terminal shock motion in the tandem configuration TBCC inlet, as the operating condition of the engines was varied.
3.1 Terminal shock located in the diffuser
Figure 10 shows the comparison between numerical simulation results and experimental data with the terminal shock located in the diffuser. The numerical simulation results fit well with experimental data, except for some deviation in the second bend of the diffuser. The difference was caused by the over-prediction of the separation bubble. The flowpath is narrowed by the bubble and the flow is accelerated. That makes the pressure in CFD smaller than the experimental data. The results of the normal grid (600,000 cells) were consistent with the fine grid (1,230,000 cells). The difference of the parameters in the diffuser exit plane is smaller than 0.1% in these two cases. The numerical simulation method was found to be adopted to investigate the flowfields in a tandem configuration TBCC inlet.

Figure 10. The wall static pressure distribution with the terminal shock located in the diffuser.
The total time of unsteady simulation is 16ms. The characteristics of the D3 probe pressure signal is oscillatory, and within the total time, there are four periods of oscillation. The terminal shock motion in a period when it was located in the diffuser is presented in Fig. 11. The points are the numerical results at each time step, the curve is the PolyFit result of the CFD data. The character of terminal shock motion is similar to a sine curve. The zero position of the terminal shock oscillation is x = 354.4mm, and the amplitude of the shock oscillation is 1mm.
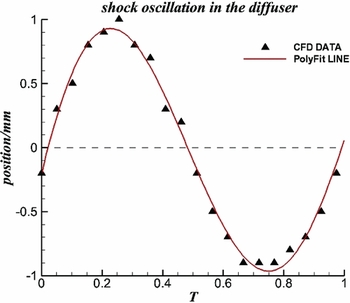
Figure 11. The terminal shock oscillation in the diffuser.
The standard deviation of static pressure in a period of time, which indicates the amplitude of the pressure fluctuation is defined in Equation (2) as
 $$\begin{equation}
{S_p} = \sqrt {\frac{1}{n}\sum\limits_{i = 1}^n {{{({P_i} - {P_{av}})}^2}} } \,,
\end{equation}$$
$$\begin{equation}
{S_p} = \sqrt {\frac{1}{n}\sum\limits_{i = 1}^n {{{({P_i} - {P_{av}})}^2}} } \,,
\end{equation}$$
wherePav is the average pressure at a specific TR, and nis the number of data points used. The standard deviation of the inflow static pressure is 0.50kPa, however, at the D3 probe, it increases up to 3.65kPa. The power spectral density of the static pressure signal indicates the main frequency of pressure fluctuation. As Fig. 12 shows, the frequency of the pressure fluctuation in the experimental data varies from 141Hz to 214Hz, and in the CFD, it is between 200Hz and 350Hz. The pressure fluctuation is inferred to be caused by flow separation. The numerical simulation over-predicted the flow separation and caused the difference in frequency distribution between the experiment and CFD.

Figure 12. The terminal shock oscillation frequency as the shock in diffuser.
After reconsideration, we defined the unsteady phenomenon in the first TR as the “shake” of terminal shock rather than oscillation, because the amplitude of shock motion in the first TR was only 3.33% of the height of the inlet throat. The main cause of the unsteadiness of terminal shock would be the separation bubble on the diffuser sidewall (Fig. 13). The boundary layer on the sidewall within the diffuser develops, starting from the sidewall of the inlet, making it easier to separate. The terminal Shock/Boundary-Layer Interactions (SBLIs) cause the separation to occur on the diffuser sidewall. Figure 13(a) shows a streamwise slice of Mach number between the slice and the symmetry plane at a distance of 100mm, 200mm, 300mm and 400mm, respectively; as the figure shows, when the distance between the slice and the symmetry plane increases, the separation bubble develops. At z = –300mm, the start point of the separation bubble was located right behind the terminal shock. At z = –400mm, which is close to the sidewall, the terminal shock disappears and a big separation bubble shows up. The separated flow contains a point of inflection in the velocity profile. Such profiles are known to be unstable (Rayleigh's first theorem), and spatial stability theory has been used to show that the separated region will amplify disturbances over a narrow frequency range(Reference Newsome18). This unstable nature of the separation bubble is the source of the unstable behaviour of the terminal shock and the fluctuation of pressure. Figure 13(b) shows the spanwise slice of Mach number, and the distance between each slice and lower wall are 2mm, 7mm, 12mm, and 22mm, respectively. Detailed flow fields of the SBLIs are shown in the y = 2mm. The separation bubble on the side wall narrows the passage. At the same time, the streamlines are curved and turn towards the symmetry plane at the separation bubble. As the value of y increases, the separation disappears gradually and the streamlines stay parallel with the sidewall. At y = 22mm, the terminal shock became λ shock in the spanwise direction.

Figure 13. Streamwise and spanwise slices of Mach number contours as the shock in diffuser.
In the second TR, the terminal shock moved from the diffuser to the throat. The amplitude of shock oscillation increased up to 6mm (Fig. 14(a)); the zero position of shock oscillation was x = 329.5mm of the inlet model. Figure 14(b) shows the most upstream and downstream position of the terminal shock during the oscillation. As the figure illustrates, the Mach number before the terminal shock is about 1.4. During the shock oscillation period, the shock was always in the inlet throat. The standard deviation of static pressure measured at the D1 probe is 4.10kPa, and the main pressure fluctuation frequency was about 44Hz (Fig. 15(a)). However, the oscillation frequency in the CFD was 39Hz (Fig. 15(b)). The numerical simulation was quite close to the experimental data.

Figure 14. Terminal shock oscillation amplitude and Mach number contours as shock in the throat.

Figure 15. Terminal shock oscillation frequency as shock in the throat.
3.2 Terminal shock located at the shoulder of the third ramp
In the third TR, the terminal shock moved from the throat to the third ramp of the TBCC inlet. The operating condition of the TBCC inlet transited from supercritical to critical. In general, this type of inlet can't operate at the critical condition. However, the TBCC inlet investigated in the present work can operate at this condition because of the bleed cavity behind the third ramp. Figure 16 shows the most upstream and downstream position of the terminal shock during the oscillation in third TR. As the figure shows, when the terminal shocks located at the upstream position, the separation bubble was at the shoulder of the third ramp and a weak shock stayed at the entrance of the diffuser. When the terminal shock is at the downstream position, the terminal shock becomes a λ shock. The separation bubble in the diffuser develops gradually. The separation occurring in the diffuser and at the shoulder could be the main reason for the mutability of the terminal shock.

Figure 16. Mach number contours of TBCC inlet as the shock in the third ramp shoulder.
Figure 17 shows the terminal shock oscillation amplitude and frequency in the third TR. The amplitude of the oscillation was about 12mm. The main frequency of the R4 pressure signal obtained in the experiment was about 56-67Hz, while CFD predicted a frequency of 89Hz. The difference may be caused by the deviation of the back pressure at the bleed cavity. When the shock was located at the shoulder of the third ramp, it was affected by the back pressure of the diffuser exit plane and the bleed cavity. The standard deviation of static pressure measured at the R4 probe is 12.87kPa, which was greater than the shock instability in the diffuser.

Figure 17. Terminal shock oscillation amplitude and frequency as the shock in the third ramp shoulder.
3.3 Terminal shock located upstream of the cowl
In the fifth TR, the terminal shock moved from the shoulder of the third ramp to the upstream of the TBCC inlet cowl lip, and the operating condition of the TBCC inlet transited from critical to subcritical. In general, inlet buzz would occur with its characteristic large amplitude pressure fluctuations and travelling shock waves(Reference Chang, Wang, Bao and Qin19-Reference Vivek and Mittal22). However, in the fifth TR, the standard deviation of pressure at the U1 probe, which was located right behind the terminal shock, was only 1.40kPa. It was even smaller than the amplitude of oscillation with the shock located within the diffuser. That indicates the pressure fluctuations were small when the TBCC inlet operated at the subcritical condition. Figure 18 shows the Mach number contour in the fifth TR. As the figure illustrates, when the terminal shocks were located upstream the cowl lip, the third oblique shock merged with the first terminal shock. There were two terminal shocks in the inlet; the first terminal shock was an oblique shock located upstream the cowl lip, and the second terminal shock was a normal shock at the shoulder of the third ramp. Between the two terminal shocks, there was a reflection shock generated from the cowl lip. The angle of this reflection shock was obviously greater than the third TR (Fig. 16), because the Mach number in front of the reflection shock was smaller than in the preview case. From Fig. 18, we see that the position of the first terminal shock did not change appreciably. However, the total pressure in the diffuser exit plane did change significantly. This suggests the flow in the diffuser is fully unsteady.

Figure 18. Mach number and total pressure contours of TBCC inlet as the shock upstream the cowl.
The unsteady flow in the diffuser causes the unsteady motion of the terminal shock. After detailed analysis of shock position, the character of shock motion in a period is shown in Fig. 19. The amplitude of the first terminal shock oscillation was 0.6mm, only 2% of the height of the throat. It was even smaller than the amplitude of shock motion in the first TR. We, therefore, define the shock motion in the fifth TR as the “shake” of the shock, which was the same as the first TR.

Figure 19. Terminal shock oscillation amplitude as the shock upstream the cowl.
4.0 CONCLUSIONS
The present work focuses on the investigation of pressure oscillation and terminal shock motion in a two-dimensional inlet designed for tandem configuration Turbine-Based Combined Cycle (TBCC) propulsion systems. The tandem configurationTBCC inlet is a mixed compression inlet consisting of three ramps, an S-shaped rectangular to circular diffuser, and flow paths of both a turbine and a ramjet engine. The characteristic of low- and high-response pressure which is measured in the high-speed wind-tunnel test along the flowpath was analysed and a three-dimensional unsteady numerical study of terminal shock motion with the shock located at three different positions within the inlet, including entrance of the diffuser, the shoulder of the third ramp and upstream of the cowl lip at Mach 2.0, were investigated.
High-speed wind-tunnel experiment results indicate that when the operating condition of the combined cycle propulsion systems changed, the position of the terminal shock changed gradually. At the same time, at each position, the terminal shock motion was different. When the terminal shock was located downstream of the throat and upstream of the cowl lip, the standard deviation of the pressure signal was 3.65kPa and 1.40kPa, respectively. When terminal shock moved upstream to the throat, the frequency measured by the D1 probe was about 44Hz, and the standard deviation at the D1 probe was 4.10kPa. As the terminal shock moved forward to the shoulder of the third ramp, the frequency at the R4 probe was about 56Hz, and the standard deviation at the R4 probe was 12.87kPa.
The computations were performed using a second-order unsteady Reynolds-averaged Navier-Stokes scheme. The results indicate that when the terminal shock is located downstream of the throat and upstream of the cowl lip, the amplitude of shock motion is small, defined as the “shake” of the terminal shock. When the shock is located in the throat and at the shoulder of the third ramp, significant shock oscillation occurs, and the shock oscillation frequency is about 20Hz and 45Hz, and the amplitude is about 6mm and 12mm, respectively.
ACKNOWLEDGEMENTS
The present research was funded under the Fundamental Research Funds for the Central Universities (No. NS2015025), Funding for Outstanding Doctoral Dissertation in NUAA (No. BCXJ16-01) supported by the Fundamental Research Funds for the Central Universities and Aviation Foundation Project (No. 2015ZB52016).


