Introduction
The Solfatara di Pozzuoli is one of ~40 volcanoes in the Campi Flegrei area and is located three kilometres from the centre of the town of Pozzuoli, Napoli, Italy. Solfatara formed during the third Flegrean eruptive period and dates to ~3700–3900 years ago. Inside the Solfatara some active fumaroles are present, the most important of which is called ‘Bocca Grande’ and has a temperature of ~160°C. During a research campaign carried out in 2011, a few samples of the new mineral russoite, NH4ClAs23+O3(H2O)0.5, were collected at the ‘Bocca Grande’ fumarole, where this phase formed as a sublimate product. Powder X-ray diffraction (PXRD) measurements and chemical analysis showed the mineral to be identical to the corresponding synthetic phase NH4ClAs2O3(H2O)0.5 (Edstrand and Blomqvist, Reference Edstrand and Blomqvist1955). A suitable single crystal of the natural product could not be found for an accurate X-ray structure refinement, however the PXRD data and the analytical results perfectly matched those of the synthetic phase and so were considered to be sufficient for a positive identification of the new mineral species for approval by the International Mineralogical Association Commission on New Minerals, Nomenclature and Classification (IMA2015-105). The name russoite was chosen to honour Dr. Massimo Russo (b. 1960), researcher at Osservatorio Vesuviano, Istituto Nazionale di Geofisica e Vulcanologia, Napoli. His work has been devoted mainly to the mineralogy of Italian volcanoes and he is author of several books and articles on this topic. Holotype material is deposited in the Reference Collection of the DCSSI, Università degli Studi di Milano, catalogue number 2015–01.
The recent availability of new material allowed us to obtain more accurate single-crystal intensity data for structure refinement. These data showed the location of the ammonium cation and water molecule different to that proposed by Edstrand and Blomqvist (Reference Edstrand and Blomqvist1955).
Occurrence, chemical data and physical properties
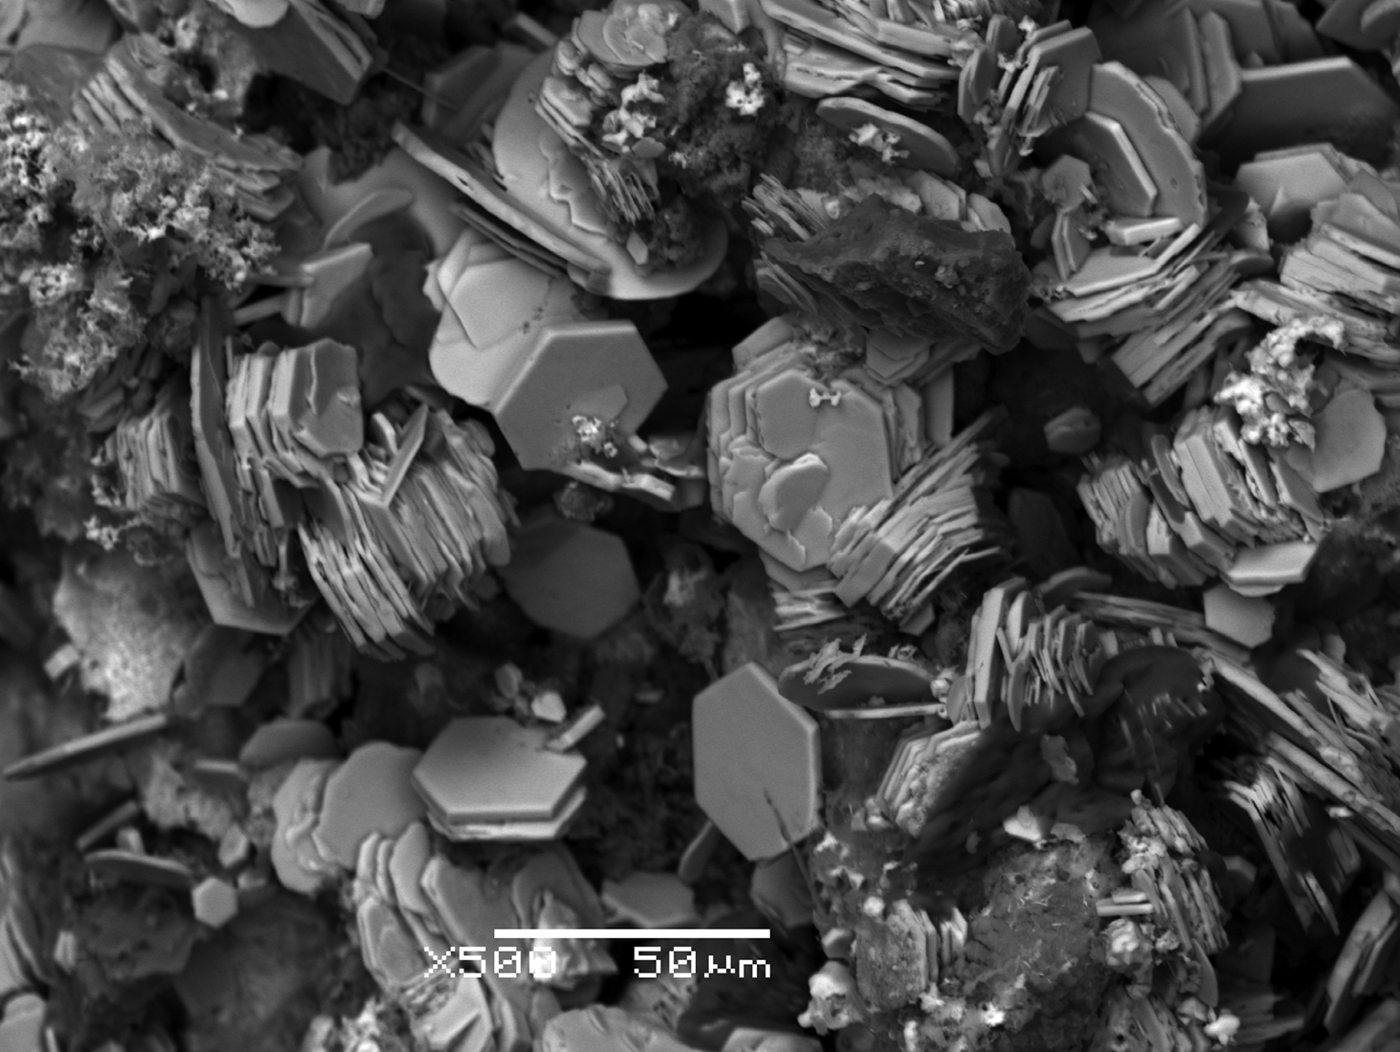
The new mineral russoite was found as a fumarolic phase associated with alacránite, dimorphite, mascagnite, realgar, salammoniac and an amorphous arsenic sulfide. In the same fumarole other interesting and rare minerals are found: adranosite, adranosite-(Fe), efremovite, huizingite-(Al) and godovikovite. Russoite occurs as rosette-like intergrowths or subparallel aggregates formed by hexagonal plates flattened on {001} and bounded by {100} up to ~300 µm in diameter and 15 µm thick, (Figs 1,2). These aggregates are sometimes yellowish due to admixed amorphous arsenic sulfide. Crystals are colourless to white, transparent or translucent, with vitreous lustre and white streak. Tenacity is brittle and fracture is irregular. Cleavage is perfect on {001}. The mineral does not fluoresce in longwave or shortwave ultraviolet light. No twinning is apparent. The measured density by flotation in a diiodomethane/benzene solution is 2.89(1) g/cm3, the calculated density using the empirical formula and unit-cell data is 2.911 g/cm3. Due to the minute size of the crystals the Mohs hardness could not be determined. Optically russoite is uniaxial (–), with ω = 1.810(6) and ε = 1.650(5) (measured in white light). The calculated mean refractive index using the Gladstone-Dale constants of Mandarino (Reference Mandarino1976, Reference Mandarino1981) is 1.757.

Fig. 1. Back-scatter electron image of rosette-like aggregates of russoite.

Fig. 2. Back-scatter electron image of subparallel crystal aggregates of russoite.
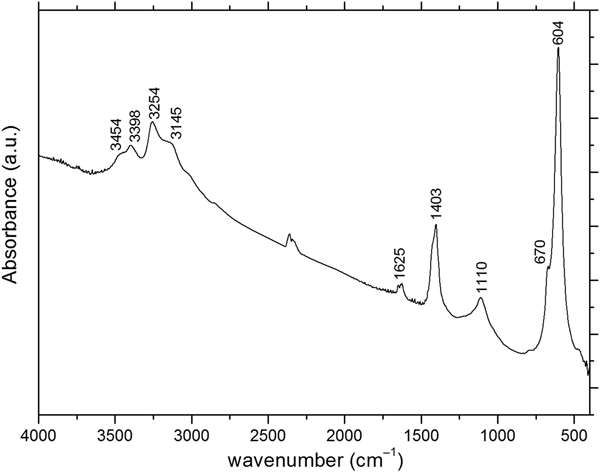
The infrared spectrum of russoite (Fig. 3) was recorded in a KBr disk, in the range 4000–400 cm–1, using a Jasco FTIR-470 Plus spectrometer. It is consistent with the presence of ammonium [bands at (cm–1): 3254, ν3; 3145, 2ν2 and 1403, ν4], H2O [bands at (cm–1): 3454, ν3; 3398, ν1 and 1625, ν2] and arsenite (bands at 604 and 670 cm–1) (Farmer, Reference Farmer1974; Busigny et al., Reference Busigny, Cartigny, Philippot and Javoy2003). The weak absorption at ~2400 cm–1 is due to atmospheric CO2, that at 1110 cm–1 might be attributed to minor OH–, partially replacing the chloride ion.

Fig. 3. Fourier-transform infrared spectrum of russoite.
Quantitative chemical analyses (six) were carried out in energy-dispersive spectroscopy (EDS) mode using a JEOL JSM 5500 LV scanning electron microscope equipped with an IXRF EDS 2000 microprobe (20 kV excitation voltage, 10 pA beam current and 2 µm beam diameter). This analytical method was chosen because the crystal intergrowths did not take a good polish and it was impossible to prepare a flat polished sample; moreover the crystals are severely damaged by using the wavelength-dispersive spectroscopy technique, even with a low voltage and current and a large diameter of the electron beam. In this case, as reported by Ruste (Reference Ruste, Maurice, Meny and Tixier1979) and Acquafredda and Paglionico (Reference Acquafredda and Paglionico2004), the EDS detector gives more accurate analyses of small volumes of sample with a probe current <1 nA and gives good results when collecting X-rays from a non-perfect flat surface of the specimen. X-ray intensities were converted to wt.% by ZAF quantitative analysis software. The standards employed were: synthetic InAs (As); halite (Cl); and synthetic KBr (K and Br). Element concentrations were measured using the Kα lines for Cl and K, and the Lα line for As and Br. The mean analytical results are reported in Table 1. No amounts of other elements above 0.1 wt.% were detected. Water and ammonium contents were not analysed because the mineral is intimately mixed with mascagnite and realgar and is not possible to obtain a sufficient amount of pure sample suitable for this kind of analysis. The presence of N was also evident in the EDS spectrum for some crystals, however the uncertainties of the measurements were considered too large for a quantitative estimation of this element. Therefore, the ammonium and water contents were deduced from the NH4ClAs2O3(H2O)0.5 stoichiometry, taking into account the K content, which partly replaces the ammonium ion (K + NH4 = 1 atoms per formula unit [apfu]). The empirical formula (based on 4.5 anions pfu) is: [(NH4)0.94,K0.06]Σ1.00(Cl0.91,Br0.01)Σ0.92As2.02O3(H2O)0.5. The simplified formula is NH4ClAs2O3(H2O)0.5.
Table 1. Analytical data for russoite (average of six analyses)*.

†Calculated by stoichiometry; S.D. − standard deviation.
The PXRD pattern (Table 2), obtained using a conventional Rigaku DMAX II diffractometer, with graphite monochromatised CuKα radiation, is in good agreement with that calculated for the synthetic phase (PDF2 – entry 00-076-1366, powder diffraction files from the International Centre for Diffraction Data, http://www.icdd.com/), for which the structure was solved by Edstrand and Blomqvist (Reference Edstrand and Blomqvist1955) on the basis of Weissenberg film measurements. Using the same indexing of the synthetic phase and the program UNITCELL (Holland and Redfern, Reference Holland and Redfern1997) the following unit-cell parameters a = 5.259(2), c = 12.590(5) Å and V= 301.55(2) Å3 were refined for russoite. They are in good agreement with those reported for the synthetic phase a = 5.254 and c = 12.574 Å.
Table 2. Powder X-ray diffraction data for russoite and a comparison with the NH4ClAs2O3(H2O)0.5 synthetic analogue (PDF2 – entry 00-076-1366)†.

†ICDD database (powder diffraction files from the International Centre for Diffraction Data, http://www.icdd.com/)
$Pattern calculated from ICSD (Inorganic Crystal Structure Database http://www2.fiz-karlsruhe.de/icsd_home.html) using POWD-12++
*Calculated from the unit cell (a = 5.259(2) Å; c = 12.590(5) Å) obtained from least-squares refinement from the above data using the program UNITCELL (Holland and Redfern, Reference Holland and Redfern1997).
**Calculated from our structure data.
Single-crystal structure determination
A new sampling, carried out in April 2016, after the approval of russoite as a new mineral by the IMA-CNMNC, gave the us opportunity to collect additional specimens with larger aggregates of crystals (up to 0.3 mm), from which an attempt was made to obtain fragments suitable for single-crystal structure determination. In fact, the fragments are not perfect single crystals, as they are made of several small platelets stacked almost parallel to each other, but slightly misaligned. After many attempts, one fragment was found to be composed by only two different individuals, sufficiently misaligned to allow the collection of a complete set of reflections, suitable for a new structure refinement. The diffracted intensities, corresponding to a complete scan of the reciprocal lattice up to 2θ = 63.60°, were collected at room temperature using a Bruker Apex II diffractometer equipped with a 2 K CCD detector and MoKα radiation (λ = 0.71073 Å). A frame-time of 1 min and a 0.5° frame width were used. The intensity data were reduced using the program SAINT (Bruker, 2001), and corrected for Lorentz, polarization and background factors. An absorption correction (μ = 11.39 mm–1, T min = 0.465) was applied using the SADABS program (Sheldrick, Reference Sheldrick2000). Details about the data collection and refinement are summarised in Table 3. The crystallographic information file and structure factors have been deposited with the Principal Editor of Mineralogical Magazine and are available as Supplementary material (see below)
Table 3. Single-crystal diffraction data and refinement parameters for russoite.

Notes: R = Σ||Fo|–|Fc||/ Σ|Fo|; wR2 = {Σ[w(F o2–F c2)2]/Σ[w(F o2)2]}½; w = 1/[σ2(Fo2)+(0.0625q)2] where q = [max(0, F o2) + 2F c2]/3; Gof ={Σ[w(F o2–F c2)]/(n–p)}½ where n is the number of reflections and p is the number of refined parameters.
Starting from the atomic coordinates reported by Edstrand and Blomqvist (Reference Edstrand and Blomqvist1955) we refined the structure in the P622 space group, using the SHELXL97 program (Sheldrick, Reference Sheldrick2008) implemented in the WinGX suite (Farrugia, Reference Farrugia1999). This refinement apparently confirmed the atomic positions found by these authors for all the atoms, with the only exception of the location of the ammonium ion on the 2d Wyckoff position [⅓, ⅔, ½]. It should be noted that the ammonium position was chosen by Edstrand and Blomqvist (Reference Edstrand and Blomqvist1955) between two possible residuals in the electron density map, as it was the only one which assured reasonable ammonium–chloride distances, and the correct charge balance, if fully occupied. In our difference-Fourier map we found instead no significant electron density at the 2d Wyckoff position, but an electron density residual of ~4.4 e −/ Å3 at the 3g Wyckoff position [½, 0, ½], which was thought at first to be compatible with the possible presence of the ammonium ion at this site. With this assumption, because the multiplicity of the ammonium site is 3 and that of the chloride site is 2, the occupation of the ammonium ion should have been fixed to the value of ⅔ to maintain the charge balance between the ammonium and the chloride ions. However, even with partial occupation of this site, the ammonium ions are too close one another at a distance of 2.6315(4) Å, which is unrealistic. To obtain a correct set of interatomic contacts among the ammonium ions, the occupancy of the site should have been ⅓ only, but this does not fulfil charge balance. At this point we began to doubt that other atoms in the model proposed by Edstrand and Blomqvist were correctly assigned, even if they apparently refined correctly, in particular the location of the water molecules between two As2O3 layers. Our doubts have also been supported by the evidence that the large cations are located between the As2O3 layers in the structure of the other phylloarsenites (see later). Therefore we replaced the water molecule at the 1a Wyckoff position by an ammonium ion, and we considered the 3g Wyckoff position to be ⅓ occupied by an additional ammonium and ⅓ occupied by a H2O molecule. This model is confirmed by the values of the refined occupancies (see Table 4) of the site and by the correct interatomic contacts between symmetry-related and hydrogen-bonded ammonium cations and water molecules. Replacement of ammonium with minor K, as suggested by the chemical analysis, was also taken into account. The value of the refined occupancy of the N(1) site is in good agreement with the K content obtained from the chemical analysis. The H atoms of the H2O molecule and of the ammonium ion at 3g could not be located in a difference-Fourier map, where residual peaks around O and N indicate a situation of disorder. The same happens for the hydrogen atoms of the ammonium N(1), which is located inside a regular hexagonal prismatic cavity, because the site symmetry is higher than the symmetry of the ammonium ion and each hydrogen is therefore distributed over a number of symmetry-related sites. The final R index is 0.0518 for 311 independent data having I > 2σ(I) and 21 parameters. The MISSIM algorithm in the PLATON program (Spek, Reference Spek2003) suggests a possible P6/mmm (pseudo) symmetry for the non-disordered atoms of the structure. The statistical test (|E 2–1| = 0.876) does not indicate unequivocally the centrosymmetric/non-centrosymmetric nature of russoite (expected values: centrosymmetric = 0.968, non-centrosymmetric = 0.736). As the refinement in the space group P6/mmm gives a significantly higher final R = 0.0606 for 232 independent data with I > 2σ(I), the correct space group for russoite seems to be P622. Fractional atomic coordinates, occupancies, and anisotropic displacement parameters are presented in Table 4. Selected interatomic distances are reported in Table 5.
Table 4. Atomic coordinates and displacement parameters [U eq/U (i,j), Å2] for russoite*.

Wyck. – Wyckoff letter
*The anisotropic displacement factor exponent takes the form: −2π2(U 11h 2(a*)2+… + 2U 12hka*b* + …);
U eq according to Fischer and Tillmanns (Reference Fischer and Tillmanns1988).
Table 5. Selected interatomic distances (Å) and angles (°) in russoite.

Crystal structure of russoite
The mineral, together with lucabindiite (K,NH4)As4O6(Cl,Br) (Garavelli et al., Reference Garavelli, Mitolo, Pinto and Vurro2013), torrecillasite Na (As,Sb)43+O6Cl (Kampf et al., Reference Kampf, Nash, Dini and Molina Donoso2014) and gajardoite KCa0.5As43+O6Cl2·5H2O (Kampf et al., Reference Kampf, Nash, Dini and Molina Donoso2016), forms a small group of phylloarsenite minerals. All these phases contain electrically neutral As2O3 sheets consisting of As3+O3 pyramids that share O atoms to form six-membered rings. The large cations are located between the sheets and the halide anions are outside them.
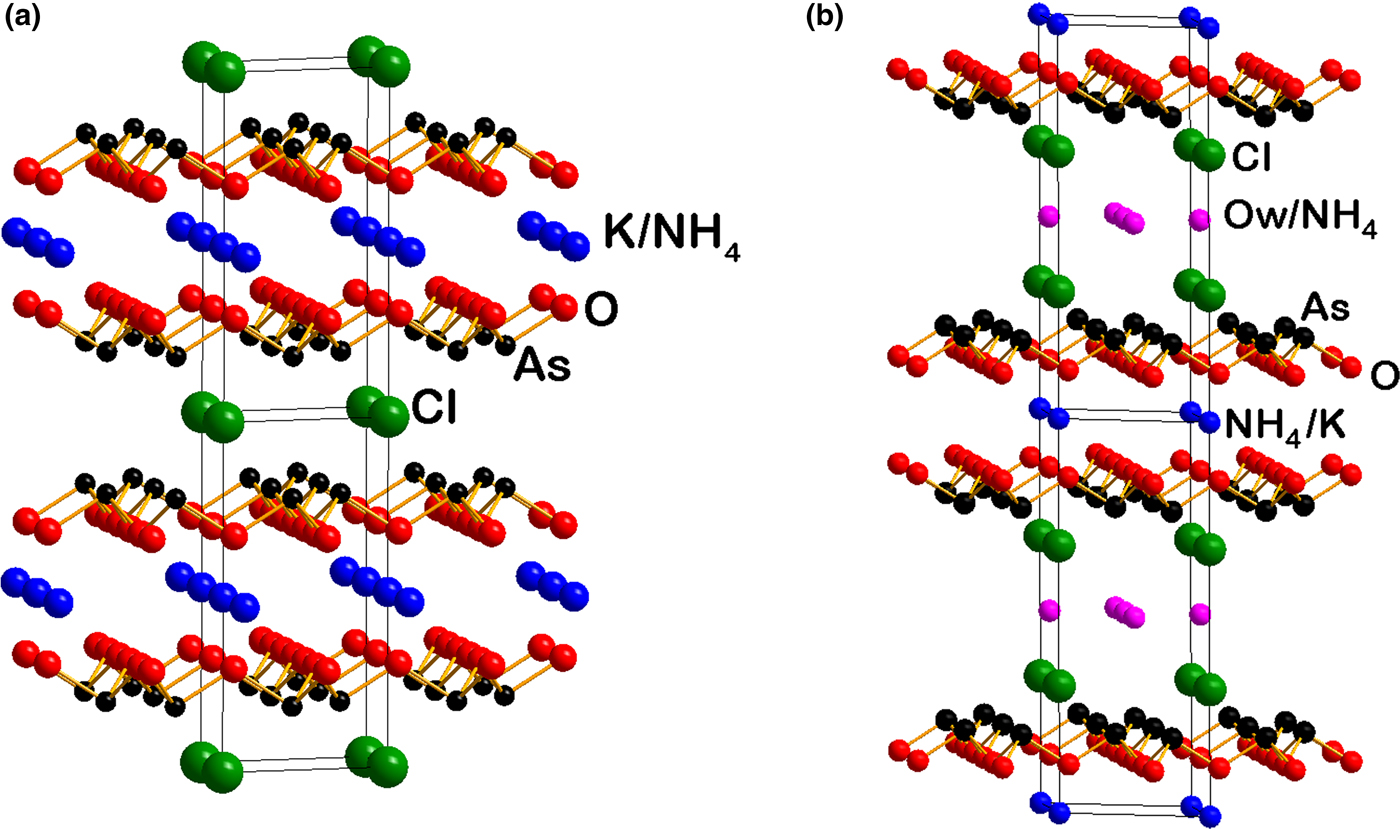
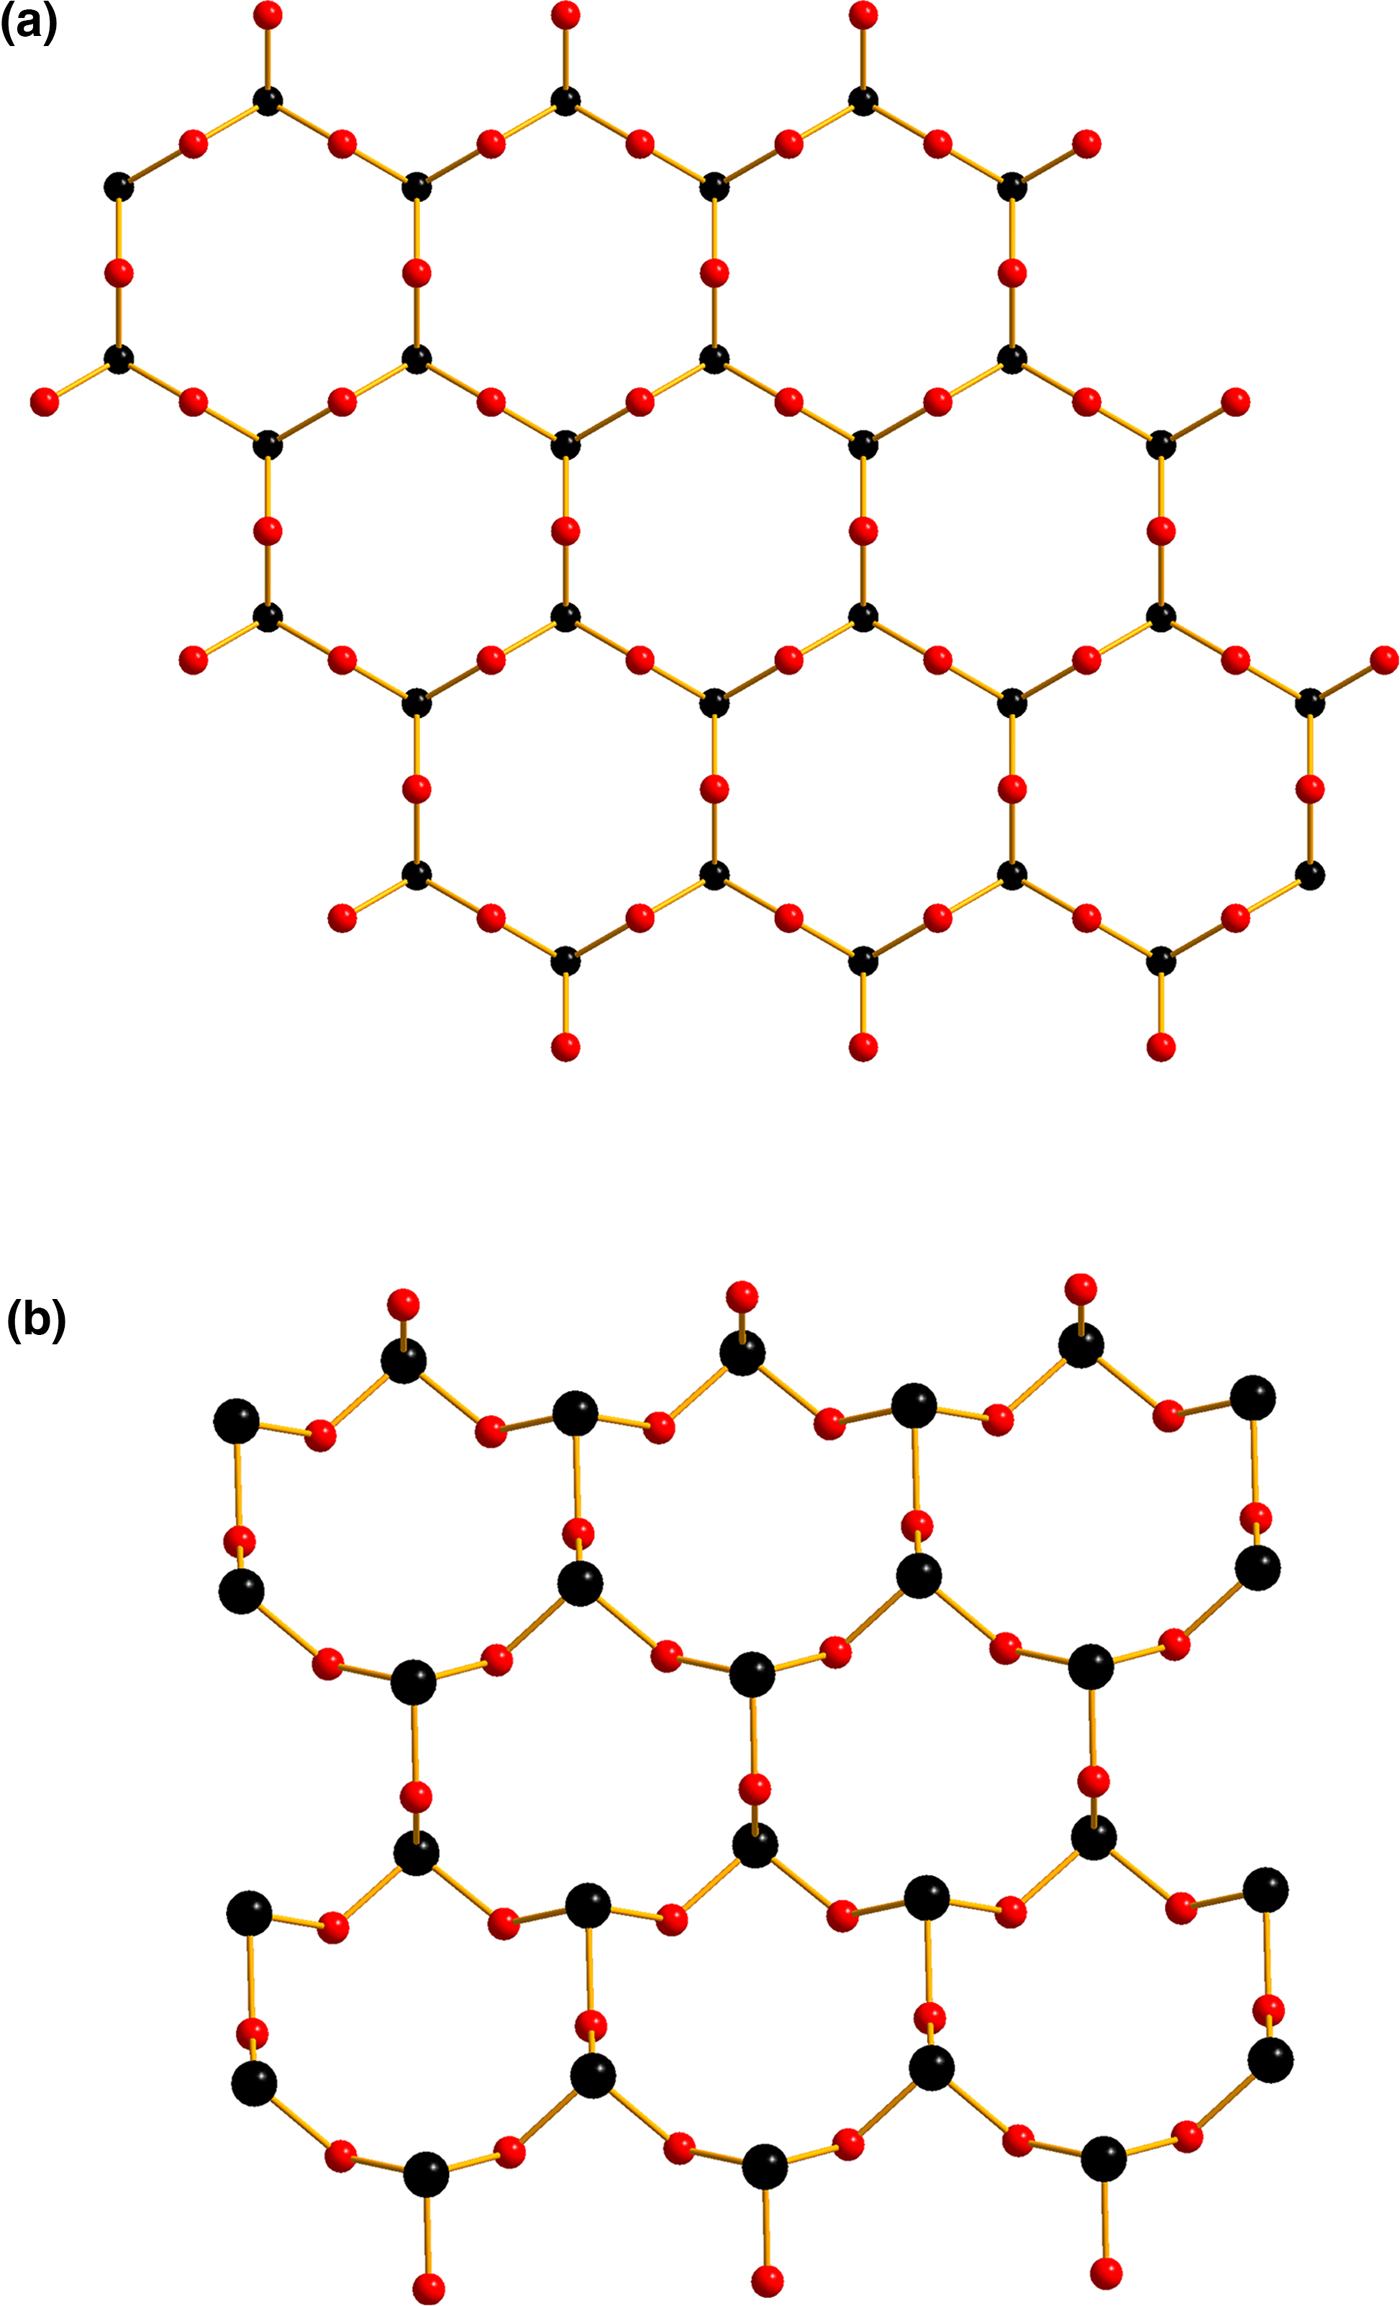
Russoite has closer structural relationships with lucabindiite, (K,NH4)As4O6(Cl,Br) (a = 5.2386(7) and c = 9.014(2) Å), a complex arsenite chloride first found at La Fossa crater, Vulcano Island, Sicily, and with gajardoite KCa0.5As43+O6Cl2·5H2O (a = 5.2558(8) and c = 16.9666(18) Å). These minerals display similarity in their hexagonal unit-cell parameter a, whereas the c parameter is variable due to the different stacking sequence of the large cations, chloride ions and H2O molecules (Fig. 4). In russoite, lucabindiite and gajardoite, the conformation of the As2O3 layers (Fig. 5a) is the same, with all the As apices, and therefore the stereoactive lone pair of each As3+ atom, pointing in the same direction normal to the layer (planar layers). In the orthorhombic torrecillasite (Fig. 5b) one of the As apices points in the opposite direction (wavy layers). Planar As2O3 layers with interlayer regions containing M large cations, alternating with interlayer regions containing halogen anions, are also present in a group of synthetic compounds isostructural with lucabindiite, studied by Pertlik (Reference Pertlik1988), with the general formula MAs4O6X (M = K or NH4; X = Cl, Br or I).

Fig. 4. A comparison between the structure of lucabindiite (a) and that of russoite (b).

Fig. 5. As2O3 sheets in russoite, lucabindiite, gajardoite (a) and torrecillasite (b); As = black spheres and O = red spheres.
The peculiarity of russoite is that we have, in the region between two levels of chloride ions, a disordered layer of water molecules and ammonium cations, interacting with each other via hydrogen bonds. The bond-valence analysis (Table 6) shows reasonable values with only one striking anomaly: the bond-valence sums for the Cl site is only 0.16 valence units (vu). Low values of the bond-valence sums for the Cl site have also been observed in lucabindiite (0.31 vu), torrecillasite (0.49 vu) and gajardoite (0.24 vu) and were interpreted by Kampf et al. (Reference Kampf, Nash, Dini and Molina Donoso2016) to be possibly related to the strong repulsive effect of the As3+ lone pair, which is directed towards the Cl sites. The coordination of the As atoms is therefore characterised by the presence of three short As–O distances (1.7995(9) Å and three As···Cl longer interactions (3.3422(7) Å).
Table 6. Bond-valence analysis for russoite (non-disordered atoms). Values are expressed in valence units (vu)*.

*As3+−O, As3+–Cl and NH4+−Cl bond-valence parameters from Brown and Altermatt (Reference Brown and Altermatt1985), Brese and O'Keeffe (Reference Brese and O'Keeffe1991) and Brown (Reference Brown2009), respectively.
Supplementary material
To view supplementary material for this article, please visit https://doi.org/10.1180/minmag.2017.081.097.
Acknowledgements
The authors are indebted to Silvia Bruni for the FTIR measurements. Valuable suggestions and constructive comments for improving the manuscript were given by Luca Bindi, Charles Geiger, Anthony Kampf and Peter Leverett.


