

The Pearl River Delta (PRD) covers an area of 54,733km2, including 13,357km2 of agricultural land, of which 4829km2 is used for rice production. Grain yield in the area totals 3383.50 thousand tonnes per year or 80.7% of the total grain output of Guangdong province (Guangdong Statistics Bureau 2015). During the past three decades, the PRD has undergone a rapid transition from a traditional agricultural region to an increasingly industrial and technological one. As a consequence, the soils in the PRD have been extensively contaminated by heavy metals due to the rapid expansion of agriculture, industry, the economy and urbanisation (Hu et al. Reference Hu, Liu, Bai, Shih, Zeng and Cheng2013). Rice is the primary staple food for more than half of the world's population (Qian et al. Reference Qian, Chen, Zhang, Li, Chen and Li2010). The PRD is the largest industrial and population centre in China and is subject to increasing pollution from local mining and power industries.
Heavy metals in soil may remain in local ecosystems for a long time and pose a potential threat to public health (Ben Fredj et al. Reference Ben Fredj, Wali, Khadhraoui, Han, Funamizu, Ksibi and Isoda2014). Mining and smelting processes are primary sources of heavy metal pollution in the PRD due to the transportation of mine tailings and acid mine drainage to ecosystems (Zhuang et al. Reference Zhuang, Zou, Xia and Wang2013). Studies have shown that industrial activities are causing continuous damage to PRD ecosystems (Kuang et al. Reference Kuang, Zhou, Wen and Liu2007). Some traditional industries, especially the coal-fired power plants, release heavy metals into the environment through leaching and atmospheric emission (Fernandez-Turiel et al. Reference Fernandez-Turiel, de Carvalho and Cabanas1994; Cheng Reference Cheng2003). Heavy metals then enter the soils, directly or indirectly, through wastewater, irrigation or atmospheric deposition (Wong et al. Reference Wong, Li, Zhang, Qi and Peng2003). Heavy metal uptake by crops generally includes direct absorption from atmospheric deposition and translocation from agricultural soils (Kachenko & Singh Reference Kachenko and Singh2006; Kabata-Pendias & Mukherjee Reference Kabata-Pendias and Mukherjee2007). When grown in water-flooded soils, rice may take up more heavy metals than other crops and the absorbed heavy metals can be easily transferred to grains (Khan et al. Reference Khan, Islam, Panaullah, Duxbury, Jahiruddin and Loeppert2010). Food consumption is the main pathway for human exposure to heavy metals (Meharg et al. Reference Meharg, Norton, Deacon, Williams, Adomako, Price, Zhu, Li, Zhao and Mcgrath2013). Because of toxicity, non-degradability and easy bioaccumulation, the accumulation of heavy metals in the edible plant parts pose a persistent threat (Banat et al. Reference Banat, Howari and Al-Hamad2005; McBride Reference McBride2007; Chang et al. Reference Chang, Yu, Chen, Li, Zhang and Liu2014). Prolonged exposure to heavy metals may cause damage to the central nervous system, causing chronic diseases such as cancer (Waisberg et al. Reference Waisberg, Joseph, Hale and Beyersmann2003; Omar et al. Reference Omar, Praveena, Aris and Hashim2015). Therefore, a better understanding of the transfer and accumulation of heavy metals from paddy soils to rice grains is critical for an accurate assessment of potential risk.
The North River Basin (NRB), upstream of the PRD, also has large opencast mines and is also a major producer of rice (Luo et al. Reference Luo, Liu, Fu, Liu, Wang and Zhou2008; Li et al. Reference Li, Becquer, Dai, Quantin and Benedetti2009a, Reference Li, Rouland, Benedetti, Li, Pando, Lavelle and Daib). Emissions from mining, smelting and industry in the NRB have not been strictly controlled in recent decades, and large amounts of wastewater, sludge, e-waste and exhaust, which often contain elevated concentrations of heavy metals, have been released, much of which has ended up in the PRD (Zhou et al. Reference Zhou, Dang, Cai and Liu2007; Zhao et al. Reference Zhao, Xia, Fan, Zhao and Shen2012). Previous studies have confirmed an increase in heavy metals in the soil in the PRD, and the degree of heavy metal pollution in soils diminishes in the following order: cadmium (Cd) > copper (Cu) > nickel (Ni) > zinc (Zn) > arsenic (As) > chromium (Cr) > mercury (Hg) > lead (Pb) (Bai & Liu Reference Bai and Liu2014). Li et al. (Reference Li, Becquer, Dai, Quantin and Benedetti2009a, Reference Li, Rouland, Benedetti, Li, Pando, Lavelle and Daib) report that the total contents of four heavy metals had the average values of 283mgCukg–1, 393mgPbkg–1, 296mgZnkg–1 and 0.67mgCdkg–1 in agricultural fields along the Yanghe Valley, near the Dabaoshan polymetallic mine in the NRB. As a consequence, the transfer of heavy metals downstream may lead to the severe contamination of soils and crops, as well as causing health problems in people (Liu et al. 2009; Quan et al. Reference Quan, Yan, Lei, Yang, Li, Xiao and Fu2014). Associated soil and air contaminants may intensify heavy metal accumulation in rice grains. The ‘cadmium rice' contamination incident, which occurred in 2013 in the NRB, demonstrates the exposure that people in this region can be subjected to (Yang et al. Reference Yang, Lan, Wang, Zhuang and Shu2006). The basin's dominant paddy soil type, Plinthudult, is highly acidic. The cultivation pattern of alternating periods of flooding and drying results in the high mobility and bioavailability of heavy metals in paddy soils. Therefore, more attention should be paid to potential food safety issues associated with paddy ecosystems (Neumann et al. Reference Neumann, St Vincent, Roberts, Badruzzaman, Ali and Harvey2011; Li et al. Reference Li, Chen, Fu, Cui, Shi, Wang and Liu2012). The complicated natural conditions (parent material and water regime) combined with intensive anthropogenic activities (mining and smelting, industrial processes) make the NRB region a perfect fit for research on heavy metals (Zhang et al. Reference Zhang, Guo and Wu2015). Few studies have been conducted on heavy metal uptake by rice plants in this critical region, and even less on the potential health risks posed by the rice from the paddy soils in the NRB. Thus, it is of practical significance to investigate the distribution and health risks of heavy metals in the paddy soils of the NRB.
In the present study, the total concentrations of Cu, Cd, Pb and Zn in the paddy soils and the various rice organs sampled from four typical sites around mining and industrial sites in the NRB were determined. The objectives of the present research were to (1) investigate the distribution of Cu, Cd, Pb and Zn in paddy soils and rice plants to quantify the effects of heavy metals from mining and power industry activities on the surrounding environment; (2) explore the differences in metal bioaccumulation by rice plants grown in different sites and the potential factors that influence metal transportation by rice; and (3) evaluate the potential health risks faced by the people living in the study area because of dietary intake of heavy metals via rice consumption. The results provide an evaluation of health risks associated with the consumption of rice grown in highly polluted soils in industrial or mining areas, in the hope of drawing attention to both the safety and quality of agricultural products in the PRD.
1. Material and methods
1.1. Site description
The study area is in the north of Guangdong Province, South China [23°51′53″–25°07′51″N; 113°22′05″–113°47′56″E] (Fig. 1). It has a typical subtropical monsoon climate with an average annual temperature of 21°C and an average annual precipitation of ∼1800mm. The rainy season is from April to September and contributes >70% of the total annual precipitation. The main crop is rice. Four sampling sites around different contaminant sources in the NRB were selected. The Fogang (FG) site [23°51′53″–23°51′56″N; 113°39′16″–113°39′52″E] (Fig. 1a), a pyrite and Pb/Zn mine site in Shuitou Town, Fogang County, is situated in the southern portion of the NRB. The Dabao Mountain (DB) site [24°30′00″–24°38′38″N; 113°45′11″–113°47′56″E] (Fig. 1b) is approximately 3–6km away from an opencast mine producing mainly pyrite, pyrrhotite and chalcopyrite, with also the minor production of sphalerite, chalcocite, galena, limonite and calaverite in Shaxi Town, Qujiang County. The Shaoguan (SD) site [24°34′47″?24°36′05″N; 113°33′48″?113°35′40″E] (Fig. 1c) is mainly affected by mining and atmospheric deposition from a power plant in Wushi Town, Qujiang County. The Lechang (LC) site [25°07′48″?25°07′51″N; 113°22′05″?113°23′13″E] (Fig. 1d) is close to a Pb/Zn mine which has been operating since 1959 in Liantang Village, Lechang County. The mine covers an area of 1.5km2 and annually produces 25,000 tonnes of waste rocks and 30,000 tonnes of tailings (Shu et al. Reference Shu, Ye, Lan, Zhang and Wong2001).
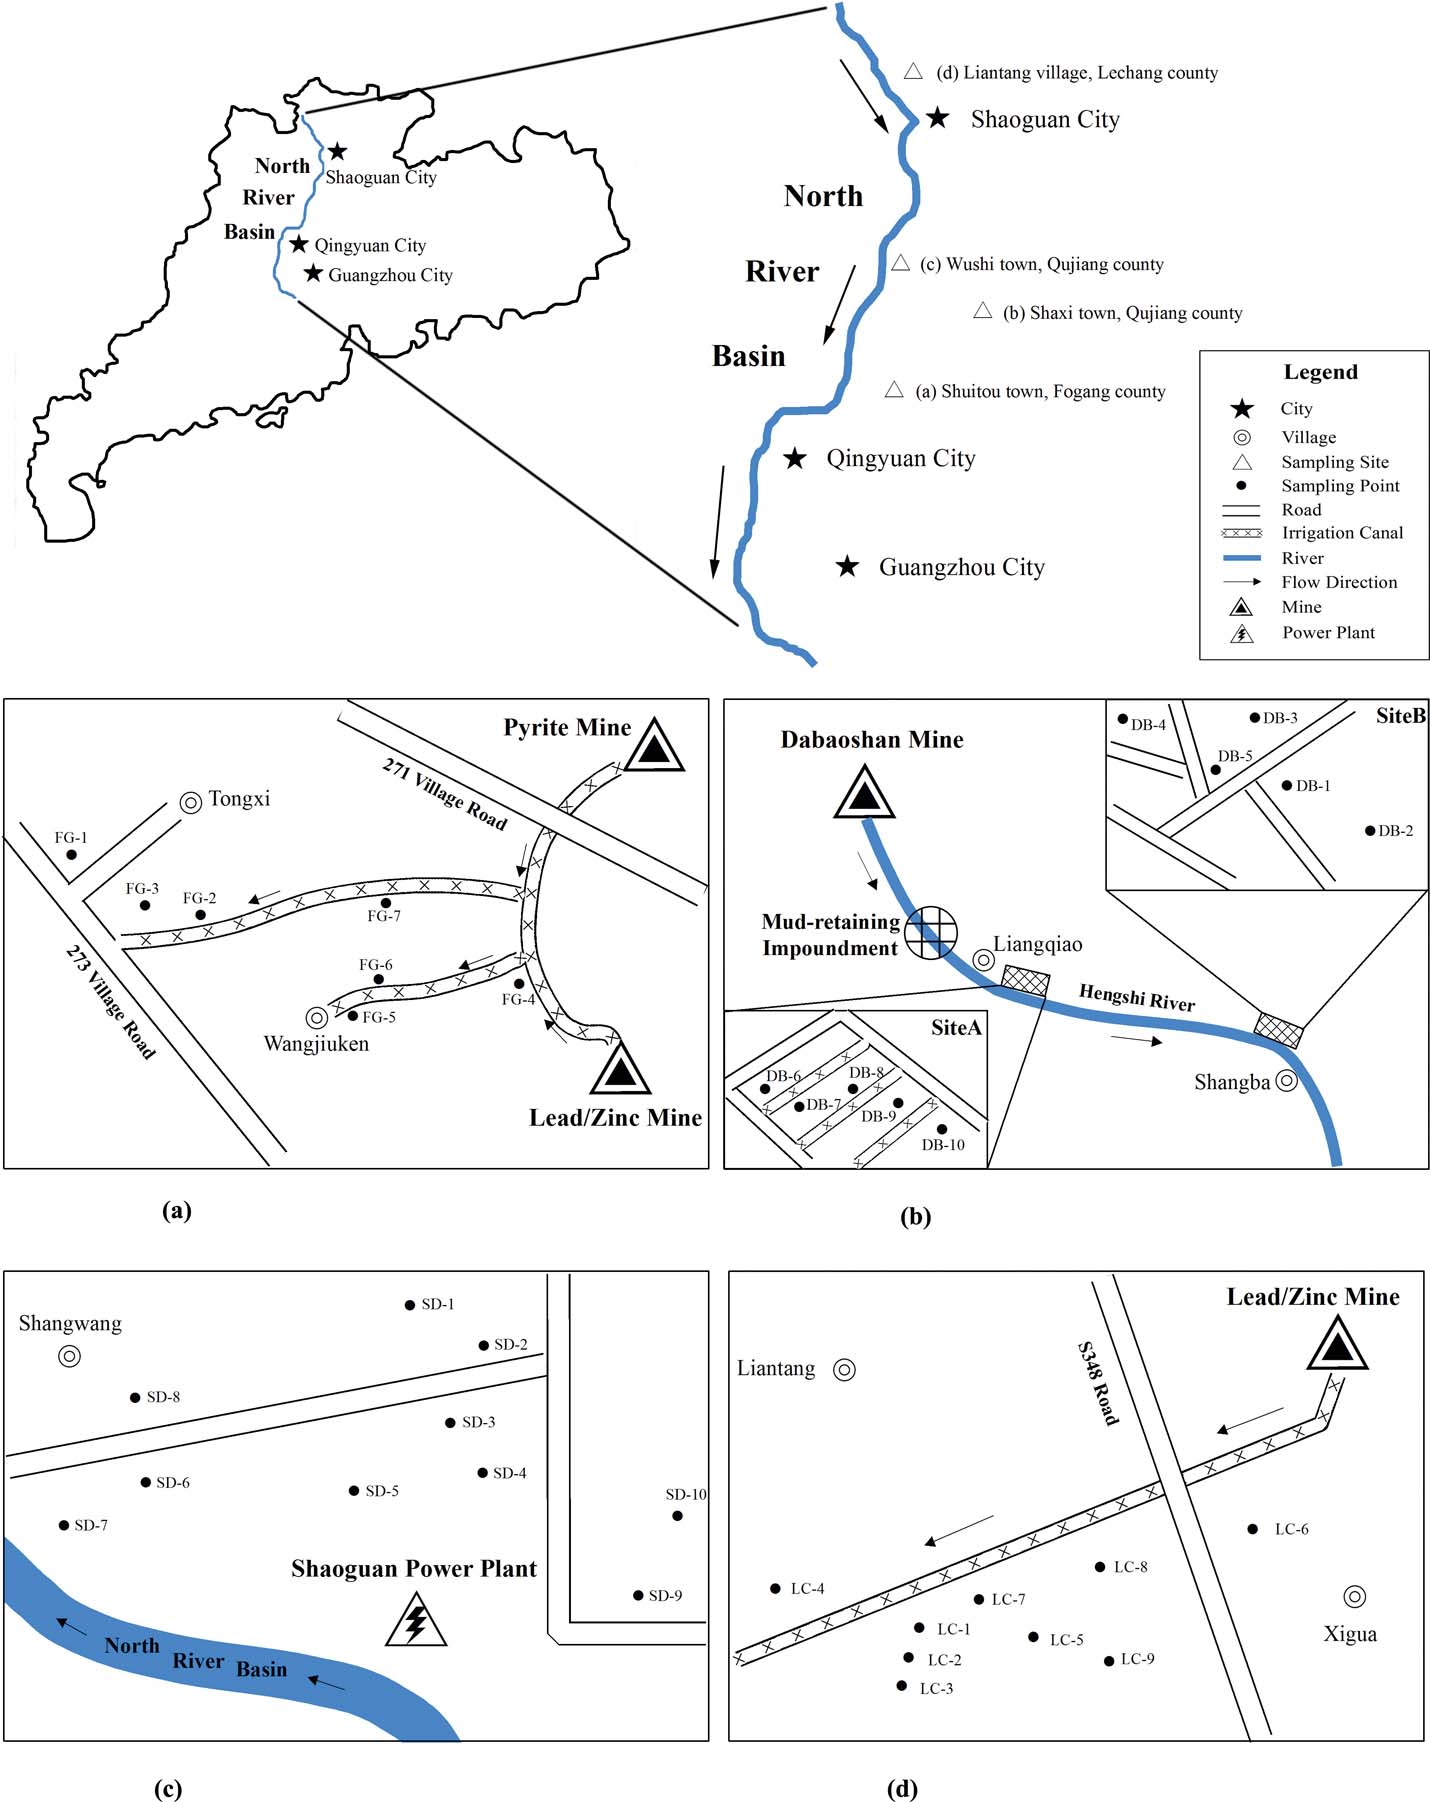
Figure 1 The sampling sites in the North River Basin, Guangdong Province, South China. (a) Shuitou Town, Fogang County. (b) Shaxi Town, Qujiang County. (c) Wushi Town, Qujiang County. (d) Liantang Village, Lechang County. Abbreviations: FG = Fogang site; DB = Dabao Mountain site; SD = Shaoguan site; LC = Lechang site.
1.2. Soil and rice sampling and pre-treatment
The sampling sites are shown in Figure 1. Thirty-six paddy rhizosphere soil samples (0–20cm in depth) were collected, including seven samples from FG, ten samples from DB, ten samples from SD and nine samples from LC. Each of these 36 samples were a composite sample of four random sub-samples. In addition, four replicates of mature rice plants corresponding to each rhizosphere soil sample were collected. All rhizosphere, soil and rice plant samples were stored in clean polyethylene bags and brought back to the laboratory. The rhizosphere soil samples were air-dried and ground to pass through a 2mm and 0.15mm plastic sieve, respectively. After being washed, first with tap water and then with distilled water, the rice plants were blotted with filter paper and fresh weights of each were recorded. The rice plants were then separated into roots, stems, leaves and grains and dried at 105°C for 0.5h and 65°C to reach a constant weight. Before use, the plant parts were pulverised, sieved to pass a 1-mm plastic sieve, homogenised and then stored in polythene zip-bags.
1.3. Sample analysis
Soil pH was measured using a soil/water ratio of 1:2.5. Organic carbon (OC) content was determined by the dichromate digestion method (Pansu & Gautheyrou Reference Pansu and Gautheyrou2006). The results of pH and OC determinations are summarised in Table 1. Soil samples and plant tissues were digested using concentrated HCl-HNO3-HF-HClO4 (Sparks et al. Reference Sparks, Page, Helmke, Loeppert, Soltanpour, Tabatabai, Johnston and Sumner1996) and concentrated HNO3-HClO4 (Kashem & Singh Reference Kashem and Singh1999) for heavy metal analysis, respectively. Concentrations of Cu, Pb and Zn were determined by ICP-AES (Prodigy XP, Leeman, USA), and Cd concentration was determined by AAS (Z-2300, Hitachi, Japan). For quality assurance and quality control, internal standard soil samples (GSS-5) and grain samples (GBW 080684) were analysed with recoveries of 98–102%. The samples were all analysed in triplicate. The heavy metal contents of soils and rice were calculated on dry weight basis.
Table 1 The physico-chemical properties of the paddy soils from the four sampling sites. Abbreviations: FG=Fogang site; DB=Dabao Mountain site; SD=Shaoguan site; LC=Lechang site.

1 The values shown are mean±standard deviation. Different letters in the same column denote significant differences (P<0.05).
1.4. Pollution index method
The single-factor pollution index (Pi) and Nemerow synthetic pollution index (PN) were calculated to assess the degree of metal pollution in the soils (Cheng et al. Reference Cheng, Shi and Zhu2007; Chen et al. Reference Chen, Huang, Hu, Weindorf, Liu and Niedermann2014). The single-factor pollution index was calculated as follows:
 $$P_i = { C_i \over S_i }$$
where Pi is the single-factor pollution index of metal i in soil; Ci is the on-the-spot concentration of metal i; and Si is the standard value (GB15618-1995, Grade II) of metal i. Pi > 1 represents heavy metal pollution.
The Nemerow synthetic pollution index was calculated using the following formula:
 $$P_N = \sqrt{ { P^2_{ MAX} + P^2_{AVE} \over 2 } }$$
where PN is the Nemerow synthetic pollution index for all assessed samples; P MAX is the maximum of the single-factor pollution indices for all samples; and P AVE represents the arithmetic average of the single-factor pollution indices for all samples. Heavy metal pollution was classified into five grades based on the Nemerow index (Zhao & Li Reference Zhao and Li2013): PN<0.7, safe; 0.7<PN<1.0, precaution needed; 1.0<PN<2.0, slight pollution; 2.0<PN<3.0, moderate pollution; and PN<3.0, serious pollution.
1.5. Transfer factor (TF)
TF, an index indicating the ability of plants to accumulate a certain metal in different tissues relative to the metal's concentration in soil (Wang et al. Reference Wang, Angle, Chaney, Delorme and Reeves2006a, Reference Wang, Su, Chen, Lin, Luo and Gaob; Luo et al. Reference Luo, Liu, Wang, Liu, Li, Zhang and Li2011), was calculated using the following equation:
 $${TF_{soil {\hbox -}root}} = {C_{root} \over C_{soil} }}$$
 $${TF_{root{\hbox -}grain}} = {C_{grain} \over C_{root} }}$$
 $${TF_{soil{\hbox -}grain}} = {C_{grain} \over C_{soil} }}$$
where C root, C soil and C grain represent the heavy metal's concentrations in rice roots, soils and grains, respectively.
1.6. The daily intake of metals (DIM) and estimated daily exposure to metals (EDEM)
EDEM through rice depends on metal concentration in rice grains, the daily rice consumption rate as well as body weight (Jallad Reference Jallad2015), and was calculated with the following formula:
 $$\eqalign{ DIM &= Daily\ grain\ consumption \cr &\times Mean\ grain\ metal\ concentration |$$
 $$EDEM = { DIM \over Body\ weight }$$
where the average daily grain consumption is 491.5 gday–1 person–1 and 289.6gday–1person–1 for local adults and children, respectively (Liu et al. Reference Liu, Luo, Gao, Li, Lin, Wu and Li2010), and the average body weight is 55.9kg and 32.7kg for adults and children, respectively (Li et al. Reference Li, Chen, Fu, Cui, Shi, Wang and Liu2012).
1.7. Health risk index (HRI)
The HRI for the locals through the consumption of contaminated grains was calculated based on the food chain and the reference oral dose (RfDO) for each metal (Eq. 6). The RfDO was 40μgkg–1d–1 for Cu, 0.5μgkg–1d–1 for Cd, 3.5μgkg–1d–1 for Pb and 300μgkg–1d–1 for Zn (JECFA, 1993; USEPA 2002).
 $$HRI = { EDEM \over RfD }$$
HRI<1 means the exposed population is assumed to be safe. HRI > 1 means a potential risk associated with the contaminant (Harmanescu et al. Reference Harmanescu, Alda, Bordean, Gogoasa and Gergen2011).
1.8. Statistical analysis
The data were statistically analysed using the statistical package SPSS 10.0 (SPSS, USA). Differences in total metal content among different sampling sites were determined by one-way analysis of variance (ANOVA) with a significance level of P<0.05. Principal component analysis (PCA) was carried out using the ADE-4 software.
2. Results and discussion
2.1. Soil properties and heavy metal contents
The characteristics of the soils sampled at the four sites are presented in Table 1. The pH values of the soils ranged from 4.14 to 6.72. The paddy soils at DB and FG were acidic (pH 4.61 and 4.79, respectively). The low soil pH at these two sites can be attributed to decades of irrigation with waste water derived from mining. The soil at SD was slightly acidic (pH 5.42) while the soil at LC was nearly neutral (pH 6.12). The average OC content ranged from 32.41 to 69.22gkg–1, with the highest and lowest levels in SD and LC soils, respectively.
As shown in Fig. 2, the paddy soils were seriously contaminated with Cu, Cd, Pb and Zn. The average contents of the four heavy metals at the four sites were generally greater than their corresponding background levels in Guangdong (17mgkg–1 for Cu, 0.06mgkg–1 for Cd, 36mgkg–1 for Pb and 47.3mgkg–1 for Zn; Soil General Survey Office of Guangdong Province 1993), and much greater than their corresponding average contents in the paddy soils of the PRD (Wong et al. Reference Wong, Li, Zhang, Qi and Min2002). Moreover, the average contents of the four metals were greater than their corresponding threshold levels (indicated by the red dotted lines in Fig. 2) as regulated by the China Environmental Quality Standards for Soil (GB15618-1995, grade II for agricultural land). The Cd contents in all of the soil samples exceeded the threshold level (0.3mgkg–1), with the average contents at FG, DB, SD and LC being 10.27, 6.03, 6.27 and 13.6 times higher than the threshold, respectively. Overall, the results indicated that Cu, Cd, Pb and Zn had accumulated in the paddy soils at all four sites.
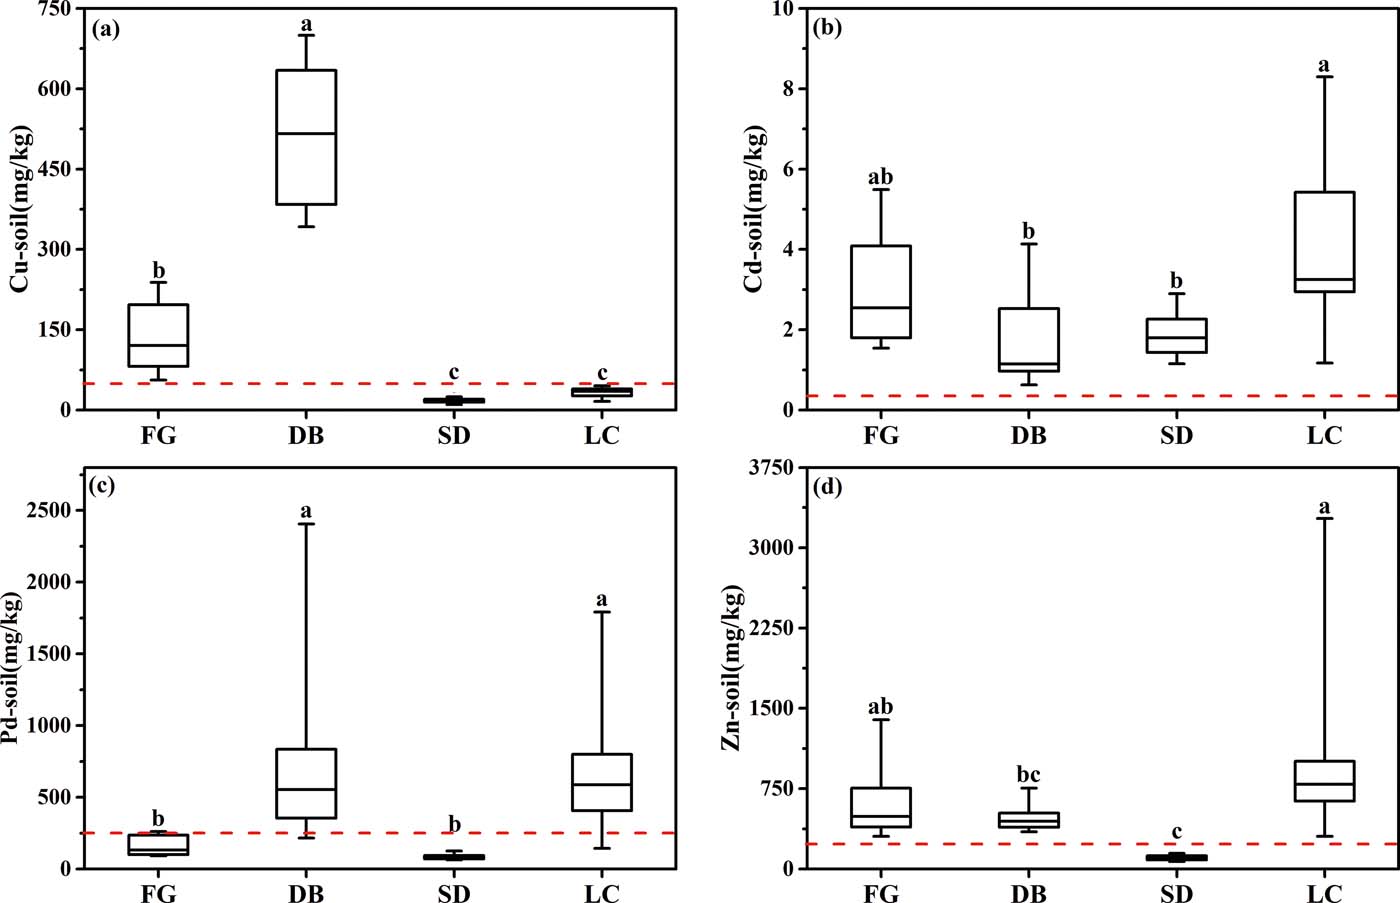
Figure 2 Boxplots of the heavy metal concentrations in the soils from the four sampling sites. (a) Cu contents in soil. (b) Cd contents in soil. (c) Pd contents in soil. (d) Zn contents in soil. Abbreviations: FG = Fogang site; DB = Dabao Mountain site; SD = Shaoguan site; LC = Lechang site; Cu = copper; Cd = cadmium; Pb = lead; Zn = zinc.
Correlation matrices of the four heavy metals at the sampling sites are presented in Table 2. Significant relationships between Cu, Cd, Pb and Zn at the FG site and the SD site were obtained, indicating that the contaminants might have originated from a common source (Rahman et al. Reference Rahman, Khanam, Adyel, Islam, Ahsan and Akbor2012). The metal composition of the SD soil was comparable to that of fly ash from a thermal power plant (Fernandez-Turiel et al. Reference Fernandez-Turiel, de Carvalho and Cabanas1994). This suggested the SD power plant as a likely source of the metals. The results exhibited a significant correlation between Cu and Pb at the DB site, indicating that Cu and Pb might have originated from a similar source. The average contents of Cu (512.64mgkg–1) and Pb (824.39mgkg–1) at DB were, respectively, 10.25 and 3.30 times higher than their corresponding threshold levels (Fig. 2), indicating a strong influence of mining at DB on the surrounding agricultural paddy soils. This is consistent with previous findings (Li et al. Reference Li, Becquer, Dai, Quantin and Benedetti2009a, Reference Li, Rouland, Benedetti, Li, Pando, Lavelle and Daib; Zhuang et al. Reference Zhuang, McBride, Xia, Li and Li2009). Most of the soil samples from the DB site were collected from fields close to the Hengshi River. Cu and Pb are the major heavy metals in the acid mine drainage from the DB mine (Zhuang et al. Reference Zhuang, McBride, Xia, Li and Li2009; Zhuang et al. Reference Zhuang, Zou, Xia and Wang2013). The fields were frequently irrigated with river water that was contaminated with acid mine drainage from the mining field, thus causing high Cu and Pb contents in DB. At the LC Pb/Zn mine site, the highest average contents of Cd (4.08mgkg–1) and Zn (1035.18mgkg–1) were found in the soil (Fig. 2). A significant correlation was found between Pb and Zn, and between Cd and Pb or Zn, while no relationship was found between Cu and Cd or Zn. The metal concentrations and their correlations reflect the significant impact of mining and power industry activities in the heavy metal pollution of the surrounding soils.
Table 2 Correlation (Pearson) coefficient matrices between the heavy metal concentrations in soils from the four sampling sites. Abbreviations: FG=Fogang site; DB=Dabao Mountain site; SD=Shaoguan site; LC=Lechang site; Cu=copper; Cd=cadmium; Pb=lead; Zn=zinc.

* Correlation is significant at the 0.05 level.
** Correlation is significant at the 0.01 level.
2.2. Assessment of potential environmental risks
The pollution indices of the metals in the soils were calculated according to Eqs 1 and 2, and the metal pollution grades are shown in Table 3. Pi varied greatly between metals and sites. Only five Pi (31.25% of the entire sample set) were <1, while the majority were >1. The Cu, Pb and Zn at SD had Pi values<1 and, thus, are considered to have been at a safe level. For all the metals at DB, Pi > 1 and it was also found that P Cu > 10, indicating an extensive Cu/Cd/Pb/Zn multi-pollution at the sampling site. The PN values of FG, DB, SD and LC were 8.40, 9.10, 4.64 and 10.28, respectively, indicating serious pollution at all of the four sampling sites and a high potential risk from the rice grown at these sites.
Table 3 Soil heavy metal pollution indices for the four sampling sites. Abbreviations: FG=Fogang site; DB=Dabao Mountain site; SD=Shaoguan site; LC=Lechang site; Cu=copper; Cd=cadmium; Pb=lead; Zn=zinc.

1 Pi is the single-factor pollution index of metal i in soil.
2 PN is the Nemerow synthetic pollution index for all assessed samples.
3 Grade of pollution is the classification criterions for pollution index of soil environmental quality.
2.3. Heavy metal concentrations in rice plants
The distributions of heavy metal concentrations in different tissues of rice plants are shown in Fig. 3. Significantly higher concentrations of the heavy metals were found in the roots, indicating that translocation from soil is the main pathway for heavy metal uptake by rice. Compared to heavy metal content in the roots, the corresponding heavy metal concentrations in the grains were significantly less, which is consistent with the findings from a previous study in Nanjing, China (Lu et al. 2003). This suggests that only a minor fraction of the metals present in the soil was transferred to the cereal grains. The concentrations of Cu, Cd, Pb and Zn in the rice tissues were, in general, in the order of stem > leaf > grain. One exception was at SD, where the concentrations of Cu and Cd in the grain were greater than their corresponding concentrations in the stem and leaf. A similar exception was found for Cu at LC. The correlation analysis (Table 2) suggests that Cu at LC was likely derived from a different source relative to the other three metals, and atmospheric deposition was the likely alternative pathway for heavy metals to enter rice.

Figure 3 Boxplots of the heavy metal concentrations in the rice organs (root, stem, leaf and grain) from the four sampling sites. Abbreviations: FG = Fogang site; DB = Dabao Mountain site; SD = Shaoguan site; LC = Lechang site; Cu = copper; Cd = cadmium; Pb = lead; Zn = zinc.
As shown in Figure 3, the metal concentrations in rice roots differed significantly among the four sites. The greatest average concentrations of Cu and Zn were 76.82 and 528.94mgkg–1, respectively, which were at the FG Pb/Zn mine site. The greatest average concentration of Cd (6.99mgkg–1) was at SD, and Pb (372.83mgkg–1) at LC. There were significant differences between FG, DB, SD and LC in the metal concentrations in stems and leaves. The greater Cu, Cd and Pb concentrations in the above-ground rice tissues at SD might have been partially caused by atmospheric particles from the nearby power plant. Qiu et al. (Reference Qiu, Guan, Song and Huang2009) show that the concentrations of Cu (914.6mgkg–1), Cd (12.8mgkg–1) and Pb (184.0mgkg–1) were high in foliar dust near a coal-fired power station in Huizhou, Guangdong.
The heavy metal concentrations in the grains were much less than their corresponding concentrations in the roots and stems. However, they still exceeded their corresponding food safety limits. The maximum allowable levels (MAL) defined by the Ministry of Health of China are 10mgkg–1 for Cu (GB 15199-94), 0.2mgkg–1 for Cd (GB 2762-2012), 0.2mgkg–1 for Pb (GB 2762-2012) and 20mgkg–1 for Zn (GB 13106-91). The average concentrations of Cu, Cd, Pb and Zn at the four sites were 2.23, 10.98, 29.84 and 1.62 times their corresponding MALs. It is worth noting that hazardous Cd and Pb concentrations in the grain from the four sites all exceeded the limits. For Cu and Zn, the majority (83.33 % and 88.89 %, respectively) of the samples had contents greater than the corresponding MALs. Moreover, the contents of all four metals in rice at FG exceeded the corresponding MALs. In summary, the data indicate that rice grains from the four sites were heavily contaminated by the four metals, meaning there was a potential health risk to humans.
2.4. Heavy metal transfer from soils to rice plants
Metal transfer from soils to plants is an important first step for metals entering humans. Metals with high TFs are more easily transferred from soils to edible plant parts than those with low TFs (Bošković-Rakočević et al. Reference Bošković-Rakočević, Milivojević, Milošević and Paunović2014). The Pearson coefficient matrices (see supplementary Tables 1–4 available at https://doi.org/10.1017/S1755691018000646) show that metals in roots correlate with metals in soils at FG, DB and LC, and the metals in grain correlate with metals in leaves at all sites. Additionally, the results of PCA demonstrate that TFsoil-grain of Pb, Cu and Cd were closely associated in first principal components (PC1), suggesting that the distribution of heavy metals of rice plants at SD leading to the differentiation of SD region and the other three regions (Fig. 4). This fact, together with the high correlation between the heavy metals in soils at SD (Table 2), the lack of significant correlation between the total Cu, Cd, Pb and Zn contents in soil, and their corresponding contents in roots (supplementary Table 3), supports the hypothesis that heavy metals in grain at the SD power plant site were largely affected by atmospheric deposition. This could result in a substantial increase in the TFs of the four metals at SD relative to those at the other sites. As a consequence, the TF values of the SD samples are not included in the following discussion.

Figure 4 Principal component analysis of the total heavy metal concentrations, other properties of the soils, and the soil-to-grain transfer factors. (a) Loading plot of PC1 and PC2. (b) Score plot of four sampling sites. Abbreviations: FG = Fogang site; DB = Dabao Mountain site; SD = Shaoguan site; LC = Lechang site; Cu = copper; Cd = cadmium; Pb = lead; Zn = zinc; TF = transfer factor; TOC = total organic carbon.
The TF values of the metals at the sampling sites are shown in Table 4. The TFsoil-root values of Cd were significantly greater than other TFs, and TFroot-grain and TFsoil-grain values of Cu, Cd and Zn were comparable and much greater than those for Pb. This infers that Cd had the greatest bioavailability, based on metal uptake by roots, and Pb had the least bioavailability because of the lowest translocation from root to grains at these sites, although the soil Pb content was much greater than the soil Cd content (Fig. 2). The TFsoil-root and TFroot-grain of Cd highlight that Cd was translocated from soil to grains. This is consistent with previous studies showing that Cu and Cd are transported easily into the edible parts of plants (Kirkham Reference Kirkham2006; Gimbert et al. Reference Gimbert, Mench, Coeurdassier, Badot and de Vaufleury2008), whereas Pb accumulates mainly in plant roots (Yoon et al. Reference Yoon, Cao, Zhou and Ma2006). This may be related to the mechanisms of Cd2+ translocation from roots to shoots via Ca channels (Mark Reference Mark1990; Kim et al. Reference Kim, Yang and Lee2002) and endogenous Zn transporters by active transport (Pence et al. Reference Pence, Larsen, Ebbs, Letham, Lasat, Garvin, Eide and Kochian2000; Uraguchi & Fujiwara Reference Uraguchi and Fujiwara2012). Pb precipitation in cell walls can decrease Pb transport from stem to grain (Liu et al. Reference Liu, Mei, Cai and Wang2015).
Table 4 The transfer factors (TFs) of the heavy metals in soil–plant systems from the four sampling sites. Abbreviations: FG=Fogang site; DB=Dabao Mountain site; SD=Shaoguan site; LC=Lechang site; Cu=copper; Cd=cadmium; Pb=lead; Zn=zinc.

1 The values shown are mean±standard deviation. Different letters in the same column denote significant differences (P<0.05).
The TFsoil-root values of Cu, Cd, Pb and Zn from FG were greater than DB and LC. Heavy metal uptake by food crops depends on soil physicochemical characteristics and plant species (Luo et al. Reference Luo, Liu, Wang, Liu, Li, Zhang and Li2011). The average soil pH at FG was 4.79, significantly lesser than those at SD and LC. The average soil OC content at FG was substantially greater than those at the other sites (Table 1). Soil pH and OC content are believed to be the two important factors governing heavy metal mobility and bioavailability (Zeng et al. Reference Zeng, Ali, Zhang, Ouyang, Qiu, Wu and Zhang2011). Soil pH has a great influence on the solubility and speciation of metals, and thus metal movement in soils (Muehlbachova et al. Reference Muehlbachova, Simon and Pechova2005). A higher soil pH could reduce the bioavailability of heavy metals in the soil solution, while a lower pH releases ‘soil-bound' metal ions into the soil solution (Wang et al. Reference Wang, Angle, Chaney, Delorme and Reeves2006a, Reference Wang, Su, Chen, Lin, Luo and Gaob). Soil organic matter, especially fulvic acid, can chelate with metals and increase metal bioavailability to plants (Hettiarachchi et al. Reference Hettiarachchi, Ryan, Chaney and La Fleur2003). Organic matter provides organic chemicals to the soil solution, causing metal bioavailability to increase through organic matter chelation (Vega et al. Reference Vega, Covelo, Andrade and Marcet2004). The results suggest that metals at the four sites and their surrounding areas are being transferred to rice grains, making the contaminated areas unsuitable for rice.
2.5. DIM through food chain and human health risk
The daily intake of heavy metals was estimated based on average rice consumption. The HRI is a useful index for the evaluation of risk associated with the consumption of metal-contaminated foods (Cao et al. Reference Cao, Duan, Zhao, Ma, Dong, Huang, Sun, He and Wei2014). The DIMs and HRIs of the metals via rice consumption for both adults and children are shown in Table 5. DIM values show that humans at the FG site had the greatest intake of Cu and Zn through rice, and people at the SD site had the greatest intake of Cd and Pb through rice. The total intake of the four metals via rice at DB and LC were less than at other sites. Almost all HRI values were greater than 1, except for Zn at DB and LC, and all heavy metal HRI values for children were higher than those for adults at the four sites. This indicates that the local residents at the four sites were subject to serious health risks from heavy metals, with children being at a greater risk than adults despite the lesser consumption rates for children.
Table 5 The daily intake (DIM), estimated daily exposure (EDEM) and health risk index (HRI) of the heavy metals at the four sampling sites. Abbreviations: FG=Fogang site; DB=Dabao Mountain site; SD=Shaoguan site; LC=Lechang site.

The HRI values of Cu, Cd, Pb and Zn at the four sites ranged from 3.28 to 4.57, 5.23 to 35.98, 3.08 to 13.97 and 0.81 to 2.21, respectively, for adults, while the values ranged from 3.54 to 4.94, 5.65 to 38.89, 3.33 to 15.10 and 0.87 to 2.39, respectively, for children. The potential health risks of Cu, Cd and Pb were greater compared to that of Zn. Cd had relatively greater HRIs compared to the other metals, with the greatest values of 38.89, 13.87, 9.28 and 5.65 at SD, FG, DB and LC, respectively, for children. Pb and Cd are regarded as potential carcinogens and are associated with serious systemic health problems, such as cardiovascular, kidney as well as blood diseases (Komarnicki Reference Komarnicki2005; Pruvot et al. Reference Pruvot, Douay, Herve and Waterlot2006). If soils and dusts from a smelter are ingested, Pb can dissolve in the stomach, potentially causing a blood disease (Bosso & Enzweiler Reference Bosso and Enzweiler2008). An excessive risk of cardiovascular mortality in Cd-exposed inhabitants and a moderate relationship between the contents of Cu and Cd in soil and cardiovascular morbidity in adolescence have been reported (Nishijo et al. Reference Nishijo, Nakagawa, Morikawa, Tabata, Senma, Miura, Takahara, Kawano, Nishi, Mizukoshi and Et1995; Kharlamova & Val'Tseva Reference Kharlamova and Val'Tseva2014). In general, the results show that Cd was the most hazardous metal among the studied metals for both adults and children.
For both adults and children, the Cd HRI values at the four sites were in the decreasing order of SD > FG > DB > LC, and the Pd HRI values at the four sites were in the decreasing order of SD > LC > FG > DB. The SD power plant site had the highest HRI values for Cd and Pb, although its metal pollution levels in the soil were low. The atmospheric deposition of heavy metals from the power plant at SD was likely to be responsible for the potential risk to rice consumption. Compared with the findings of studies on farmland (Chen et al. Reference Chen, Teng, Lu, Wang and Wang2015) and near mining (Liu et al. Reference Liu, Zhang, Tran, Wang and Zhu2011; Ackah et al. Reference Ackah, Anim, Gyamfi, Zakaria, Hanson, Tulasi, Enti-Brown, Saah-Nyarko, Bentil and Osei2014), the HRI values for adults and children through rice consumption in this study were markedly higher. Cu HRI values at the four sites were in the decreasing order of FG > SD > LC > DB, and the Zn HRI values at four sites were in the decreasing order of FG > SD > LC > DB. The highest HRI values for Cu and Zn were obtained at the FG Pb/Zn mine site. As Cd and Pb are more hazardous than Cu and Zn, it is expected that inhabitants close to the SD site would be experiencing relatively greater health risks than other sites, as indicated by the high HRI values for Cd and Pb.
3. Conclusions
In this study, untreated or poorly treated effluents and wastes from mining factories and unrestrained gas emissions from the power plant lead to the accumulation of Cu, Cd, Pb and Zn in the paddy soils of the NRB, South China. The average contents of the four metals were greater than their corresponding threshold levels, indicating serious multi-pollution at the sampling sites. Rice tended to take up heavy metals from soil and through atmospheric deposition. The metal contents in the rice grains commonly exceeded the permissible food guideline limits in China, and posed a great health risk to the local population. The HRIs of the metals at the four sites confirmed that ingestion of the contaminated rice was unsafe, children facing a greater risk than adults. Of the four heavy metals, Cd was more easily transferred from soil to rice, and was the most hazardous metal for both adults and children. The SD power plant site posed the greatest risk, as indicated by the HIR values of Cd and Pb. The atmospheric deposition of heavy metals from the SD power plant is likely to have been responsible for the potential risk, although its metal pollution levels in soil were small. Effective measurement is needed to manage and remediate the toxic metals in the NRB.
4. Acknowledgements
This work was financially supported by the National Natural Science Foundation of China (project numbers U1401234, 41271266 and 41401249), the National Science and Technology Support Program (2015BAD05B05) and the National Environmental Protection Special Project (201509032). The authors would like to thank the anonymous reviewers for their helpful comments and suggestions.
5. Supplementary material
Supplementary material is available online at https://doi.org/10.1017/S1755691018000646.


