The Diagnostic and Statistical Manual of Mental Disorders (DSM–5) (5th ed., American Psychiatric Association, 2013) describes Obsessive-Compulsive Disorder (OCD) as a mental disorder characterized by the presence of obsessions and/or compulsions. Obsessions are recurrent and persistent thoughts, urges or images that person recognizes unwanted, inappropriate and intrusive, it causes marked anxiety or distress. Compulsions are repetitive behaviors or mental acts that the person performs in response to an obsession or certain rules, to prevent or reduce anxiety, distress or avoid some negative event; however, these behaviors are not connected proportionally with what they want to neutralize. Prevalence of OCD across countries ranges from 1.1 to 1.8%, and it is more common in males than in females in childhood, but more females than males are affected in adulthood (Kessler, Petukhova, Sampson, Zaslavsky, & Wittchen, Reference Kessler, Petukhova, Sampson, Zaslavsky and Wittchen2012; Somers, Goldner, Waraich, & Hsu, Reference Somers, Goldner, Waraich and Hsu2006).
The Padua Inventory (PI) of Sanavio is one of the measurement instruments most widely used to assess obsessive-compulsive symptoms (Sanavio, Reference Sanavio1988). The PI consists of 60 self-report items describing common obsessional and compulsive behavior and each item is rated on a 5-point scale to measure disturbance associated with OCD symptoms (0 = not at all, 1 = a little, 2 = quite a lot, 3 = a lot and 4 = very much). The PI has four subscales: Impaired Mental Control (17 items), Contamination (11 items), Checking (8 items), and Urges and Worries (7 items), so that several items do not belong to any of these four subscales. Higher scores indicate greater severity of OCD. Originally, the PI was developed in Italian language and it has been translated and adapted to various languages and cultures: Netherlands (van Oppen, Reference van Oppen1992), Argentina (Chappa, Reference Chappa1998), United Kingdom (Macdonald & de Silva, Reference Macdonald and de Silva1999), Japan (Sugiura & Tanno, Reference Sugiura and Tanno2000), Spain (Mataix-Cols, Sànchez-Turet, & Vallejo, Reference Mataix-Cols, Sànchez-Turet and Vallejo2002), Turkey (Beşiroğlu et al., Reference Beşiroğlu, Ağargün, Boysan, Eryonucu, Güleç and Selvi2005), and Iran (Goodarzi & Firoozabadi, Reference Goodarzi and Firoozabadi2005). All these adaptations are composed of 60 items, although the factorial structure of some of them is different to the original PI.
A number of shorter versions of the PI can also be found in the literature. This is the case of the Padua Inventory Revised (PI-R) developed by van Oppen, Hoekstra, and Emmelkamp (Reference van Oppen, Hoekstra and Emmelkamp1995), which consists of 41 items and five subscales adapted to Dutch language (e.g., Kadak, Balsak, Besiroglu, & Çelik, Reference Kadak, Balsak, Besiroglu and Çelik2014; Sarısoy, Terzi, Gümüş, & Pazvantoğlu, Reference Sarısoy, Terzi, Gümüş and Pazvantoğlu2013), and the Padua Inventory-Washington State University Revision (PI-WSUR), developed by Burns, Keortge, Formea, and Sternberger (Reference Burns, Keortge, Formea and Sternberger1996), which is composed of 39 items and five subscales adapted to English (e.g., Vaccaro, Jones, Menzies, & Wootton, Reference Vaccaro, Jones, Menzies and Wootton2014; Zetsche, Rief, Westermann, & Exner, Reference Zetsche, Rief, Westermann and Exner2015).
Besides the existence of shorter versions, the original PI is currently being used in research on OCD. Thus, this investigation focused on the original PI developed by Sanavio (Reference Sanavio1988). In his original study, Sanavio applied the PI to a community sample, finding internal consistencies for males and females of .90 and .94, respectively. Furthermore, the PI was applied to an undergraduate sample to estimate test-retest reliability within 30 days, obtaining test-retest correlations of .78 and .83 for males and females, respectively. To our knowledge, 14 additional psychometric studies of the PI have been published in different cultures and languages maintaining the original 60 items (Beşiroğlu et al., Reference Beşiroğlu, Ağargün, Boysan, Eryonucu, Güleç and Selvi2005; Goodarzi & Firoozabadi, Reference Goodarzi and Firoozabadi2005; Ibáñez, Olmedo, Peñate, & González, Reference Ibáñez, Olmedo, Peñate and González2002; Kyrios, Bhar, & Wade, Reference Kyrios, Bhar and Wade1996; Macdonald & de Silva, Reference Macdonald and de Silva1999; Mataix-Cols et al. Reference Mataix-Cols, Sànchez-Turet and Vallejo2002; Novy, Stanley, Averill, & Daza, Reference Novy, Stanley, Averill and Daza2001; Stanley, Beck, & Zebb, Reference Stanley, Beck and Zebb1996; Sternberger & Burns, Reference Sternberger and Burns1990; Sugiura & Tanno, Reference Sugiura and Tanno2000; Van Oppen, 1992; Wakabayashi & Aobayashi, Reference Wakabayashi and Aobayashi2007; Williams & Turkheimer, Reference Williams and Turkheimer2007; Williams, Turkheimer, Schmidt, & Oltmanns, Reference Williams, Turkheimer, Schmidt and Oltmanns2005). Their results offered good internal consistency (coefficients α ranging .91 – .98 for the total scale and .57 – .95 in the subscales) and test-retest reliability (rs ranging .71 – .92 for the total scale and .60 – .90 in the subscales). Nonetheless, these studies also evidence notable fluctuations in the reliability estimates depending on the composition and variability of the samples. In addition, it is not clear whether the large number of different adaptations of the PI to other languages and cultures exhibit similar reliability estimates from the test scores.
Reliability of psychological tests depends on the sample on which they are applied and, therefore, it is not an inherent property of the test. This is because reliability of test scores is a function of the composition and characteristics of the samples of participants and the application context (Crocker & Algina, Reference Crocker and Algina1986; Lord & Novick, Reference Lord and Novick1968; McDonald, Reference McDonald1999; Streiner & Norman, Reference Streiner and Norman2008). As reliability varies in each test administration, researchers should report the reliability obtained for the data at hand. However, it is very common to find researchers inducing score reliability of the PI from previous administrations of the test to other samples. Reporting reliability with the own data is important because reliability affects the effect size and statistical power of significance tests. Therefore, reliability induction is an erroneous practice that must be avoided, not only when applying the PI, but also for any other measurement instrument (Henson & Thompson, Reference Henson and Thompson2002).
Two kinds of reliability induction can be distinguished when researchers do not report a reliability estimate of test scores from their sample (Shields & Caruso, Reference Shields and Caruso2004). First, reliability induction ‘by report’ occurs when the study reports a reliability estimate from previous studies (e.g., in the original validation of the test the coefficient α was .8). Second, reliability ‘by omission’ occurs when researchers fail to provide any reference to the reliability of the test scores, which can indicate either that reliability was not adequately considered or that it is assumed that the scores will have adequate reliability because that was the case in previous applications of the instrument (Deditius-Island & Caruso, Reference Deditius-Island and Caruso2002).
Since reliability changes from a test application to the next, meta-analysis is a very useful methodology to statistically integrate the reliability estimates obtained in different applications of a test. In this vein, Vacha-Haase (Reference Vacha-Haase1998) coined the term the reliability generalization (RG) to refer to this kind of meta-analysis. An RG study enables us to: (a) obtain an average estimate of the score reliability of the test, (b) determine whether the reliability coefficients obtained across different test applications are heterogeneous and, (c) examine which characteristics of the test, of the studies and of the participants can account for that heterogeneity (Henson & Thompson, Reference Henson and Thompson2002; Rodriguez & Maeda, Reference Rodriguez and Maeda2006; Sánchez-Meca, López-López, & López-Pina, Reference Sánchez-Meca, López-López and López-Pina2013).
An RG meta-analysis of the empirical studies that applied the Padua Inventory (Sanavio, Reference Sanavio1988) was accomplished in order to: (a) estimate the reliability induction rates of the PI; (b) with the aim to examine the generalizability of our results, the characteristics of the studies that induced reliability were compared to those that reported reliability estimates; (c) estimate the average reliability (for the total scale and subscales), in terms of internal consistency and test-retest reliability; (d) examine the variability among the reliability estimates; (e) search for substantive and methodological characteristics of the studies that can be statistically associated to the reliability coefficients; and (f) propose a predictive model that researchers and clinicians can use in the future to estimate the expected reliability of the PI scores as a function of the most relevant study characteristics.
Method
Selection criteria of the studies
To be included in the meta-analysis, each study had to fulfill the following criteria: (a) to be an empirical study where the Sanavio’s (1988) original version of the Padua Inventory, or an adaptation of the original version maintaining the 60 items, was applied; (b) to use a sample of at least 10 participants; (c) to report any reliability estimate based on the study-specific sample; (d) the paper had to be written in English, French or Spanish; (e) samples of participants from any target population were accepted (community, clinical or subclinical populations); and (f) the paper might be published or unpublished. In order to be as comprehensive as possible, both published and unpublished studies were accepted. For the studies that induced reliability, the selection criteria were the same with the exception of (c).
Searching for the studies
As the Padua Inventory was developed in 1988, the search period of the relevant studies covered from 1988 to December 2015, both included. The following databases were consulted: PROQUEST, PUBMED, and Google Scholar. In the electronic searches, the keyword “Padua Inventory” was used to be found in the full-text of the documents. In addition, the references of the studies retrieved were also checked in order to identify additional studies that might fulfill the selection criteria.
Data extraction
To explore how study characteristics can affect score reliability, a protocol was produced with guidelines on how to code substantive, methodological, and extrinsic characteristics of the studies. The following substantive variables were coded: mean and standard deviation (SD) of the total score of the PI as well as of each of the four original subscales, mean and SD of the age (in years), gender distribution of the sample (% male), sample ethnicity (% Caucasian), mean and SD of the duration of the disorder (in years, for clinical samples only), target population (community, undergraduate students, subclinical, and clinical), percentage of clinical participants in the sample, type of clinical disorder (OCD vs. other; for clinical samples only), and geographic location of the study (country and continent). Regarding methodological characteristics, the following were extracted: test version (Italian original vs. other), administration format (clinical interview vs. self-reported), study focus (psychometric vs. applied), focus of the psychometric study (PI vs. other scale), diagnostic procedure of the participants (DSM, ICD, other), sample size, and time interval (in weeks) for test-retest reliability. Two additional extrinsic variables were also coded: year of the study and training of the main researcher (psychology, psychiatry, other). Alongside these moderator variables, alpha and test-retest coefficients were extracted for the total scale and for the subscales when these were reported in the studies.
The protocol for extracting the study characteristics was applied not only for studies that reported any sample-specific reliability estimate, but also to those that induced it. The reason for extracting data from studies that induced reliability was to achieve our objective of examining whether the characteristics of the studies that reported reliability were similar to those that induced it. This comparison was critical to determine the extent to which the results of our meta-analysis (based only on studies that reported reliability) can be generalized to a larger population of studies composed of all studies that have applied the PI, regardless of whether or not they induced reliability.
To examine the reliability of the coding process of the study characteristics, all studies that had applied the PI were doubly coded by two independent raters, all of them with a PhD in psychology and specialized in meta-analysis. Cohen’s kappa coefficients were calculated to assess inter-rater agreement for qualitative characteristics and intraclass correlations for continuous ones. This reliability analysis of the coding process was based on the 187 studies (295 independent samples) that applied the PI. The results were highly satisfactory overall, with kappa coefficients ranging between .98 and 1.0 (M = .99) for qualitative characteristics, and intraclass correlations ranging between .95 and 1.0 (M = .998) for the continuous variables. The inconsistencies between the raters were resolved by consensus.
Reliability estimates
In this meta-analysis, two types of reliability coefficients were taken into account: coefficients alpha to assess internal consistency of the measures, and Pearson correlation coefficients to estimate test-retest temporal stability. In addition, these two types of reliability coefficients were extracted for the PI total score and for each one of the four subscales. Thus, a total of 10 reliability coefficients might be obtained from each study. To carry out the meta-analysis, coefficients alpha, (
 ${{\rm{\hat{\alpha }}}_i}$
), were treated in two ways: as untransformed coefficients alpha and by transforming them with the formula proposed by Bonett (Reference Bonett2002). Pearson correlation coefficients, r, to assess test-retest reliability were transformed into the Fisher’s Z in order to normalize its distribution and stabilize their variances.
${{\rm{\hat{\alpha }}}_i}$
), were treated in two ways: as untransformed coefficients alpha and by transforming them with the formula proposed by Bonett (Reference Bonett2002). Pearson correlation coefficients, r, to assess test-retest reliability were transformed into the Fisher’s Z in order to normalize its distribution and stabilize their variances.
Statistical analysis
Separate meta-analyses were conducted for coefficients alpha and for test-retest reliability coefficients. In addition, separate meta-analyses were conducted for the reliability coefficients obtained from the total scale and for each of the four subscales. Thus, a total of 10 meta-analyses were accomplished. In all cases, random-effects models were assumed in the statistical calculations (Borenstein, Hedges, Higgins, & Rothstein, Reference Borenstein, Hedges, Higgins and Rothstein2009; López-López, Botella, Sánchez-Meca, & Marín-Martínez, Reference López-López, Botella, Sánchez-Meca and Marín-Martínez2013; Sánchez-Meca et al., Reference Sánchez-Meca, López-López and López-Pina2013). In each meta-analysis, an average reliability coefficient and a 95% confidence interval were calculated with the improved method proposed by Hartung (Sánchez-Meca & Marín-Martínez, Reference Sánchez-Meca and Marín-Martínez2008).
In each meta-analysis, the heterogeneity of the reliability coefficients was investigated by constructing a forest plot and by calculating the Q statistic and the I 2 index. I 2 values about 25%, 50%, and 75% can be interpreted as reflecting low, moderate, and large heterogeneity (Higgins, Thompson, Deeks, & Altman, Reference Higgins, Thompson, Deeks and Altman2003). When reliability coefficients exhibited heterogeneity, then moderator analyses were performed in order to identify the study characteristics statistically associated to reliability. Weighted ANOVAs and meta-regressions assuming a mixed-effects model were applied for qualitative and continuous moderators, respectively, with the improved method proposed by Knapp and Hartung (Reference Knapp and Hartung2003; see also López-López et al., Reference López-López, Botella, Sánchez-Meca and Marín-Martínez2013; Viechtbauer, López-López, Sánchez-Meca, & Marín-Martínez, Reference Viechtbauer, López-López, Sánchez-Meca and Marín-Martínez2015). Mixed-effects models constitute a suitable approach when the researchers anticipate a large heterogeneity in the composition and variability of the samples and application contexts (Borenstein et al., Reference Borenstein, Hedges, Higgins and Rothstein2009). All statistical analyses were carried out with the programs Comprehensive Meta-analysis 3.0 (Borenstein, Hedges, Higgins, & Rothstein, Reference Borenstein, Hedges, Higgins and Rothstein2014) and metafor in R (Viechtbauer, Reference Viechtbauer2010).
Results
Selection process and reliability induction
Figure 1 shows a flowchart describing the selection process of the studies. The search yielded a total of 1,079 references, out of which 892 were removed for different reasons. The remaining 187 references were empirical studies that had applied the original version of the PI. It is worth noting that almost 50% of the 187 studies (47%) that have applied the PI were published in the last 10 years, indicating that the PI is currently being applied. Out of the 187 references, 42 (22.5%) studies reported any estimate of the test scores reliability from their sample, whereas the remaining 145 (77.5%) induced reliability from other studies.
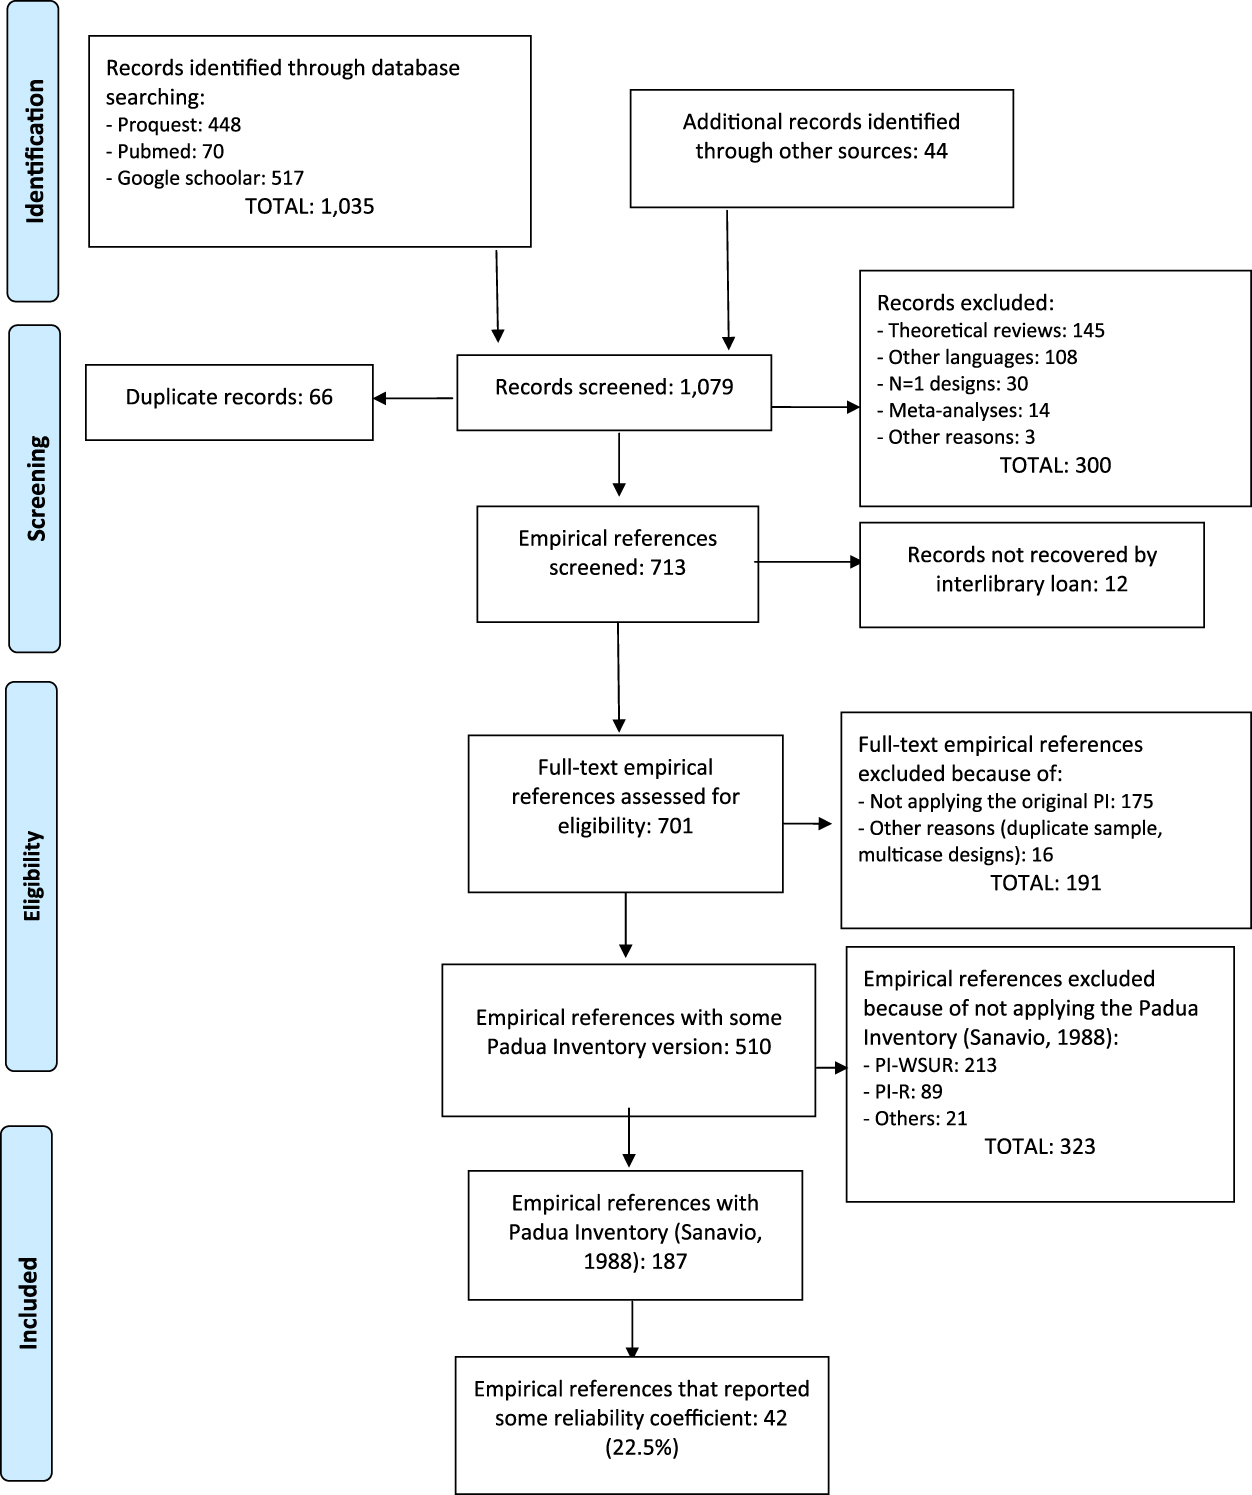
Figure 1. Flowchart of the selection process of the studies.
Out of the 145 studies that induced the reliability, 65 (44.8%) omitted any reference to the PI reliability (i.e., induction ‘by omission’), whereas the remaining 80 studies (55.2%) induced the reliability from previous studies (i.e., induction ‘by report’). In particular, of these 80 studies, 46 (31.7%) induced vaguely the reliability (not reporting specific estimates), and 34 (23.4%) induced the reliability accurately (i.e., reporting specific estimates from previous studies).
We also analyzed the change in the reliability induction rates as a function of the nature (psychometric versus applied), the continent where the study was conducted, and the publication year of the studies. Out of the 187 studies that had applied the PI, 15 were psychometric studies focused on the PI, 25 psychometric studies focused scales other than the PI, and the remaining 147 were applied studies. Only one study (6.7%) of the 15 psychometric studies about the PI, 72% of the other psychometric studies, and 87.5% of the applied studies induced the reliability. The differences among these percentages were statistically significant, χ2(2) = 49.344, p < .001. It is worth noting that a remarkably high percentage of the psychometric studies focused on another scale (72%) induced the reliability of the PI. Thus, not only the applied studies but also the psychometric ones mostly showed the erroneous practice of inducing reliability instead of estimating it with the data at hand. Only in the psychometric studies about the PI, the percentage of studies inducing the reliability was reasonably low (6.7%).
The percentages of studies inducing the reliability in the different continents were: 100% (South America, k = 3), 79.7% (North America, k = 79), 78.6% (Oceania, k = 28), 77.8% (Europe, k = 54), 68.2% (Asia, k = 22), and 0% (Africa, k = 2). These differences were not statistically significant, χ2(4) = 2.337, p = .647. Therefore, with the exception of Africa, the percentage of studies inducing the reliability was remarkably high regardless of their continent of origin.
A binary logistic regression model was fitted to determine if the publication year predicted the rates of the reliability induction. The covariate was the publication year and the dichotomous variable ─induction versus estimation with the data at hand of the reliability─ was the dependent variable. The Wald test for the covariate was 1.282 (p = .258), indicating a nonsignificant association between the variables.
A comparison between the characteristics of the studies inducing and reporting the reliability
The RG meta-analyses pursue to generalize their results to the population of empirical samples where the PI was applied. However, the analyses of an RG meta-analysis are performed with the studies where the reliability is estimated from the data in their respective samples. Then, the degree of generalization will depend on the similitude between the composition and variability of the samples that induce and those that report the reliability.
For each of the samples, the means and standard deviations of the PI Total scores, the age, the percentage of males, and the percentage of Caucasians, were registered. After grouping the samples into those inducing or reporting the reliability, the means of these data were computed. Then, t-tests were applied for comparing the means of both groups. The comparisons between studies that induced and reported reliability were conducted separately for studies with clinical and non-clinical samples.
Table 1 presents the results for the samples with non-clinical participants. Regarding the averages and standard deviations of the PI total score, the samples inducing the reliability showed means significantly lower than those in the samples reporting the reliability with the data at hand (p < .05). However, the differences between the means of the remaining factors (M age, SD of the percentage of males and percentage of Caucasians) were not statistically significant (p > .05).
Table 1. Results of Comparing the Means for Non-Clinical Samples that Induce and Report Reliability
Note: Means and standard deviations (in brackets) of the statistics computed in the samples inducing and reporting the reliability of test scores estimated with the data at hand. n I and n R = sample sizes of both types of samples. t = t-test for comparing two means. p = probability level associated to the t-test. d = standardized mean difference.
Table 2 presents the results for the samples of clinical participants, with different disorders such as OCD, depression, anxiety, eating disorders, pathological gambling, etc. With the exception of the mean age (p = .018) and, marginally, the standard deviation of the PI total score (p = .051), the other factors did not show statistically significant differences between the samples inducing and reporting the reliability (p > .05). Note that the means of the PI total score were larger than those in Table 1.
Table 2. Results of Comparing the Means for Clinical Samples that Induce and Report Reliability
Note: Means and standard deviations (in brackets) of the statistics computed in the samples inducing and reporting the reliability of test scores estimated with the data at hand. n I and n R = sample sizes of both types of samples. t = t-test for comparing two means. p = probability level associated to the t-test. d = standardized mean difference.
Mean reliability
Appendix A (see Supplementary file 1) presents the references of the 42 studies that reported some reliability estimate with the data at hand. Of the 42 studies, three of them (Cuttler & Graf, Reference Cuttler and Graf2009; McLaren & Growe, Reference McLaren and Crowe2003; Suzuki, Reference Suzuki2005) reported reliability in a form that did not enable us to include them in our RG study (e.g., reporting a range of coefficients α for the different subscales of the PI). Therefore, the remaining 39 studies that reported any reliability estimate were included in our RG meta-analysis, all of them published, with the exception of an unpublished Doctoral Thesis (Craig, 2014). Footnote 1
As several studies reported reliability coefficients for two or more different samples, a total of 53 independent samples composed the dataset in our RG study. The 53 independent samples summed in total 15,339 participants (min. = 19; max. = 1,855), with M = 289 participants per sample (Mdn = 203; SD = 320). Regarding the location of the studies, five continents were represented in our RG study: Europe (33.3%), North America (38.5%), Asia (12.8%), Oceania (12.8%), and Africa (2.6%). Out of the 39 reports, 37 were written in English (51 samples), one in Spanish (one sample), and another one in Japanese (one sample) Footnote 2 .
Table 3 presents the average coefficient alpha obtained for the total scores as well as for each subscale. The results are presented only for untransformed coefficients alpha, as transformed coefficients presented very similar results. Figure 2 presents a forest plot of coefficients alpha obtained with the PI Total scores for each study. The 39 samples that reported a coefficient alpha for the total scale ranged from .74 to .98, with a mean of .935, 95% CI [.922, .949]. Subscales exhibited lower average reliability coefficients than that of the total score, with Impaired Mental Control yielding the largest estimates (M = .911; range = .68 – .95), followed by Checking (M = .880; range = .66 – .94) and Contamination (M = .861; range = .73 – .96). Urges and Worries was the subscale with the poorest average reliability (M = .783; range = .60 – .92).
Table 3. Mean Coefficients Alpha, 95% Confidence Intervals, and Heterogeneity Statistics for the PI Total Score and the Four Subscales

Note: k = number of studies; α+ = mean coefficient alpha; LL and UL: lower and upper limits of the 95% confidence interval for α+; Q = Cochran’s heterogeneity Q statistic; Q statistic has k – 1 degrees of freedom. I 2 = heterogeneity index. **p < .001.
Figure 2. Forest plot displaying the coefficients alpha (and 95% confidence intervals) for the PI Total scores.
Table 4 presents the mean test-retest reliability obtained for the total score and the subscales. Very similar results were obtained with untransformed test-retest coefficients and with their Fisher’s Z transformations, hence we only display results for untransformed test-retest coefficients. Eleven studies reported test-retest coefficients for the total score that ranged from .71 to .93 with a mean of .835, 95% CI [.782, .877]. Figure 3 presents a forest plot of test-retest coefficients obtained with the PI Total score for each study.
Table 4. Mean Test-Retest Reliability Coefficients, 95% Confidence Intervals, and Heterogeneity Statistics for the PI Total Score and the Four Subscales
Note: k = number of studies. r + = mean test-retest reliability coefficient. LL and UL: lower and upper limits of the 95% confidence interval for r +. Q = Cochran’s heterogeneity Q statistic; Q statistic has k – 1 degrees of freedom. I 2 = heterogeneity index. **p < .001.

Figure 3. Forest plot displaying the test-retest reliability coefficients (and 95% confidence intervals) for the PI Total scores.
The time interval between test-retest administrations of the 11 studies that reported test-retest coefficients for the PI total score varied from 1.5 to 48 weeks, with a mean of 9.8 weeks (SD = 14.2). To test the existence of a statistical relationship between test-retest coefficients and time interval, a meta-regression was applied. The results showed an non-statistically significant relationship between them, b j = .0018; F(1,9) = 0.09, p = .792; R 2 = 0.
Out of the four subscales, Contamination exhibited the highest average test-retest reliability (M = .823; range = .76 – .90), followed by Impaired Mental Control (M = .771; range = .61 – .89), and Checking (M = .752; range = .65 – .90). Urges and Worries presented the poorest reliability (M = .739; range = .60 – .82).
Analysis of moderator variables
Alpha and test-retest coefficients presented a large heterogeneity, with I 2 indices over 80% in all cases. The large variability exhibited by the reliability coefficients obtained in different applications of the PI was investigated by analyzing the influence of potential moderator variables.
Due to the small number of studies that reported test-retest coefficients as well as coefficients alpha for the subscales, the analysis of moderator variables was performed with untransformed coefficients alpha for the total score only. Table 5 presents the results of the simple meta-regressions applied for each moderator variable. Out of the different moderators analyzed, only the standard deviation of test scores exhibited a positive, statistically significant relationship with coefficient alpha (p = .0005) and with a large percentage of variance accounted for of 46%. Figure 4 presents a scatter plot that illustrates the positive relationship found between the standard deviation of test scores and coefficients alpha. A marginally statistically significant result was also found for the percentage of clinical participants in the sample (p = .066) and with a 10% of variance accounted for. The positive sign of the regression coefficient for this moderator indicated larger coefficients alpha as the proportion of participants with some clinical disorder increased.
Table 5. Results of the Simple Meta-Regressions Applied on Coefficients Alpha for the Total Score, Taking Continuous Moderator Variables as Predictors
Note: k = number of studies. b j = regression coefficient of each predictor. F = Knapp-Hartung’s statistic for testing the significance of the predictor (the degrees of freedom for this statistic are 1 for the numerator and k – 2 for the denominator). p = probability level for the F statistic. Q E = statistic for testing the model misspecification. R 2 = proportion of variance accounted for by the predictor. ***p < .001.
Figure 4. Scatter plot of the SD of the PI Total scores on coefficients alpha.
Table 6 presents the results of the ANOVAs applied for qualitative moderator variables. It is worth noting the large number of different adaptations of the original PI (in Italian) to at least eight different languages and countries. The English adaptation of the PI was the most represented in these analyses, with 17 studies. Although no statistically significant differences were found among these versions of the PI (p = .262), when they were dichotomized in ‘original’ vs. ‘adapted’ versions, the average coefficient alpha obtained for the adapted versions (M = .947) was statistically larger (p = .002) than that of the original PI (M = .903), with a 32% of variance accounted for. No statistically significant differences were found between the average coefficients alpha for psychometric and applied studies (p = .395). However, when the psychometric studies were classified as a function of whether they were focused on the PI or on other scales, those focused on the PI exhibited an average coefficient alpha (M = .944) statistically larger (p = .032) that that of those focused on other scales (M = .897). No statistically significant differences were found when comparing the average coefficients alpha grouped by the target population (p = .082), although this moderator explained 15% of the variance among the coefficients. The studies with clinical samples exhibited the largest average coefficient alpha (M = .958), whereas community samples showed the lowest one (M = .910). Out of the eight clinical samples, three of them were composed of participants with various anxiety disorders (Novy et al., Reference Novy, Stanley, Averill and Daza2001, samples a and b; Stanley et al., Reference Stanley, Beck and Zebb1996), and the remaining five studies included participants with OCD (Bottesi, Ghisi, Ouimet, Tira, & Sanavio, Reference Bottesi, Ghisi, Ouimet, Tira and Sanavio2015, sample b), pathological gambling (Bottesi et al., Reference Bottesi, Ghisi, Ouimet, Tira and Sanavio2015, sample a), alcoholism (Bottesi et al., Reference Bottesi, Ghisi, Ouimet, Tira and Sanavio2015, sample c), anxiety and depression (Norman, Davies, Malla, Cortese, & Nicholson, Reference Norman, Davies, Malla, Cortese and Nicholson1996), and a mixture of patients with OCD, depression, and other anxiety disorders (Besiroglu et al., 2005). In addition, two studies that reported coefficients alpha for a mixture of patients with OCD and community participants (Lavoie, Sauvé, Morand-Beaulieu, Charron, & O’Connor, Reference Lavoie, Sauvé, Morand-Beaulieu, Charron, O’Connor and Kalinin2014; Scarrabelotti, Duck, & Dickerson, Reference Scarrabelotti, Duck and Dickerson1995) presented an average coefficient alpha of .945. The remaining qualitative moderator variables analyzed did not reach statistical significance.
Table 6. Results of the Weighted ANOVAs Applied on Coefficients Alpha for the Total Score, Taking Qualitative Moderator Variables as Independent Variables

Note: k = number of studies; α+ = mean coefficient alpha; LL and LU = lower and upper 95% confidence limits for α+; F = Knapp-Hartung’s statistic for testing the significance of the moderator variable; Q W = statistic for testing the model misspecification; R 2 = proportion of variance accounted for by the moderator.
An explanatory model
Although several moderator variables showed a statistically significant association with the untransformed alpha coefficients for the total scale, the Q E and Q W statistics presented in Tables 5 and 6 suggested that the residual heterogeneity was substantial in all models including a single moderator. As a further step, a multiple meta-regression was applied with the aim to identify the set of moderators accounting for most of the variability among the coefficients. The predictors included in the model were selected as a function of the results of the ANOVAs and simple meta-regressions previously conducted. Thus, three predictors were included in the model: the standard deviation of total test score, the test version (original vs. adapted), and the percentage of clinical participants in the samples. Due to missing data in some variables, the number of studies included in this meta-regression was k = 27. The results are shown in Table 7. The full model exhibited a statistically significant relationship with coefficient alpha (p = .0006), with a 58% of variance accounted for. Out of the three predictors of the model, two of them exhibited a statistically significant relationship with coefficient alpha once the influence of the other variables was controlled: the standard deviation of total test score (p = .027) and the test version (p = .039). Thus, coefficients alpha obtained in the studies were larger as the standard deviation increased and when adapted versions of the PI were used. The percentage of clinical participants in the samples did not reach statistical significance, once controlled the influence of the remaining predictors in the model (p = .382). This result was due to the collinearity between this variable and the standard deviation of test scores. In particular, the clinical samples exhibited larger standard deviations for the total scores (M = 38.52; see Table 7) than those for non-clinical ones (M = 26.44; see Table 6).
Table 7. Results of the Multiple Meta-Regression Applied on Coefficients Alpha for the Total Scores, Taking as Predictors the SD of Total Scores, the Test Version, and the Percentage of Clinical Participants in the Samples (k = 27)
Note: b j = regression coefficient of each predictor; t = statistic for testing the significance of the predictor (with 23 degrees of freedom); p = probability level for the t statistic; F = Knapp-Hartung’s statistic for testing the significance of the full model; Q E = statistic for testing the model misspecification; R 2 = proportion of variance accounted for by the predictors.
The multiple meta-regression obtained in our meta-analysis can be used to estimate the impact of reporting bias of the reliability on our results. The predictive model was (see Table 7) α’ = .903 + .001*SD of Total score + .0156*Test Version + .0001*% of clinical sample. It is possible to obtain reliability estimates for inducing and reporting studies, separately for clinical and non-clinical samples (100% and 0% in the predictive model, respectively), and assuming an adapted test version (Test Version = 1 in the predictive model). Thus, for clinical samples, taking the mean of the SD of test scores of reporting and inducing studies (M = 38.52 and 31.12, respectively), the predictive model offered an expected coefficient alpha of .967 and .960 for reporting and inducing studies, respectively. Regarding non-clinical samples, taking the mean of the SD of tests scores of reporting and inducing studies (M = 26.44 and 18.40, respectively), the predictions were .945 and .937, respectively.
Discussion
An RG meta-analysis was accomplished in order to investigate the reliability induction and to estimate the reliability of PI scores and to find characteristics of the studies able of explaining at least part of the variability exhibited by reliability coefficients obtained among the studies that have applied this test.
One of the criticisms against the RG meta-analyses is the extent to which their results can be generalized to all of the studies that have applied the test, regardless of having induced or not the reliability. The most worrying situation will take place when studies with low reliability for the test scores did not report it, in comparison with studies that reported reliability estimates with the data at hand. In that case, the results of the RG meta-analysis can be suffering the effects of the ‘reporting bias’ of the reliability, so that the average reliability of the test scores obtained in the meta-analysis will be an overestimation of the true average reliability (Sterne et al., Reference Sterne, Sutton, Ioannidis, Terrin, Jones, Lau and Higgins2011). Up to our knowledge, our RG meta-analysis is pioneer in applying a procedure to assess the generalizability of the results beyond the studies that reported reliability estimates with the data at hand. With this purpose, the composition and variability of the samples that reported reliability was compared with that of the samples that did not report (induced) reliability. These comparisons were accomplished separately for clinical and non-clinical samples. The results of our RG meta-analysis will be generalizable to inducing studies as long as both inducing and reporting studies used samples with similar composition and variability. Differences between the inducing and reporting samples were found, both for clinical and non-clinical populations. In particular, the samples that induced reliability presented lower standard deviations for the PI test score than those of reporting samples. As a consequence, it is expected that coefficients alpha for inducing samples will be lower than those of reporting ones. These results limit the generalization of our findings, but the predicted reliability with the multiple meta-regression model obtained in our meta-analysis was very similar for reporting and inducing studies. Thus, on a reasonable basis, we would conclude that the expected reliability of inducing studies seems to be close to that of reporting studies and that is very satisfactory (over the cut-point of .90 for clinical decisions) both for clinical and non-clinical samples.
Comparisons of the composition and variability of inducing and reporting studies should routinely be done in RG meta-analyses, as they allow assessing the potential impact of reporting bias of reliability on the meta-analytic results. Regardless of the results obtained in these comparative analyses, RG meta-analyses enhance the need for researchers to report their own reliability estimates and to abandon the malpractice of inducing it from previous applications of the test (Shields & Caruso, Reference Shields and Caruso2004; Thompson, Reference Thompson2003).
Internal consistency, by means of coefficients alpha, and temporal stability, by means of test-retest correlations, for PI total score and subscales were extracted from 52 samples in order to estimate the average reliability of test scores and to determine whether reliability can be generalized across different applications of the test to samples of different composition and variability. The large heterogeneity exhibited both by coefficients alpha and by test-retest correlations led us to conclude that reliability of the PI scores is not generalizable across applications and that it depends on characteristics of the studies and of the samples.
Several guidelines have been proposed in the psychometric literature to assess the adequacy and relevance of reliability coefficients (Charter, Reference Charter2003). In general, it is accepted that coefficients alpha must be over .70 for exploratory research, over .80 for general research purposes, and over .90 when the test is used for taking clinical decisions (Nunnally & Bernstein, Reference Nunnally and Bernstein1994). Based on these guidelines, the results of our RG meta-analysis lead us to conclude that, on average, internal consistency of PI total score (M = .935) is excellent both for research and clinical purposes. Out of the four subscales, Impaired Mental Control also fulfilled these guidelines (M = .911), whereas Contamination (M = .861) and Checking (M = .880) exhibited a good reliability for clinical purposes, and Urges and Worries presented a fair reliability (M = .783).
Regarding reliability as temporal stability, there is no consensus in the literature about guidelines for interpreting test-retest coefficients (Charter, Reference Charter2003). Using the benchmarks mentioned above for internal consistency, we would conclude that the average test-retest reliability for the PI total score (M = .835) fulfilled the threshold for research purposes and exhibited a good reliability for clinical purposes. Out of the PI subscales, only Contamination also exhibited a good average test-retest reliability (M = .823), the remaining subscales showing a fair reliability (M between .739 and .752).
The large heterogeneity exhibited among the reliability coefficients led us to search for moderator variables that can explain that variability. As expected from psychometric theory, the standard deviation of PI total scores exhibited a positive relationship with coefficients alpha, indicating that the larger the variability of test scores the larger the reliability estimate. In addition, the percentage of clinical participants in the samples also showed a positive and statistically significant relationship with coefficients alpha. However, this result was due to the collinearity between this variable and the standard deviation of test scores. As a consequence, the percentage of clinical participants in the samples did not offer a relevant contribution to the multiple meta-regression.
Another characteristic of the studies that exhibited a statistical relationship with coefficients alpha was the test version, distinguishing between the original (Italian) version of the PI (M = .903) and later adapted versions developed for different languages and countries (M = .947). In any case, it was evident that all versions of the PI exhibited average coefficients alpha over the cut-point of .90 to consider them as appropriate both for clinical decisions and research purposes, at least for the PI total score.
A limitation of our RG meta-analysis was the wide number of psychological disorders represented in the clinical samples. This circumstance, together with the scarce number of studies that used clinical samples, did not enable us to separately estimate the average reliability of the PI scores for the different psychological disorders. Another limitation of our RG meta-analysis was the low number of studies that reported test-retest reliability coefficients. This circumstance prevented us from exploring the influence of moderator variables for test-retest coefficients.
Unfortunately, the unadvised practice of inducing reliability is widely extended among researchers. In our RG meta-analysis, 77.5% of the studies that applied the PI induced reliability. Such a large reliability induction rate is coherent with previous research. In fact, a systematic review of 100 RG meta-analyses that included more than 40,000 empirical studies carried out in Psychology, found an average reliability induction of 78.6% (Sánchez-Meca, Rubio-Aparicio, Marín-Martínez, & López-Pina, Reference Sánchez-Meca, Rubio-Aparicio, Marín-Martínez and López-Pina2015, July; see also Vacha-Haase & Thompson, Reference Vacha-Haase and Thompson2011). One of the main objectives of the RG meta-analyses, initiated in 1998, was to change the usual practice of inducing the reliability in the empirical studies. However, our results indicated that the percentage of studies inducing the reliability has not significantly decreased over the years. To this respect, more than 15 years ago, the APA Task Force for Statistical Inference stated that:
Reliability is a property of the scores on a test for a particular population of examinees (…). Thus, authors should provide reliability coefficients of the scores for the data being analyzed even when the focus of their research is not psychometric. (Wilkinson & APA Task Force on Statistical Inference, Reference Wilkinson1999, p. 597).
Similar recommendations have been made by the American Educational Research Association and the National Research Council on Measurement in Education, as well as by the editorial policies of journals such as Educational and Psychological Measurement (Thompson, Reference Thompson1994) and the Journal of Experimental Education (Heldref Foundation, 1997). Therefore, RG meta-analyses are needed to demonstrate that reliability is not a property inherent to the test but of the test scores obtained in a given administration and to emphasize the need for avoiding the practice of inducing reliability from previous administrations of the test.
Supplementary Material
To view supplementary material for this article, please visit https://doi.org/10.1017/S1138741617000658