


Introduction
After ovarian-controlled hormonal hyperstimulation in assisted reproductive treatments (ART), most (about 85–90%) of retrieved oocytes are in the mature metaphase II (MII) stage and about 10–15% of oocytes are immature, either in prophase I (GV, germinal vesicle) or metaphase I (MI) (Chian et al., Reference Chian, Uzelac and Nargund2013).
Immature oocytes can be tested in vitro to evolve to mature oocytes, allowing for ART use by intracytoplasmic sperm injection (ICSI), which could be an advantage in cases of absence or low number of MII oocytes (Nogueira et al., Reference Nogueira, Romero, Vanhoutte, de Matos, Smitz, Gardner, Weissman, Howles and Shoham2009; Smitz et al., Reference Smitz, Thompson and Gilchrist2011). Some immature oocytes may spontaneously reach the final stage of nuclear maturation within 24 h after oocyte retrieval, and these rates may be increased (to about 80%) when immature oocytes are cultured in maturation medium supplemented with gonadotrophins (Cha and Chian, Reference Cha and Chian1998) and growth hormones (Richani and Gilchrist, Reference Richani and Gilchrist2018; Li et al., Reference Li, Liu, Yu, Liu, Huang, Zhao, Ma and Zhao2019).
Several reports have shown contradictory results following the use of MI oocytes in ICSI treatments. A case with recurrent retrieval of MI oocytes after ovarian stimulation revealed that those oocytes were devoid of in vitro maturation capacity and ultrastructural analysis showed disrupted spindle formation in the presence of a conserved cytoplasm morphology (Windt et al., Reference Windt, Coetzee, Kruger, Marino, Kitshoff and Sousa2001). A similar report, with recurrent retrieval of MI oocytes after ovarian stimulation, also showed that MI oocytes were unable to mature in vitro (Levran et al., Reference Levran, Farhi, Nahum, Glezerman and Weissman2002). However, other authors have reported evidence that some MI oocytes could mature in vitro into MII oocytes and therefore be used for ICSI treatments. In a study, after microinjection of MI oocytes, authors observed higher degeneration rates, lower fertilization rates and higher rates of multinucleated zygotes compared with MII oocytes, but some attained the embryo cleavage stage. After transfer of these embryos, a successful pregnancy, with the birth of a healthy newborn with a normal karyotype, was achieved (Strassburger et al., Reference Strassburger, Friedler, Raziel, Kasterstein, Schachter and Ron-El2004). These results were further supported by similar observations, in which some MI oocytes matured in vitro in MII oocytes, with these MII oocytes being able to fertilize and lead to successful pregnancies (Strassburger et al., Reference Strassburger, Friedler, Raziel, Kasterstein, Schachter and Ron-El2004).
The successful use of MI oocytes in ICSI treatments can only be possible if the MI oocyte achieved to correctly expel the second polar body and therefore originate a haploid female pronucleus. However, it is not advisable to use MI oocytes for ICSI treatments, as a parthenogenic activation of the oocyte, elicited by the injection procedure, would lead to the formation of a diploid female pronucleus (absence of second polar body extrusion). In contrast, the use of in vitro matured MI oocytes to MII oocytes, is justified when few MII oocytes are available or when all retrieved oocytes are at the MI stage (Vanhoutte et al., Reference Vanhoutte, De Sutter, Van der Elst and Dhont2005; Álvarez et al., Reference Álvarez, García-Garrido, Taronger and González de Merlo2013). Nevertheless, it is of note that embryos originating from MI oocytes present higher rates of chromosomal aneuploidy, even after in vitro maturation to MII oocytes (Strassburger et al., Reference Strassburger, Goldstein, Friedler, Raziel, Kasterstein, Mashevich, Schachter, Ron-El and Reish2010).
Earlier reports described MI oocyte ultrastructure. Some described the ooplasm and metaphase I plate (Zamboni et al., Reference Zamboni, Thompson and Smith1972; Sathananthan, Reference Sathananthan1994; El Shafie et al., Reference El Shafie, Windt, Kitshoff, McGregor, Sousa, Wranz, Kruger, El Shafie, Sousa, Windt and Kruger2000; Morimoto, Reference Morimoto2009). Others presented the nuclear changes occurring during maturation, from GV to MI and from MI to MII (Sathananthan, Reference Sathananthan1985; Sathananthan et al., Reference Sathananthan, Trouson and Wood1986). And others briefly described the ooplasm, with images (Sundström et al., Reference Sundström, Nilsson, Liedholm and Larsson1985a,b; Motta et al., Reference Motta, Nottola, Micara and Familiari1988; Familiari et al., Reference Familiari, Makabe, Motta, Blerkom and Motta1989; Sathananthan, Reference Sathananthan, Trouson and Gardner2000, Reference Sathananthan, Trouson and Gosden2003) or without images (Sundström and Nilsson, Reference Sundström and Nilsson1988). From these studies, analysis of MI oocyte ultrastructure revealed a mature appearance of the zona pellucida, a short perivitelline space, numerous narrow and moderately long microvilli, some cortical vesicles beneath the oolemma, numerous oval and elongated mitochondria, some adjacent to smooth endoplasmic reticulum (SER) vesicles, numerous small SER vesicles and tubules, and rare dictyosomes, annulate lamellae, rough endoplasmic reticulum and lysosomes.
To further complement these descriptive data, in the present study we quantified the organelle distribution in MI oocytes using a stereological approach. To our knowledge, this is the first stereological analysis of human MI oocytes. We believe that this kind of analysis complements morphological and molecular studies and helps to better understand the cellular mechanisms underlying oocyte maturation, which may be important for the development of new in vitro maturation methods and oocyte quality markers.
Materials and methods
Ethical approval
Ethical guidelines were followed conducting the research, with written informed consent obtained before experiments. This work did not involve experiments on humans or animals. Donated surplus immature oocytes were used. The approval of the Ethics Committee and the Helsinki Declaration, revised in Tokyo 2004, on human experimentation does not apply to this work. The procedures of the private infertility clinic CGR and the In Vitro Fertilization (IVF) unit of the Public Hospital CMIN-CHUP are under provisions of the National Law on Medically Assisted Procreation (Law of 2017) and overseen by the National Council on Medically Assisted Procreation (CNPMA-2018). According to these rules and guidelines, the use of clinical databases and patient biological material for diagnosis and research may be used without additional ethical approval, under strict individual anonymity, and after patient informed and written consent. Regarding the use of immature oocytes for electron microscopy at ICBAS-UP, the Ethics Committee authorization number is Project: 2019/CE/P017 (266/CETI/ICBAS).
Patients
We performed this research using five MI oocytes retrieved after controlled ovarian stimulation during ART treatments performed at CGR and CMIN-CHUP.
Ovarian-controlled hyperstimulation
Women underwent controlled ovarian hyperstimulation with a gonadotrophin-releasing hormone (GnRH) antagonist protocol (0.25 mg cetrorelix, Cetrotide; Merck-Serono, London, UK; or 0.25 mg ganirelix, Orgalutran; MSD, Hertfordshire, UK); or with a long agonist protocol (0.1 mg triptorelin, Decapeptyl; Ipsen Pharma Biotech, Signes, France). For stimulation, recombinant follicle stimulating hormone (rFSH, follitropin beta, Puregon; MSD, Haalem, The Netherlands; or rFSH, follitropin alfa, Gonal-F; Merck-Serono) was used alone or in combination with: human menopausal gonadotropin (HMG, Menopur; Ferring, Kiel, Germany) or recombinant luteinizing hormone (rLH lutropin alfa + rFSH follitropin alfa, rLH+rFSH, Pergoveris, Merck-Serono; or rLH, Luveris, Merck-Serono). In some cases, only HMG was used. The ovulation trigger was performed with recombinant choriogonadotropin alpha (rHCG, 250 µg, Ovitrelle; Merck-Serono), with a GnRH agonist (0.2 mg triptorelin), or with a dual trigger, using triptorelin (0.2 mg) and rHCG (250 µg). Serum estradiol testing was on the day of HCG trigger or 1 day before (Huirne et al., Reference Huirne, Homburg and Lambalk2007; Pinto et al., Reference Pinto, Oliveira, Cardoso, Teixeira da Silva, Silva, Sousa and Barros2009).
Gamete and embryo handling
Procedures were performed on a K-Systems laminar flow with thermal base (Cooper Surgical, Malöv, Denmark). For IVF, cumulus–oocyte complexes (COC) were collected in SynVitro Flush medium (without heparin, Origio, Malöv, Denmark). All media were devoid of phenol red. After this step, gamete handling was performed under paraffin oil (Ovoil-100, VitroLife, Frölunda, Sweeden). COCs were washed with SynVitro Flush medium in 1-well culture dishes (Falkon, Corning, New York, NY, USA). They were then transferred to an ESCO incubator (MRI-6A10, ESCO Medical, Singapore, Singapore) (37ºC, 5% O2, 6% CO2, 89% N2, in a humidified atmosphere) with Sequential Fert (Origio) and incubated for 2 h. Thereafter, they were denuded, for 30 s, with recombinant hyaluronidase (ICSI Cumulase, Origio), washed with sperm preparation medium (SPM) and then mechanically dissociated from granulosa cells in SPM (Origio) with oocyte denudation micropipettes (Vitrolife). Denudation was performed at 37ºC (thermal laminar flow base). After denudation, immature oocytes were transferred to SPM-containing tubes (Falkon, Corning) and processed for transmission electron microscopy (TEM).
Transmission electron microscopy
Oocytes were fixed with Karnovsky (2.5% glutaraldehyde, 4% paraformaldehyde, 0.15 M sodium cacodylate buffer) (Sigma-Aldrich, St. Louis, USA; Merck, Darmstadt, Germany) at room temperature for 30 min followed by 2 h at 4ºC. After washing in 0.15 M sodium cacodylate buffer, pH 7.3 (Merck) for 2 h at 4ºC, the oocytes were post-fixed with 2% osmium tetroxide (Merck) in buffer containing 0.8% potassium ferricyanide (Merck) for 2 h at 4°C. Oocytes were then washed in buffer (10 min), serially dehydrated in ethanol (Panreac, Barcelona, Spain), equilibrated with propylene oxide (Merck) and embedded in Epon (Sigma). Semithin and ultrathin sections were prepared with a diamond knife (Diatome, Hatfield, Switzerland) on an LKB ultramicrotome (Leika Microsystems, Weltzlar, Germany). Using a Random Number Table for the initial cut, MI oocytes were serially sectioned and the ultrathin sections were collected and analyzed every 15 µm. Ultrathin sections were collected on 100-mesh formvar carbon-coated copper grids (Taab, Berks, UK), stained with 3% aqueous uranyl acetate (20 min) (BDH, Poole, UK) and Reynolds lead citrate (10 min) (Merck). Ultrathin sections were observed under a JEOL 100 CXII transmission electron microscope (JEOL, Tokyo, Japan) operated at 60 kV (Sousa and Tesarik Reference Sousa and Tesarik1994; El Shafie et al., Reference El Shafie, Windt, Kitshoff, McGregor, Sousa, Wranz, Kruger, El Shafie, Sousa, Windt and Kruger2000; Sá et al., Reference Sá, Cunha, Silva, Luís, Oliveira, Teixeira da Silva, Barros and Sousa2011).
Stereological and statistical analysis
For each microscope grid, a systematic sampling was performed, with photographs taken at alternate TEM field spaces when more than 50% of the field was occupied by the oocyte cytoplasm. Images were taken at ×5300 magnification and printed at 20.2 cm × 20.2 cm. A classic manual stereological technique based on point-counting with an adequate stereological grid was used (Fig. 1A). Printed photographs were placed under a stereological grid and the number of grid points placed over each organelle was noted (Fig. 1B, C). The relative volume (Vv) of each organelle was obtained by applying the formula Vv (organelle, oocyte) = [number of points (organelle)/number of points (oocyte)] × 100 (%) as previously described (Weibel et al., Reference Weibel, Kistler and Scherle1966). All measurements were performed in the printed version. The organelles included in the evaluation were: cortical vesicles (CV), vesicles containing granular material (VZ), mitochondria (Mi), dictyosomes (Di), lysosomes (Ly), SER tubular aggregates (aSERT), SER isolated tubules (SER-IT), SER small vesicles (SER-SV: smaller than mitochondria), SER medium vesicles (SER-MV: about the size of mitochondria), SER large vesicles (SER-LV: larger than mitochondria), and total SER (SV, MV, LV, IT, aSERT).

Figure 1. (A) Stereological grid. (B, C) Example of a micrograph region (B) with an overlapping stereological grid (C). (D) Image of a live MI oocyte observed in the inverted microscope and semithin sections of the same oocyte (E–G). The oocyte (O) appears separated from the zona pellucida (ZP) by the perivitelline space (pvs), which contains oocyte microvilli (mv) and remnants of follicular cell feet (FCf). The metaphase I plate (mp) extends from the cortex to the inner region. The oocyte cortex exhibits cortical vesicles (arrows). The ooplasm evidences mitochondria (Mi), smooth endoplasmic reticulum vesicles (V) and areas devoid of major organelles (*).
In addition, each oocyte was divided into three regions from the oolemma up to the cell centre: cortex (5 µm), subcortex (5–10 µm) and inner cytoplasm (>10 µm) (Fig. 2). The same stereological procedure was then adopted, applying the formula Vv (organelle, cortex/ subcortex/inner cytoplasm) = [number of points (organelle)/number of points (cortex/subcortex/inner cytoplasm)] × 100 (%) (Pires-Luís et al., Reference Pires-Luís, Rocha, Bartosch, Oliveira, Silva, Barros, Sá and Sousa2016).

Figure 2. (A, B) Ultrastructural images of metaphase I oocytes showing the cortex (C), subcortex (SC) and inner (IC) oocyte regions. The distance between regions (dotted vertical lines) is of 5 µm. The distinct regions are separated by dotted transversal lines. Between the oocyte and the zona pellucida (ZP) lies the perivitelline space (pvs), which contains oocyte microvilli (mv). Cortical vesicles (CV) are mainly present in the cortex under the oolemma. Note the presence of numerous mitochondria (Mi) and smooth endoplasmic reticulum elements, including isolated tubules (IT) and small (SV) and medium (MV) vesicles. A few smooth endoplasmic reticulum large (LV) vesicles are present in the oocyte cortex.
Statistical analysis was performed with Microsoft Excel 2007 and SPSS version 22.0 (IBM Corp, Foster City, California, CA, USA). Results are presented as mean, standard error of the mean (SEM = standard deviation/n1/2) and coefficient of variation (CVar = standard deviation/mean).
Normal distribution was tested with the Kolmogorov–Smirnov test. As the samples did not follow a normal distribution, non-parametric tests were used. Kruskal–Wallis and Mann–Whitney U-tests with Bonferroni correction were used to compare the means of Vv (organelle, oocyte), Vv (organelle, cortex), Vv (organelle, subcortex) and Vv (organelle, inner cytoplasm). Statistical significance level was set at P < 0.05.
Results
At the inverted microscope, live MI oocytes (Fig. 1D) appeared as a roundish cell separated from a translucent thick zona pellucida (ZP) by a short and narrow perivitelline space. The ooplasm presented a slight granularity in the inner region.
In semithin sections (Fig. 1E–G), the perivitelline space evidenced remnants of follicular cell feet and oocyte microvilli, with cortical vesicles under the oolemma. The remainder of the ooplasm contained mitochondria and lucent vesicles. A network of areas devoid of major organelles appeared markedly large at the oocyte cortex and subcortex. On one of the cell’s poles, near the surface, was the metaphase I plate.
At the ultrastructural level, the oocyte surface evidenced numerous narrow and long microvilli (Fig. 2). Under the oolemma, there was a continuous row of dense CV and coated-vesicles (Figs 2 and S1). Isolated CVs were observed in the subcortex (Fig. 2B) and inner ooplasm (Fig. 3B). The cortical region also contained small vesicles containing granular materials (VZ), which seemed to expel their contents into the perivitelline space (Fig. S1). The remainder ooplasm was filled with SER small (SV), medium (MV) and large (LV) vesicles, SER-IT and mitochondria (Figs 2 and 3). The ooplasm also contained SER tubular aggregates (aSERT) (Fig. S2B, C), lysosomes (Fig. S2D, E), and small dictyosomes (Fig. S3). The Metaphase I plate was observed traversing the three regions of the oocyte, without centrioles at the chromosome poles (Fig. S2A). We did not observe annulate lamellae, rough endoplasmic reticulum cisternae, multivesicular bodies, lipid droplets or polyribosomes. As we did not perform cytochemical analyses, it was not possible to exclude the presence of primary lysosomes or peroxisomes.

Figure 3. Ultrastructural images of metaphase I oocytes showing the subcortex (A) and inner (B) oocyte regions. The ooplasm evidences numerous mitochondria (Mi) and smooth endoplasmic reticulum elements, including tubular aggregates (aSERT), isolated tubules (IT) and small (SV) and medium (MV) vesicles. Smooth endoplasmic reticulum large vesicles (LV) were observed only in the inner ooplasm. In these sections, one lysosome (Ly) and a cortical vesicle (CV) can also be observed.
The present stereological analysis was performed on 320 photographs, 153 with representation of the oocyte cortex, 142 with representation of the oocyte subcortex and 167 with representation of the oocyte inner cytoplasm (Figs 2 and 3). Quantified organelles were cortical vesicles, VZ vesicles, mitochondria, lysosomes, dictyosomes, aSERT, SER-IT and SER small, medium and large vesicles.
In the whole ooplasm (Table 1), mitochondria (Vv 6.5%), SER-IT (Vv 9.4%) and SER-MV (Vv 4.5%) were the organelles that occupied the highest mean relative volumes, with total SER corresponding to the highest mean relative volumes (Vv 15.05%). This was followed by aSERT (Vv 0.8%), cortical vesicles and lysosomes (Vv 0.4%), VZ vesicles (Vv 0.04%) and dictyosomes (Vv 0.01%).
Table 1. Relative volume of organelles (Vv) per MI oocyte, oocyte cortex, subcortex and inner cytoplasm

Results presented as mean (%), SEM: standard error of the mean (standard deviation/n1/2), and CVar: coefficient of variation (standard deviation/mean).
CV: cortical vesicles; VZ: vesicles with granular material; Mi: mitochondria; Di: dictyosomes; Ly: lysosomes; SER: smooth endoplasmic reticulum; aSERT: SER tubular aggregates; SER-IT: SER tubules; SER-SV: SER small vesicles; SER-MV: SER medium vesicles; SER-LV: SER large vesicles.
By type of organelles (Table 1), cortical vesicles predominated in the oocyte cortex, but were also found in the subcortex and inner ooplasm; VZ vesicles were observed in the oocyte cortex and very rarely in the inner ooplasm; mitochondria were equally distributed with slightly higher Vv in the subcortex; dictyosomes were rare and appeared in the cortex and inner ooplasm; lysosomes were evenly distributed, with a slightly higher Vv in the inner ooplasm; aSERT were distributed regularly, with a higher Vv found in the subcortex; SER-IT were distributed regularly, with a slight progressive decrease towards the inner ooplasm; SER-SV were similarly distributed; Ser-MV were equally distributed, with a higher Vv found in the inner ooplasm; and SER-LV were found in the cortex and inner ooplasm.
In the oocyte cortex (Table 1), the most predominant organelles were SER tubules and vesicles (mainly SER-IT and SER-MV), mitochondria, aSERT and cortical vesicles. In the oocyte subcortex (Table 1), the most predominant organelles were SER tubules and vesicles (mainly SER-IT and SER-MV), mitochondria and aSERT. In the oocyte inner ooplasm (Table 1), the most predominant organelles were SER tubules and vesicles (mainly SER-IT, SER-MV and SER-LV), mitochondria and aSERT.
The three oocyte regions were compared globally using the Kruskal–Wallis test (Table 2). No significant differences were found in the mean relative volume occupied by mitochondria, dictyosomes, lysosomes, aSERT, SER-IT, and SER small and medium vesicles. However, significant differences were observed in the mean relative volume occupied by cortical vesicles, VZ vesicles and SER-LV.
Table 2. Comparison of the means of Vv (organelle, cortex), Vv (organelle, subcortex) and Vv (organelle, inner cytoplasm) in MI oocytes

* Significance set at P < 0.05.
CV: cortical vesicles; VZ: vesicles with granular materials; Mi: mitochondria; Di: dictyosomes; Ly: lysosomes; SER: smooth endoplasmic reticulum; aSERT: SER tubular aggregates; SER-IT: SER tubules; SER-SV: SER small vesicles; SER-MV: SER medium vesicles; SER-LV: SER large vesicles.
Using the Mann–Whitney U-test, Bonferroni-corrected, strict pairwise comparisons for the three regions were performed (Table 2). No significant differences were found between the three oocyte regions regarding the mean relative volume occupied by mitochondria, dictyosomes, lysosomes, aSERT, SER-IT, and SER small and medium vesicles. However, significant differences were observed in the mean relative volume occupied between the three oocyte regions by cortical vesicles (Vv cortex > Vv subcortex, Vv cortex > Vv inner ooplasm), VZ vesicles (Vv cortex > Vv subcortex) and SER-LV (Vv subcortex < Vv inner ooplasm).
Discussion
Oocyte competence is fundamental for the formation of a gamete with full embryo and implantation potential. Oocyte competence is acquired during in vivo maturation inside the ovarian follicle, in association with local factors, brain hormones and the surrounding follicular cells, being accomplished in an integrated mode at cytoplasmic and nuclear levels (Keef et al., Reference Keef, Kumar and Kalmbach2015; Conti and Franciosi, Reference Conti and Franciosi2018; Hoshino, Reference Hoshino2018). Regarding cytoplasmic maturation, the oocyte accumulates RNA molecules, proteins, substrates and nutrients, and calcium signalling stores (Coticchio et al., Reference Coticchio, Dal Canto, Renzini, Guglielmo, Brambillasca, Turchi, Novara and Fadini2015; Ferrer-Buitrago et al., Reference Ferrer-Buitrago, Dhaenens, Lu, Bonte, Vanden Meerschaut, De Sutter, Leybaert and Heindryckx2018). This is accompanied by the formation and spatial distribution of the major organelles, SER, mitochondria and cortical vesicles, and the cytoskeleton (Watson, Reference Watson2007; Nottola et al., Reference Nottola, Macchiarelli and Familiari2014; Pires-Luís et al., Reference Pires-Luís, Rocha, Bartosch, Oliveira, Silva, Barros, Sá and Sousa2016; Sousa et al., Reference Sousa, Oliveira, Barros, Barros and Sá2016; Cui and Kim, Reference Cui and Kim2017; Reader et al., Reference Reader, Stanton and Juengel2017). Nuclear maturation refers to the steps involved in the resumption of meiosis, in which GV oocytes (fetal oocytes undergo meiotic recombination and become arrested at the end of prophase I, diplotene, entering in dictyotene at birth) undergo nuclear envelope breakdown, followed by arrest at the MI stage. Under the LH surge, oocytes suffer meiosis I (chromosomal segregation with formation of the first polar body) and originate oocytes that remain arrested at the MII stage. Meiosis II (chromatid segregation with formation of the second polar body) occurs only after successful fertilization (MacLennan et al., Reference MacLennan, Crichton, Playfoot and Adams2015; Capalbo et al., Reference Capalbo, Hoffmann, Cimadomo, Ubaldi and Rienzi2017; Greaney et al., Reference Greaney, Wei and Homer2018).
Numerous efforts have been developed to better understand the physiology of oocyte maturation using different ’omics approaches, such as gene expression analysis (Virant-Klun et al., Reference Virant-Klun, Knez, Tomazevic and Skutella2013), transcriptome studies (Labrecque and Sirard, Reference Labrecque and Sirard2014; Zhao et al., Reference Zhao, Li, Zhao, Tan, Liu, Liu, Chang, Huang, Li, Fan, Yu, Li and Qiao2019) and metabolomics assays (Bracewell-Milnes et al., Reference Bracewell-Milnes, Saso, Abdalla, Nikolau, Norman-Taylor, Johnson, Holmes and Thum2017). Using these techniques, upregulated and downregulated expressed genes in GV, MI and MII oocytes, mainly involved in transcription regulation, cell cycle and DNA repair pathways, were enumerated by microarray analysis (Gasca et al., Reference Gasca, Pellestor, Assou, Loup, Anahory, Dechaud, De Vos and Hamamah2007). Single-cell proteomics identified differentially expressed proteins in GV and MI oocytes (Virant-Klun et al., Reference Virant-Klun, Leicht, Hughes and Krijgsveld2016) and DNA methylation patterns were determined by single-cell whole genome analysis in GV, MI and MII oocytes (Yu et al., Reference Yu, Dong, Gravina, Kartal, Schimmel, Cohen, Tortoriello, Zody, Hawkins and Vijg2017).
Several mechanisms for MI arrest have been raised. Some authors have suggested that the MI arrest could be due to an incomplete or absent LH effect, to disturbances in signalling mechanisms between oocyte and cumulus cells, or intrinsic oocyte factors (Coticchio et al., Reference Coticchio, Dal Canto, Renzini, Guglielmo, Brambillasca, Turchi, Novara and Fadini2015). Of the intrinsic factors, the authors suggested that MI arrest could be due to loss of the meiotic checkpoint, in which the maturation-promoting factor (MPF), a metaphase (M-phase)-specific kinase would remain inactivate or that MI arrest could be due to abnormal spindle formation (Mehlmann, Reference Mehlmann2005; Madgwick and Jones, Reference Madgwick and Jones2007). Other authors have suggested four major mechanisms, cytoplasmic incompetence, disruption of factors involved in meiotic recombination, loss of MPF activation and cytoskeleton anomalies (Mrazek and Fulka, Reference Mrazek and Fulka2003; Mehlmann, Reference Mehlmann2005; Madgwick and Jones, Reference Madgwick and Jones2007; Coticchio et al., Reference Coticchio, Dal Canto, Renzini, Guglielmo, Brambillasca, Turchi, Novara and Fadini2015). Other authors offered a sustained review of all cases and results with animal models. This analysis revealed that, of all the factors presented above, the main cause of MI arrest would be due to signal transduction pathways that mediate meiotic progression or abnormalities in the meiotic spindle (Beall et al., Reference Beall, Brenner and Segars2010). More recently, MI arrest has been related to spindle assembly checkpoint defects (Tripathi et al., Reference Tripathi, Kumar and Chaube2010; Marangos et al., Reference Marangos, Stevense, Niaka, Lagoudaki, Nabti, Jessberger and Carroll2015; Liu et al., Reference Liu, Li, Li, Zhao, Huang, Wang, Gao, Yu and Shi2016), TUBB8 tubulin gene mutations, whose expressed protein is a member of the meiotic spindle microtubules (Feng et al., Reference Feng, Sang, Kuang, Sun, Yan, Zhang, Shi, Tian, Luchniak, Fukuda, Li, Yu, Chen, Xu, Guo, Qu, Wang, Sun, Liu, Shi, Wang, Feng Yi, Chai, Li, Xing, Zhang, Nogales, Jin, He, Gupta, Cowan and Wang2016; Chen et al., Reference Chen, Li, Li, Yan, Mao, Xu, Mu, Li, Jin, He, Kuang, Sang and Wang2017a) and with mutations in the PATL2 gene, whose protein is related to topoisomerase II, a critical enzyme involved in DNA replication, including meiosis (Chen et al., Reference Chen, Zhang, Sun, Kuang, Mao, Wang, Yan, Li, Xu, Yu, Fu, Mu, Zhou, Li, Jin, He, Sang and Wang2017b).
There are no ultrastructural studies dedicated exclusively to human MI oocytes. Of the works giving data substantiated by images, we found similar findings regarding the type of perivitelline space (narrow), microvilli (numerous, narrow and long), mitochondria, and SER vesicles and tubules (Zamboni et al., Reference Zamboni, Thompson and Smith1972; Sundström et al., Reference Sundström, Nilsson, Liedholm and Larsson1985a,b; El Shafie et al., Reference El Shafie, Windt, Kitshoff, McGregor, Sousa, Wranz, Kruger, El Shafie, Sousa, Windt and Kruger2000; Sathananthan, Reference Sathananthan, Trouson and Gardner2000, Reference Sathananthan, Trouson and Gosden2003); presence of aSERT (Zamboni et al., Reference Zamboni, Thompson and Smith1972; Sundström et al., Reference Sundström, Nilsson, Liedholm and Larsson1985a,b); distribution of cortical vesicles forming one or two rows (Zamboni et al., Reference Zamboni, Thompson and Smith1972; Sundström et al., Reference Sundström, Nilsson, Liedholm and Larsson1985a,b; El Shafie et al., Reference El Shafie, Windt, Kitshoff, McGregor, Sousa, Wranz, Kruger, El Shafie, Sousa, Windt and Kruger2000; Sathananthan, Reference Sathananthan, Trouson and Gardner2000, Reference Sathananthan, Trouson and Gosden2003); secondary lysosomes with heterogeneous contents (Sundström et al., Reference Sundström, Nilsson, Liedholm and Larsson1985a,b; El Shafie et al., Reference El Shafie, Windt, Kitshoff, McGregor, Sousa, Wranz, Kruger, El Shafie, Sousa, Windt and Kruger2000; Sathananthan, Reference Sathananthan, Trouson and Gosden2003); presence of coated-vesicles (Sathananthan, Reference Sathananthan, Trouson and Gosden2003); and presence of areas devoid of organelles (Sundström et al., Reference Sundström, Nilsson, Liedholm and Larsson1985a; Motta et al., Reference Motta, Nottola, Micara and Familiari1988). In accordance with those previous studies, we did not find multivesicular bodies, annulate lamellae, rough endoplasmic reticulum, polyribosomes or lipid droplets.
Although ultrastructural observations can describe in detail the morphology of oocyte components, they are unable to provide reliable information on the actual distribution of organelles. To overcome this limitation, we here presented a stereological analysis of human MI oocytes, providing the mean relative volumes occupied by each organelle and their relative positions. Total SER vesicles and tubules (Vv 15.05%) and mitochondria (Vv 6.5%) were the organelles that occupied the highest mean relative volumes. These were evenly distributed across all oocyte regions. Of the SER components, SER tubules (9.4%) and SER-MV (4.5%) presented the highest mean relative volumes and were also evenly distributed, while aSERT predominated in the oocyte subcortex and cortex, SER-SV appeared uniformly distributed and SER-LV predominated in the inner ooplasm. Dictyosomes were rare and small, being found in the cortex and inner ooplasm. Lysosomes with heterogeneous materials were frequent and lacked precise location. They reflect an active metabolism and autophagy in the immature MI oocyte. Cortical vesicles were predominantly observed under the oolemma and, as expected in an immature oocyte, isolated cortical vesicles were still observed in the subcortex and inner ooplasm. Granular content vesicles were observed in the oocyte cortex. These vesicles apparently fused with the oolemma, releasing their contents into the perivitelline space, reaching the inner ZP. Similar vesicles were observed in human GV oocytes, in which they were suggested to deliver zona pellucida-like components to the extracellular milieu (Pires-Luís et al., Reference Pires-Luís, Rocha, Bartosch, Oliveira, Silva, Barros, Sá and Sousa2016). The oocyte submembranar region presented tiny coated-vesicles, suggesting active receptor-mediated endocytosis, which reinforces that the immature MI oocyte remains active in absorption of elements from the external milieu. The MI oocyte cytoplasm evidenced a network of areas devoid of major organelles, larger in the subcortex oocyte region. Future work is needed as these regions may represent a stock of molecules or energy constituents for current use and ready to use after fertilization.
We previously quantified by stereological methods the mean relative volumes occupied by each organelle and their relative distribution in human GV oocytes (Pires-Luís et al., Reference Pires-Luís, Rocha, Bartosch, Oliveira, Silva, Barros, Sá and Sousa2016). Regarding morphology, MI oocytes as GV oocytes did not present rough endoplasmic reticulum, lipid droplets and polyribosomes. In opposite, MI oocytes did not present LV containing zona-pellucida-like materials, multivesicular bodies, annulate lamellae and SER very LV (SER-VLV), and GV oocytes did not present VZ vesicles, aSERT or associations between mitochondria and SER elements. Regarding the total mean relative volumes, GV oocytes displayed a predominance of SER-VLV (mainly in the inner ooplasm), mitochondria and total SER elements (Pires-Luís et al., Reference Pires-Luís, Rocha, Bartosch, Oliveira, Silva, Barros, Sá and Sousa2016). MI oocytes also revealed a predominance of mitochondria and total SER, but instead of SER-VLV, which does not exist in MI oocytes, this predominance was replaced by SER-MV.
Comparative quantitative data between MI and GV oocytes using strict pairwise comparisons for the three oocyte regions (Table 3) revealed several other differences between them. Both MI and GV oocytes exhibited a prevalence of cortical vesicles in the oocyte cortex. In MI oocytes, mitochondria were evenly distributed, with significant differences to GV oocytes observed only at the cortex (higher in MI), while in GV oocytes mitochondria predominated in the inner regions. There were no significant differences between MI and GV oocytes regarding regular lysosome distribution. In all oocyte regions, there were significant lower mean relative volumes of dictyosomes and SER-SV and significant higher mean relative volumes of SER-MV, SER-IT and total SER elements, in MI oocytes. When the three oocyte regions were compared globally, significant differences were observed in the mean relative volume occupied by dictyosomes (higher in GV), SER-IT (higher in MI), SER-SV (higher in GV), SER-MV (higher in in MI) and total SER (higher in MI).
Table 3. Comparison of the means of Vv (organelle, cortex-c), Vv (organelle, subcortex-sc) and Vv (organelle, inner cytoplasm-ic) between GV oocytes and MI oocytes
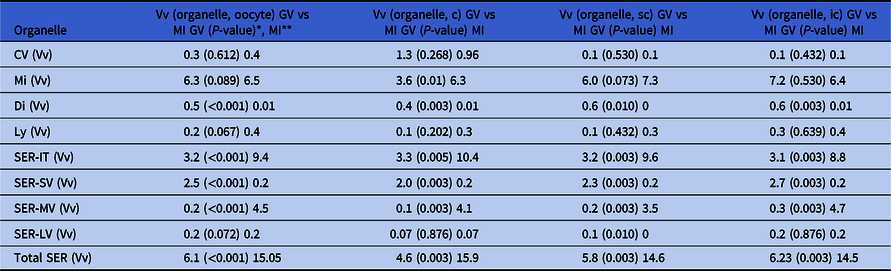
* Significance set at P < 0.05
** Data are presented as the Vv found in the different organelles in GV oocytes (from Pires-Luís et al., Reference Pires-Luís, Rocha, Bartosch, Oliveira, Silva, Barros, Sá and Sousa2016), the comparative P-value between the Vv of GV vs MI oocytes for each organelle, and the Vv found in the different organelles in MI oocytes (from Table 1).
GV: prophase I oocytes (germinal vesicle stage); MI: metaphase-I oocytes; CV: cortical vesicles; Mi: mitochondria; Di: dictyosomes; Ly: lysosomes; SER: smooth endoplasmic reticulum; aSERT: SER tubular aggregates; SER-IT: SER tubules; SER-SV: SER small vesicles; SER-MV: SER medium vesicles; SER-LV: SER large vesicles.
Despite thorough quantitative assessments, the main limitation of the present study is the limited number of MI oocytes evaluated (five). This limitation was imposed by the low availability of MI oocytes at our IVF facilities. However, it should be noted that the oocytes used in this study were retrieved from five different women, which allowed a more heterogeneous sample.
In conclusion, we present here a stereological quantitative evaluation of human MI oocytes. The data revealed a homogeneous organelle distribution (mitochondria, dictyosomes, lysosomes and SER), except for the predominance of cortical vesicles and VZ vesicles in the oocyte cortex and SER-LV in the inner cytoplasm. The MI oocyte was extremely rich in mitochondria, SER medium vesicles and tubules. The MI oocyte already presented well-developed SER tubular aggregates associated with mitochondria, which in the mature MII oocyte are known to actively participate in calcium signalling at fertilization (Sousa et al., Reference Sousa, Barros and Tesarik1996, Reference Sousa, Barros, Silva and Tesarik1997). Additionally, the MI oocyte cortex still evidences signs of ZP material export from the oocyte and active endocytosis.
Supplementary material
To view supplementary material for this article, please visit https://doi.org/10.1017/S0967199420000131
Financial Support
This research did receive no grants from funding commercial agencies. UMIB (Pest-OE/SAU/UI0215/2014) is funded by National Funds through FCT-Foundation for Science and Technology.
Conflicts of interest
The authors declare to have no competing interests.
Compliance with ethical standards
The authors declare that they have followed all rules of ethical conduct regarding originality, data processing and analysis, duplicate publication and biological material.


