


Gene × Intervention (G × I) research has accumulated over the last decade (see Bakermans-Kranenburg & van IJzendoorn, Reference Bakermans-Kranenburg and van IJzendoorn2015). Guided substantially by differential susceptibility theory (DST; Belsky & Pluess, Reference Belsky and Pluess2009, Ellis, Boyce, Belsky, Bakermans-Kranenburg, & van IJzendoorn, Reference Ellis, Boyce, Belsky, Bakermans-Kranenburg and van IJzendoorn2011), a good deal of this research has characterized genes as moderators of intervention effects to examine whether genes influence sensitivity to interventions (see Brody et al., Reference Brody, Beach, Philibert, Chen and Murry2009; Bakermans-Kranenberg, van IJzendoorn, Pijlman, Mesman, & Juffer, Reference Bakermans-Kranenberg, van IJzendoorn, Pijlman, Mesman and Juffer2008, for seminal examples). It also is possible, however, to consider whether and how interventions moderate risks created by specific genes. In one example of this work, Vandenbergh et al. (Reference Vandenbergh, Schlomer, Cleveland, Schink, Feinberg, Neiderhiser and Redmond2016) demonstrated that substance misuse preventive interventions can moderate the well-characterized association between a single nucleotide polymorphism (SNP; rs16969968) from the nicotinic receptor α5 subunit gene (neuronal acetylcholine receptor subunit α-5 [CHRNA5]) and cigarette smoking risk. Taking an approach similar to Vandenbergh et al. (Reference Vandenbergh, Schlomer, Cleveland, Schink, Feinberg, Neiderhiser and Redmond2016), the current inquiry investigated the effect of alcohol dehydrogenase (ADH) genes on adolescent alcohol use and evaluated the moderating role of substance misuse intervention programming on these genetic effects. Guided by the developmental psychopathology tenet that the complex set of causal influences that act on outcomes such as alcohol use (Zucker, Reference Zucker, Cicchetti and Cohen2006) may not be constant across developmental periods, we examined ADH genes’ associations with growth in alcohol use across early versus middle adolescence (defined as 6th to 9th grade and 9th to 12th grade, respectively), and tested whether substance misuse intervention programming affected these genetic associations differently across these periods of adolescence. Prior to setting out details of the study and the hypotheses tested, we review approaches to candidate Gene × Intervention (cG × I) research, genetic variants affecting alcohol metabolism, differences between early and midadolescent alcohol use, how these differences might impact genetic variants’ influences on alcohol use across adolescence, and how a substance misuse intervention might affect links between specific genetic variants and alcohol use.
Findings and Approaches to G × I Research
Randomized intervention designs have been leveraged to investigate how environments and genes can work together to contribute to complex behavioral and psychological outcomes (Bakermans-Kranenburg & van IJzendoorn, Reference Bakermans-Kranenburg and van IJzendoorn2015). Much of this research has centered on a handful of well-studied candidate genes such as dopamine receptor D4 (DRD4) and serotonin transporter linked polymorphic region (5-HTTLPR). For example, genetically informative analyses of a subsample of the PROSPER preventive-intervention study's participants who took part in in-home data collections and provided DNA revealed that intervention programming strongly impacted alcohol use among a subgroup of adolescents defined by genotype and family characteristics (Cleveland et al., Reference Cleveland, Schlomer, Vandenbergh, Feinberg, Greenberg, Spoth and Hair2015). Specifically, the PROSPER intervention reduced 9th-grade drinking among adolescents who carried the seven-repeat allele of the DRD4 gene and reported average or above levels of maternal involvement. Parallel analyses with 5-HTTLPR showed that the effect of the intervention on adolescent alcohol use differed between homozygous long- and short-carrying youth; again, this was only true for adolescents reporting average or above levels of maternal involvement. More detail is provided on PROSPER's in-home data collections below, but also see Cleveland et al. (Reference Cleveland, Schlomer, Vandenbergh, Feinberg, Greenberg, Spoth and Hair2015). This finding adds to the growing body of research (e.g., Belsky & van IJzendoorn, Reference Belsky and van IJzendoorn2015) demonstrating that variability in responses to preventive interventions can be influenced by specific genes (see Bakermans-Kranenberg et al., Reference Bakermans-Kranenberg, van IJzendoorn, Pijlman, Mesman and Juffer2008; Brody, Beach, Philibert, Chen, & Murry, Reference Brody, Beach, Philibert, Chen and Murry2009).
The above candidate cG × I studies have been guided by the DST framework and have tended to use genes, such as DRD4 and 5-HTTLPR, that some have labeled susceptibility genes. A second approach to cG × I research conceptualizes interventions as attenuating genetic risk related to specific genes linked to biological processes. In the most straightforward case, cG × I research framed in this way would involve genes directly implicated in specific biological processes that in turn are related to the outcome being studied. Such genes would have main effects on the outcome in control conditions, but these effects would be removed or reduced in intervention conditions. One such instance is the association between rs16969968, which is located in the CHRNA5 gene. Variation in the rs16969968 SNP alters the biological function of nicotinic receptors containing the risk allele, reducing their ability to bind to nicotine agonists (Saccone et al., Reference Saccone, Hinrichs, Saccone, Chase, Konvicka, Madden and Bierut2007) and increasing short-term desensitization to nicotine (Kuryatov, Berrettini, & Lindstrom, Reference Kuryatov, Berrettini and Lindstrom2001). This SNP has a strong record of replication for many tobacco-related behaviors (see review by Berrettini & Doyle, Reference Berrettini and Doyle2012). Vandenbergh et al. (Reference Vandenbergh, Schlomer, Cleveland, Schink, Feinberg, Neiderhiser and Redmond2016) found that control condition respondents who were homozygous for the A “risk” allele reported rates of smoking more than twice those reported by homozygous G youth, with heterozygous youth reporting intermediate smoking levels. In contrast, among intervention youth, no association was found between rs16969968 variation and smoking. Smoking levels across genotypes and intervention conditions revealed a two-way interaction whereby intervention programming eliminated the main effect of the A allele on smoking found among control youth.
The Vandenbergh et al. (Reference Vandenbergh, Schlomer, Cleveland, Schink, Feinberg, Neiderhiser and Redmond2016) finding provides an example of cG × I research that leverages existing knowledge about how a specific genetic marker affects a biological process relevant to a behavioral phenotype to investigate how and for whom interventions affect risk behaviors. The current study followed this approach to cG × I research, focusing on genetic variation within the alcohol dehydrogenase system and adolescent alcohol use behaviors.
Multi-SNP and Multi-Gene Approaches
Despite some advantages to using single candidate genes with well-known characteristics, such as a SNP within the CHRNA5 or DRD4, there is concern within the research community about overreliance on single-variant approaches. Based upon this concern, behavioral science research has increasingly incorporated multilocus assessments of genetic variance into their investigations (see Salvatore & Dick, Reference Salvatore and Dick2015; Schlomer, Cleveland, Vandenbergh, Fosco, & Feinberg, Reference Schlomer, Cleveland, Vandenbergh, Fosco and Feinberg2015). There are several approaches to incorporating polygenetic variance into conventional behavioral science studies. One method involves using information from genome-wide association (GWA) studies and creating a polygenetic score based on the top “hits” (lowest p values; Belsky et al., Reference Belsky, Moffitt, Baker, Biddle, Evans, Harintno and Caspi2013). This GWA-based approach is agnostic to the biological role of the selected SNPs. More biologically focused and top-down approaches select genes with known relationships to specific biological processes. For example, Nikolova, Ferrell, Manuck, and Hariri (Reference Nikolova, Ferrell, Manuck and Hariri2012) used a score based on multiple dopamine-related gene variants (dopamine transporter 1 [DAT1] nine repeat, DRD4 seven repeat, and catechol-O-methyltransferase [COMT] 158Met, and two variants in the dopamine receptor D2 [DRD2] gene [–141C In/Del and TaqIA C (A2)]) to predict ventral striatum reactivity. Concentrating on variance in one gene, Cleveland et al. (Reference Cleveland, Griffin, Wolf, Wiebe, Schlomer, Feinberg and Vandenberghin press) used five SNPs to characterize variance within the oxytocin receptor gene (OXTR).
Beyond the general distinction of whether a polyvariant approach is GWA-based or biologically focused, researchers also may have to make decisions about how to incorporate multiple SNPs from the same gene as predictors. For example, Albert et al. (Reference Albert, Belsky, Crowley, Latendresse, Aliev, Riley and Dodge2015) analyzed 10 SNPs within the glucocorticoid receptor gene and, correcting for false-discovery rate, found that only 1 SNP (rs10482672) moderated the association between intervention condition and risk for externalizing psychopathology.
The approach used in this study drew from the different approaches described above. Similar to Nikolova et al. (Reference Nikolova, Ferrell, Manuck and Hariri2012), who focused on multiple genes in the dopaminergic system, and Cleveland et al. (Reference Cleveland, Griffin, Wolf, Wiebe, Schlomer, Feinberg and Vandenberghin press), who focused on five SNPs within the OXTR gene, we focused on genetic variation affecting a biological system: in our case, the ADH system. Within the ADH system, we focused on three genes. Similar to Albert et al. (Reference Albert, Belsky, Crowley, Latendresse, Aliev, Riley and Dodge2015) and Cleveland et al. (Reference Cleveland, Griffin, Wolf, Wiebe, Schlomer, Feinberg and Vandenberghin press), we relied on more than one SNP per gene, using two SNPs to characterize each of three ADH genes. Details on the ADH system, these three genes, and each of the SNPs are provided below.
Genetic Variation Affecting Alcohol Metabolism
The genes encoding ADH are responsible for the first step in alcohol metabolism, wherein ethanol is converted to acetaldehyde, a molecule that causes negative consequences for alcohol consumption, such as nausea and headache. The ADH genes frequently associated with these traits are ADH 1B (ADH1B, formerly ADH2), 1C (ADH1C, formerly ADH3), and 4 (ADH4; reviewed by Edenberg & Faroud, Reference Edenberg, Foroud, Sullivan and Pfefferbaum2014; Wall, Luczak, Orlowska, & Pandika, Reference Wall, Luczak, Orlowska, Pandika, MacKillop and Munafò2013), which are found in a cluster with four other ADH genes on human chromosome 4 (Osier et al., Reference Osier, Pakstis, Soodyall, Comas, Goldman, Odunsi and Kidd2002; Tsukahara & Yoshida, Reference Tsukahara and Yoshida1989). The most frequently studied polymorphisms in ADH1B and ADH1C are missense mutations that alter the function of their respective enzymes, increasing the possibility that the associations might be causal. Details of the nomenclature for these genes and SNPs are provided in Table 1, but here we offer one illustrative example. In the case of ADH1B, the SNP is now known as rs1229984 (G/A) and as Arg48His when referring to the change in the protein's amino acid sequence (arginine or histidine at amino acid 48). This rs1229984 SNP was originally termed ADH2*1/*2 due to its initial identification by enzyme assay prior to adoption of a systematic nomenclature. In European-descent populations, the major allele is the nucleotide G (originally *1), which results in a slower rate of alcohol oxidation into acetaldehyde. The arginine allele (G) is considered the risk allele because it slows alcohol metabolism with two effects. First, the concentration of alcohol in the body is increased, along with its intoxicating attributes; second, it diminishes the concentration of acetaldehyde and its negative consequences.
Table 1. Gene and SNP descriptive information

Note: SNP, single nucleotide polymorphism; ADH1B, ADH2, ADH1C, ADH3, and ADH4, alcohol dehydrogenase 1B, 2, 1C, and 3 genes; 3′-UTR, 3′-Untranslated region; NA, not applicable; Arg, arginine; His, histone; Ile, isoleucine; Val, valine.
aThe major allele in Europeans is listed first.
bRisk allele based on Macgregor et al. (Reference Macgregor, Lind, Bucholz, Hansell, Madden, Richter and Whitfield2009), Luo et al. (Reference Luo, Kranzler, Zuo, Wang, Schork and Gelernter2007), and Kuo et al. (Reference Kuo, Kalsi, Prescott, Hodgkinson, Goldman, van den Oord and Riley2008) (in a haplotype).
cRisk allele based on Olfson et al. (Reference Olfson, Edenberg, Nurnberger, Agrawal, Bucholz, Almasy and Bierut2014), Gelernter et al. (2014), Bierut et al. (2012), and Sherva et al. (2009).
dThe slow (risk) allele is the major allele at this site.
eRisk allele based on Tolstrup et al. (Reference Tolstrup, Nordestgaard, Rasmussen, Tybjaerg-Hansen and Grønbaek2008) and Way et al. (Reference Way, McQuillin, Saini, Ruparelia, Lydall, Guerrini and Gurling2015).
fThe slow (risk) allele is the minor allele at this site.
gRisk allele based on supplemental table of Biernacka (Reference Biernacka, Geske, Schneekloth, Frye, Cunningham, Choi and Karpyak2013) and Treutlein et al. (Reference Treutlein, Cichon, Ridinger, Wodarz, Soyka, Zill and Rietschel2009).
hRisk allele based on Luo et al. (Reference Luo, Kranzler, Zuo, Yang, Lappalainen and Gelernter2005, Reference Luo, Kranzler, Zuo, Lappalainen, Yang and Gelernter2006, Reference Luo, Kranzler, Zuo, Wang, Schork and Gelernter2007).
iRisk allele based on Grochans et al. (Reference Grochans, Grzywacz, Małecka, Samochowiec, Karakiewicz and Samochowiec2011) and Preuss et al. (Reference Preuss, Ridinger, Rujescu, Samochowiec, Fehr, Wurst and Zill2011), but see Luo et al. (Reference Luo, Kranzler, Zuo, Yang, Lappalainen and Gelernter2005, Reference Luo, Kranzler, Zuo, Lappalainen, Yang and Gelernter2006) and Guindalini et al. (Reference Guindalini, Scivoletto, Ferreira, Breen, Zilberman, Peluso and Zatz2005) for association with the opposite allele.
jEdenberg et al. (Reference Edenberg, Jerome and Li1999).
ADH1B and ADH1C account for approximately 70% of variance in the adult liver's alcohol-metabolizing activity. In the ADH1B gene, SNP rs1042026 was chosen and the A allele assigned as the risk allele based on the work of Macgregor et al. (Reference Macgregor, Lind, Bucholz, Hansell, Madden, Richter and Whitfield2009) and its presence in a haplotype associated with alcohol dependence (Kuo et al., Reference Kuo, Kalsi, Prescott, Hodgkinson, Goldman, van den Oord and Riley2008), but others have indicated that G is the risk allele (Luo et al., Reference Luo, Kranzler, Zuo, Wang, Schork and Gelernter2007). For the second SNP in ADH1B (rs1229984), the G allele is consistently associated with risk for alcohol dependence (see Table 1 for references) and alters the function of the enzyme encoded by the gene as described above.
Within ADH1C, the SNP rs698 was chosen due to the well-documented association of its alleles with alcohol-related behaviors. If a G (risk allele) is present at this SNP, an isoleucine is substituted for valine, resulting in a slower rate of metabolism (Macgregor et al., Reference Macgregor, Lind, Bucholz, Hansell, Madden, Richter and Whitfield2009; Tolstrup et al., Reference Tolstrup, Nordestgaard, Rasmussen, Tybjaerg-Hansen and Grønbaek2008; Way et al., Reference Way, McQuillin, Saini, Ruparelia, Lydall, Guerrini and Gurling2015). For the second ADH1C SNP (rs1614972), the risk allele was assigned as C based on the work of Treutlein et al. (Reference Treutlein, Cichon, Ridinger, Wodarz, Soyka, Zill and Rietschel2009). This work was replicated by Biernacka et al. (Reference Biernacka, Geske, Schneekloth, Frye, Cunningham, Choi and Karpyak2013), as shown in their supplemental table.
A third gene, ADH4, accounts for the remaining 30% (Hurley, Edenberg, & Li, Reference Hurley, Edenberg, Li, Licinio and Wong2002; Li & Edenberg, Reference Li and Edenberg2009). The A allele at rs1126671 changes amino acid sequence with an isoleucine in place of a valine and is consistently associated with risk for alcohol dependence (Luo et al., Reference Luo, Kranzler, Zuo, Yang, Lappalainen and Gelernter2005, Reference Luo, Kranzler, Zuo, Lappalainen, Yang and Gelernter2006, Reference Luo, Kranzler, Zuo, Wang, Schork and Gelernter2007). Finally, SNP rs1800759 was included due to its location within the promoter region (Edenberg, Jerome, & Li, Reference Edenberg, Jerome and Li1999), and an association of the A allele with risk for alcoholism (Grochans et al., Reference Grochans, Grzywacz, Małecka, Samochowiec, Karakiewicz and Samochowiec2011; Preuss et al., Reference Preuss, Ridinger, Rujescu, Samochowiec, Fehr, Wurst and Zill2011).
There is strong agreement in the literature on the relationship between genotypes in these genes and their enzymes’ rate of metabolism of alcohol in vitro (in experiments using purified enzymes or cells in culture). The correlation between ADH genotypes and metabolism in vivo (alcohol content in human breath or in blood samples) is weak (Birley et al., Reference Birley, Whitfield, Neale, Duffy, Heath, Boomsma and Martin2005), reflecting a degree of uncertainty regarding the relationships among ADH genes, biomarkers, and behavior. For example, in at least four publications, the SNP rs1800759 within the promoter region of ADH4 is associated with alcohol-related behaviors: two of these suggest that the A allele is protective (Luo et al., Reference Luo, Kranzler, Zuo, Yang, Lappalainen and Gelernter2005, Reference Luo, Kranzler, Zuo, Lappalainen, Yang and Gelernter2006) and two suggest the A allele is associated with risk (Grochans et al., Reference Grochans, Grzywacz, Małecka, Samochowiec, Karakiewicz and Samochowiec2011; Pruess et al., 2011). Uncertainty regarding how ADH genes may relate to adolescent alcohol behaviors is redoubled by most in vivo research on adults, whose phenotypes are different (primarily more severe) than the relevant alcohol phenotypes for most adolescents, including the outcome studied here.
Although scant literature has identified specific genes related to early use (see review by Meyers & Dick, Reference Meyers and Dick2010), analysis of adolescents from the Collaborative Study on the Genetics of Alcoholism who had had at least one drink by age 18 showed an association between alleles at ADH1B and both age of first intoxication and age of first DSM-5 symptom of alcohol use disorder (Olfson et al., Reference Olfson, Edenberg, Nurnberger, Agrawal, Bucholz, Almasy and Bierut2014). Apart from ADH1B, however, more caution is warranted. Variation in different alcohol use behaviors can be driven by dependence, coping-related behaviors, social motivations, and experimentation.
In sum, although what is known about ADH genes’ importance in metabolizing alcohol strongly supports their status as candidates (see Edenberg & Foroud, Reference Edenberg, Foroud, Sullivan and Pfefferbaum2014; Wall et al., Reference Wall, Luczak, Orlowska, Pandika, MacKillop and Munafò2013; Wang, Kapoor, & Goate, Reference Wang, Kapoor and Goate2012), uncertainty remains about the role of these genes in different alcohol use behaviors. This uncertainty includes individual SNPs. For example, although Kuo et al. (Reference Kuo, Kalsi, Prescott, Hodgkinson, Goldman, van den Oord and Riley2008) found that a haplotype block across ADH1A and ADH1B that included rs10420206, a SNP that we use to characterize ADH1B variation herein, was significantly related to alcohol dependence among a sample of Western European adults (mean age 42 years), they did not find a significant result for the SNP individually. Uncertainty extends to the questions about which human alcohol-related behaviors these genes are related, and under what conditions they may predict such behaviors. For example, the Kuo et al. (Reference Kuo, Kalsi, Prescott, Hodgkinson, Goldman, van den Oord and Riley2008) study referred to immediately above predicts alcohol dependence among adults. Whether specific genes are related to a specific alcohol phenotype may depend on the type and range of drinking behaviors reflected in the measure, as well as by the developmental period of those being studied. It is worth noting that difficulty in defining phenotypes, and the implications thereof for replication, persists for studies of adult alcohol use phenotypes (Ali et al., Reference Ali, Way, Marks, Guerrini, Thomson, Strang and Morgan2015), which have been much more deeply analyzed than adolescent phenotypes.
A fourth gene, aldehyde dehydrogenase 2 (ALDH2), is perhaps the most frequently studied gene for alcohol-related behaviors (Wall et al., Reference Wall, Luczak, Orlowska, Pandika, MacKillop and Munafò2013), but was not included in this study for practical reasons. The minor allele is very rare in European populations; consequently, there was not enough genetic variation in our sample, which was largely of European descent. Moreover, ALDH2 is not a member of the AH gene family, but instead encodes an enzyme that metabolizes the acetaldehyde produced by the ADH enzymes.
By focusing on genes related to alcohol metabolism, this study was able to address two general questions. The first question was: Do genes that have a demonstrated link to alcohol metabolism, and to a lesser degree dependence among adults, confer risk related to alcohol use behaviors across adolescence? The second question was: Do substance misuse preventive interventions moderate the associations between these specific genetic variants related to alcohol metabolism and alcohol use behaviors in adolescence?
Early Versus Middle Adolescent Alcohol Use
Although alcohol use can create risks across adolescence, it appears to be especially problematic during early adolescence. Early adolescent alcohol use, at any level, is linked to concurrent risk behaviors, such as sexual risk taking and school failure (Keyes, Iacono, & McGue, Reference Keyes, Iacono and McGue2007; Stueve & O'Donnell, Reference Stueve and O'Donnell2005). In contrast, during the high school years of middle adolescence, although heavy use is linked to increased risk of suicide attempts (Windle, Reference Windle2004) and motor vehicle accidents (Centers for Disease Control and Prevention, 1991), the occurrence of lower-level drinking behaviors is not thought to be necessarily harmful (Johnston, O'Malley, Bachman, & Schulenberg, Reference Johnston, O'Malley, Bachman and Schulenberg2006).
In addition to links to concurrent negative problem behaviors, early adolescent drinking behaviors, regardless of severity, appear to contribute to the likelihood of future negative outcomes. Early adolescent drinking predicts heavy drinking and problems with alcohol in young adulthood (Lo, Reference Lo2000; Parker, Levin, & Harford, Reference Parker, Levin and Harford1996; Sampson, Maxell, & Doyle, Reference Sampson, Maxell and Doyle1989; Werner, Walker, & Greee, Reference Werner, Walker and Greee1994). More specifically, drinking before age 15 predicts a clear pattern of increased frequency, binging, and alcohol-related problem behaviors and attitudes in young adulthood, with the earliest users, such as those who began at age 13 or younger, exhibiting the worst outcomes (Pikanen, Lyyra, & Pulkkinen, Reference Pikanen, Lyyra and Pulkkinen2005). Similarly, risks for adult alcohol dependence, driving under the influence, injury to self or others while drinking, and taking part in risky behaviors while drinking are at least doubled among those who began drinking at 16 or younger (Hingson & Zha, Reference Hingson and Zha2009).
The variables that predict the occurrence of early adolescent drinking do not necessarily predict the occurrence of midadolescent drinking. Among high-risk youth, for example, early drinking is predicted by greater parental drinking, less bonding to school (Hawkins et al., Reference Hawkins, Graham, Maguin, Abbott, Hill and Catalano1997), antisocial disorders (Clark, Parker, & Lynch, Reference Clark, Parker and Lynch1999), and fighting and aggressiveness (Dobkin Tremblay, & Masse, Reference Dobkin, Tremblay and Masse1995). Early alcohol use among high-risk samples also is linked to a temperamental bias toward risk behaviors, such as greater novelty seeking and lower harm avoidance (Dobkin et al., Reference Dobkin, Tremblay and Masse1995). Results are similar for community samples, where early use is predicted by prior reports of externalizing problems, conduct disorder, and oppositional defiant disorder (McGue, Iacono, Legrand, & Elkins, Reference McGue, Iacono, Legrand and Elkins2001). In sum, alcohol use during early adolescence is linked to a profile of externalizing and poor adjustment across populations (for a review, see Zucker, Donovan, Masten, Mattson, & Moss, Reference Zucker, Donovan, Masten, Mattson and Moss2008).
Viewed through the lens of problem behavior theory (Jessor & Jessor, Reference Jessor and Jessor1977), the empirical links between early adolescent drinking and preceding risk behaviors, concurrent problems, and future problems distinguish it from midadolescent drinking behavior, and make it clear that early alcohol use is a deviant behavior. In contrast, midadolescent alcohol use, at least its initiation and lower levels of use, is considered normative, not deviant (Schulenberg & Maggs, Reference Schulenberg and Maggs2002), appearing to be part of a healthy process of autonomy-seeking and identity development during this stage of adolescence (Johnston et al., Reference Johnston, O'Malley, Bachman and Schulenberg2006).
The acceptance of social alcohol use in middle adolescence, relative to deviance relating to any level of alcohol use in early adolescence, changes the network of encouragements and opportunities encountered by adolescents for alcohol use across these two different periods of adolescence. These differences in norms that either generally discourage or encourage taking part in drinking behaviors may have implications for not only whether individuals try alcohol but also how genetic variance related to alcohol metabolism might impact whether they go beyond trying alcohol to either having more than a few sips or even drinking enough to experience drunkenness. Without the midadolescent encouragement of some alcohol use and the greater opportunities for drinking that come with greater autonomy, the occurrence of initial alcohol use behaviors, from trying alcohol through consuming enough to have ever experienced drunkenness, might be more affected by differences in alcohol metabolizing during early adolescence than the same range of behaviors during middle adolescence.
The idea that the influence of genes may vary across adolescence due to changes in encouragements and opportunities to engage in alcohol use is supported by the developmental psychopathology tenet that time can affect the pattern of influences on behaviors. The aspect of time most directly linked to changes in encouragement to use and availability of alcohol across adolescence is social time, which can modify the character and importance of relationships as a function of the social timetable. Other aspects of time relate to developmental and maturational changes that regulate biological systems across development and may shift the role of specific genes affecting alcohol-related outcomes (see Zucker, Reference Zucker, Cicchetti and Cohen2006). Drawing upon Gottesman and Gould (Reference Gottesman and Gould2003), Zucker (Reference Zucker, Cicchetti and Cohen2006) explained that the risk-dampening/risk-enhancing network affecting alcohol use (and disorders) is not consistent over developmental time.
The shift in the risk-dampening/risk-enhancing social topography across adolescence likely contributes to differences in who drinks earlier versus later. Although heritability studies do not address the role of any given gene, or set of genes, biometric evidence provides two important insights for our study. First, earlier drinking is related to disinhibition-based characteristics (McGue et al., Reference McGue, Iacono, Legrand and Elkins2001). Disinhibitory biases may lead adolescents to overcome early adolescent norms against drinking. Second, the genetic correlation between early drinking and later alcohol use disorders is substantial (.59; Sartor et al., Reference Sartor, Lynskey, Bucholz, Madden, Martin and Heath2009). The Sartor et al. (Reference Sartor, Lynskey, Bucholz, Madden, Martin and Heath2009) finding demonstrates that although age at first drink may have relatively low heritability (see Rose, Dick, Viken, Pulkkinen, & Kapio, Reference Rose, Dick, Viken, Pulkkinen and Kapio2001), the genes biasing individuals toward early use may also contribute to later alcohol use problems.
Applying this idea to the confluence of ADH genes, the occurrence of alcohol use behaviors, and shifting of social norms surrounding alcohol from generally discouraging to encouraging its use from early to middle adolescence, we propose that the impact of ADH genes on the occurrence of ever having tried, had more than a few sips, and having ever been drunk, will be greater in early than middle adolescence.
The PROSPER Substance Misuse Interventions
As demonstrated by Vandenbergh et al. (Reference Vandenbergh, Schlomer, Cleveland, Schink, Feinberg, Neiderhiser and Redmond2016), substance misuse interventions in the PROSPER project can affect associations between specific genetic risk markers and substance use behaviors. This effect is presumptively due to interventions altering the risk-dampening/risk-enhancing network that potentiates or constrains the impact of specific genes on substance use behaviors. PROSPER intervention communities were provided an evidence-based universal family-focused program in the 6th grade and an evidence-based in-school program of each community's choosing in the 7th grade. Mean age of participants at Wave 1 (Fall of 6th grade) was 11.77 years (SD = 0.36), 12.24 (SD = 0.36) at Wave 2 (Spring of 6th grade), and increased by approximate 1 year at each wave through Wave 8 (M = 18.15, SD = 0.35; 12th grade). All 14 intervention communities received the Strengthening Families Program: For Parents and Youth 10–14 as their family-focused program. Approximately 22% of all eligible families across the PROSPER project's two study cohorts participated in the Strengthening Families Program: For Parents and Youth 10–14. For the 7th-grade in-school program, Life Skills Training (Botvin, Reference Botvin, Hansen, Giles and Fearnow-Kenney2000) and Project Alert (Ellickson, McCaffrey, Ghosh-Dastidar, & Longshore, Reference Ellickson, McCaffrey, Ghosh-Dastidar and Longshore2003) were each selected by four teams, and the All Stars curriculum (McNeal, Hansen, Harrington, & Giles, Reference McNeal, Hansen, Harrington and Giles2004) was selected by the other six. The core components of these in-school programs target social norms, personal goal setting, decision making, and peer group affiliation. Lesson activities include participation in question-answer sessions, role-play, and small-group activities. Assignments focused on recognizing and resisting peer pressure, benefits of not using alcohol and drugs, and practicing decision-making skills. Each program was implemented during required classes as part of the 7th-grade curriculum, so nearly all students in participating schools took part. Very high levels of implementation quality were confirmed across interventions and cohorts (Spoth, Guyll, Lillehoj, Redmond, & Greenberg, Reference Spoth, Guyll, Lillehoj, Redmond and Greenberg2007). For program details and implementation information, see Spoth, Greenberg, Bierman, and Redmond (Reference Spoth, Greenberg, Bierman and Redmond2004).
Youth in the intervention conditions of the PROSPER study reported lower levels of use across an array of substances; however, intervention main effects on alcohol, although significant in analyses of the full sample, were modest (see Spoth et al., Reference Spoth, Redmond, Clair, Shin, Greenberg and Feinberg2011, for review). Analyses of a subsample of PROSPER participants who took part in a series of in-home data collections from 6th through 9th grade and provided DNA (N = 545) did not find a main effect of intervention on alcohol use (Cleveland et al., Reference Cleveland, Schlomer, Vandenbergh, Feinberg, Greenberg, Spoth and Hair2015). This analysis used the same alcohol use measure at 9th grade considered in the current analyses across 6th to 12th grades. Most recently, using a sample of PROSPER participants with in-school data similar in size to the sample used here to examine the influence of OXTR gene affiliations with substance-using peers and adolescents’ own alcohol use, Cleveland et al. (Reference Cleveland, Griffin, Wolf, Wiebe, Schlomer, Feinberg and Vandenberghin press) did not find a main effect of intervention on the same alcohol use outcome considered here.
Data from the PROSPER project allowed us to consider whether interventions designed to address social norms, decision making, and peer affiliation can affect associations between genes influencing alcohol metabolism and alcohol use behaviors across early and middle adolescence. Just as the shift in norms from discouraging to encouraging drinking from early to later adolescence, and the related increase in availability may affect associations between ADH genes and variability in alcohol use, PROSPER substance misuse interventions, via impacts on individual adolescents’ ability to resist opportunities to use alcohol and changes in school climate, may also change the impact of ADH genes on alcohol use behaviors. Such findings would help extend G × I research beyond the usual suspect/general actor genes, such as DRD4, that are purported to be involved in G × E due to influencing attention to and perception of environments generally (see Belsky & Pluess, Reference Belsky and Pluess2009, Reference Belsky and Pluess2013).
Similar to other preventive intervention trials (see Bakermans-Kranenberg & van IJzendoorn, 2015), the PROSPER project provides two key advantages in examining gene–environment interplay. The first advantage is the use of school district-level random assignment to intervention versus control conditions. By removing effects of self-selection into the intervention, it also greatly reduces the threat of gene–environment correlation between adolescents’, as well as families’, genetics and intervention exposure. Second, because randomized prevention trial designs provide substantially more power in detecting interactions than cross-sectional studies (see McClelland & Judd, Reference McClelland and Judd1993), analyses using PROSPER's intervention condition have increased power to detect possible G × E interactions compared to analyses based on similarly sized nonexperimental data. For an elaboration on why intervention studies are especially well suited for examining G × E interactions, see Bakermans-Kranenburg and van IJzendoorn (Reference Bakermans-Kranenburg and van IJzendoorn2015).
Research Questions and Hypotheses
Our analyses were designed to separately consider changes in the growth of alcohol use across early adolescence and middle adolescence, determine how genetic variance related to alcohol metabolism influences growth in alcohol use behaviors across these two periods of adolescence, and investigate whether associations between ADH genetic variance and patterns of alcohol use growth are moderated by PROSPER interventions. Hypotheses were as follows: first, we expected the three ADH genes to predict changes in alcohol use across both early and middle adolescence. Given that the norms around the drinking behaviors assessed herein (ever tried, consumed more than a few sips of, or been drunk on alcohol) shift from discouraging to encouraging use, we expected stronger associations between ADH genes and alcohol use behavior during early adolescence than during middle adolescence. Moreover, across the different ADH genes, most support ADH1B’s role in early use. Second, in parallel with findings from Vandenbergh et al. (Reference Vandenbergh, Schlomer, Cleveland, Schink, Feinberg, Neiderhiser and Redmond2016) that PROSPER interventions remove the effects of the CHRNA5 genotype on high school smoking, we expected PROSPER interventions to moderate associations between ADH genes and drinking trajectories, such that associations between genes and alcohol growth will exist among control community adolescents but not among intervention community adolescents. Based upon the prior null results for the effects of PROSPER interventions on the specific alcohol use outcome considered here based on genetic subsamples of PROSPER similar to that examined here (see Cleveland et al., Reference Cleveland, Griffin, Wolf, Wiebe, Schlomer, Feinberg and Vandenberghin press), we do not predict a main effect of intervention condition.
Method
Participants
The PROSPER preventive intervention trial involved 28 communities in rural Iowa and Pennsylvania randomized into control and intervention conditions. Over 10,000 adolescents took part in at least one data collection. Among these, 2,032 PROSPER participants provided buccal swab samples for DNA data collection. DNA was collected at two times. First, DNA samples were collected from 537 participants during the Wave 5 in-home assessment. Second, as part of subsequent data collections during young adulthood, 1,495 additional PROSPER participants provided DNA through the mail. Participants were compensated $25 for participating in DNA collections whether they took place during in-home visit or via the mail.
Of the 2,032 participants who provided DNA, 1,885 participants had sufficient genomic and phenotype data to be included in latent growth curve analyses using full-information maximum likelihood estimation and information on population controls. All analyses in this study were conducted on these 1,885 cases. Reflecting the demographics of the communities from which they were drawn, these participants primarily self-identified as non-Hispanic White (89.8%), with smaller groups identifying as Hispanic/Latino (4.7%), African American (1.9%), Asian (1.3%), or other non-Caucasian (2.4%); 60.2% (N = 1,132) were female. Comparisons between the 1,885 analysis sample participants and the larger population of PROSPER participants (approximately 11,000) revealed few differences. For example, there were somewhat more two-biological parent families among the 1,885 (68.1% vs. 60.7%; Wave 1) and fewer on free/reduced lunch (27.2% vs. 35.0%). The samples were racially comparable (88.8% vs. 83.7% non-Hispanic White). Effect sizes for these differences were small (rs ≤ .06). In addition, analyses were conducted to explore differential attrition between the control and intervention groups across waves by examining the interaction between intervention condition (control vs. intervention) attrition (i.e., missing data at a given wave) in a series of analyses of variance using baseline alcohol use as the dependent variable. The results showed differential attrition only at Wave 5, where control group adolescents with missing data at Wave 5 were higher on baseline alcohol use (M = 0.46, SD = 0.79) relative to intervention adolescents with Wave 5 missing data (M = 0.28, SD = 0.52); F (1, 1,838) = 5.24, p < .05. The effect size for this difference was small (partial η2 = 0.003).
Measures
Alcohol use behaviors
Alcohol use was assessed across eight waves from the following questions asked at each wave: have you ever had a drink of alcohol; have you ever had more than a few sips of alcohol; and have you ever been drunk from drinking alcohol? Each item was answered on a 0 = No, 1 = Yes scale and were summed within each wave (range = 0–3). Cross-wave means ranged from 0.36 (SD = 0.63) at Wave 1 to 2.02 (SD = 1.20) at Wave 8, indicating that the majority of participants had taken part in the assessed alcohol behaviors by the end of high school. Correlations between adjacent time points ranged from .61 to .78. Missing data increased over time due to attrition (33% at Wave 8). To assess the extent of missing data on the repeated measures, we examined the covariance coverage matrix provided by Mplus. Coverage for these data ranged from .59 to .89, which is well above the .10 minimum set for Mplus model convergence (Muthen & Muthen, Reference Muthén and Muthén1998–2015). In addition, differential attrition analyses reported above suggest little to no systematic baseline differences between attritted and nonattrited cases, indicating a missing at random pattern (see Schlomer, Bauman, & Card, Reference Schlomer, Bauman and Card2010). Full information maximum likelihood was used to estimate latent variable growth models in Mplus (Muthen & Muthen, Reference Muthén and Muthén1998–2015), which can reduce bias incurred by possible differential attrition (Schlomer et al., Reference Schlomer, Bauman and Card2010).
Intervention status
In the analytic sample (N = 1,885), 46.7% of adolescents were in the control condition (coded = 0; n = 881) and 53.3% were in the intervention (coded = 1; n = 1,004).
PROSPER genotyping and the multi-SNP ADH gene scores
Genotyping of the PROSPER project focused on selecting markers to characterize genetic variance that affects neurotransmitters (e.g., dopamine) and hormones (e.g., oxytocin) related to the substance use outcomes and social processes targeted by the PROSPER intervention. Both variable numbers of tandem repeats and genes characterized by SNPs were selected. For genes characterized by SNP variation, individual SNPs were selected for genotyping based upon existing research findings, to cover the genetic variance of a given with more than one SNP, and the resources available for genotyping. SNPs were genotyped using the OpenArray system from Life Technologies Inc. (now part of Thermo Fisher, Inc.), which utilizes TaqMan genotyping assays applied to an array.
In the case of the three ADH genes examined in this study, two SNPs for each gene were selected (see Table 1). The six SNPs had success rates of >94%. A subsample of 27% of participants, genotyped previously as part of the in-home subproject with the Affymetrix Exome 319 microarray (see Cleveland et al., Reference Cleveland, Schlomer, Vandenbergh, Feinberg, Greenberg, Spoth and Hair2015), showed a concordance rate of >98%. In the rare cases that were discordant, the genotype from the OpenArray was kept because the OpenArray results could be reviewed for quality. Samples that were discordant and of poor quality on the OpenArray were dropped. Each marker was coded 0 = homozygous nonrisk allele, 1 = heterozygous, and 2 = homozygous risk allele (see Table 1 for risk alleles). An additive coding scheme was chosen to be consistent with GWA studies linking given markers to an alcohol use phenotype(s). The two markers for each gene were averaged to create multi-SNP scores for the three ADH gene with a range of 0 to 2, where a score of 2 indicated an individual carried four risk alleles across the two SNPs in a given gene. Within each of the three scores, SNP values were positively correlated.
Analysis plan
Primary analyses were investigated using a series of piece-wise latent growth models to evaluate changes and levels in alcohol use behaviors across early and middle adolescence. A piece-wise growth model includes two linear slopes with a single intercept. In the current analysis, we modeled growth in alcohol use behaviors during early adolescence (Waves 1–5) as one slope (initial slope; S1) and growth in alcohol use behaviors during middle adolescence (Waves 5–8) as another slope (subsequent slope; S2). These two slopes were joined by a common intercept at 9th grade (Wave 5; I), capturing the level of alcohol use behaviors at the beginning of high school among US adolescents. In addition to being an important transition point, the 9th-grade intercept also allowed each slope to incorporate the same number of years, 6th to 9th and 9th to 12th for early and middle adolescence, respectively. Finally, 9th grade does a good job of distinguishing between the years when drinking is considered to be a substantial risk versus the years when drinking is considered normative.
For our purposes, there are notable advantages to this growth modeling approach over, for example, a nonlinear modeling approach. First, rates of change can be modeled separately for the initial and subsequent slopes. Second, the initial and subsequent slopes can be regressed separately on model predictors (in this case, ADH genes and intervention status) and the associations independently evaluated. Not only does this approach provide greater opportunities to interpret associations between predictors and each linear slope, but they are also more easily interpreted than associations with a single, nonlinear slope. Unlike data-driven approaches such as mixture models, they also allow a priori operationalization of the distinction between early and middle adolescence drinking suggested by the literature.
Presented below are a series of latent growth models that build in complexity. To establish a baseline model for comparison, we first estimated an unconditional growth model comprising alcohol use growth during early adolescence (Waves 1 to 5) and alcohol use growth in middle adolescence (Waves 5 to 8). These initial and subsequent slopes were joined by a common intercept representing mean level of alcohol use in the spring of 9th grade (Wave 5). Next, we tested the main effect of the intervention by adding intervention status as a predictor of the unconditioned parameters. In an additional model, we examined the three AHD gene multi-SNP scores as predictors of each slope and the intercept. Finally, we conducted a multiple group model using intervention status as the grouping variable to examine differential ADH gene effects on alcohol slopes between intervention and control conditions. Bootstrapping was used to obtain parameter distributions and 95% confidence intervals (1,000 draws) of possible population effects for genetic associations (see Schlomer, Fosco, Cleveland, Vandenbergh, & Feinberg, Reference Schlomer, Fosco, Cleveland, Vandenbergh and Feinberg2015). Analyses were conducted using Mplus 7.4 (Muthén & Muthén, Reference Muthén and Muthén1998–2015).
Prior to presenting primary results, descriptive statistics are presented on the distribution of alcohol use behaviors and results from preliminary growth models providing the unconditioned slopes and the intercept. An additional preliminary model, considering the moderation of slopes and intercept by intervention status, is also presented. As noted above, we did not expect significant intervention effects.
Results
Basic genotype descriptive analyses
Information for the three ADH genes used in this study (e.g., symbol, SNP #, and minor allele frequency) is shown in Table 1. All genotypes were in Hardy–Weinberg Equilibrium (all ps > .05). Population stratification was addressed by principal coordinates (PC) analysis using a set of ancestrally informative markers (Halder, Shriver, Thomas, Fernandez, & Frudakis, Reference Halder, Shriver, Thomas, Fernandez and Frudakis2008), and using PLINK 1.9 (see Chang et al., Reference Chang, Chow, Tellier, Vattikuit, Purcell and Lee2015; Purcell & Chang, Reference Purcell and Chang2015; –pca command) to generate PCs representing the major axes of genetic variation in the sample (N = 1,922). The first PC reflected variability in European ancestry (M = –0.0223336912, SD = 0.0045076599; higher scores indicate less European ancestry; Figure 1), while the second PC distinguished African Americans from Latinos and Asians (see Figure 2 for the distribution created by plotting these two dimensions). We used PC1 as a continuous index of non-European ancestry to control for population stratification in all analyses.

Figure 1. (Color online) Principal coordinate 1 values and self-report race/ethnicity.

Figure 2. (Color online) Population structure of the PROSPER respondents with DNA data based upon principal coordinates 1 and 2. The solid line is 0.5 SD below the mean principal coordinate 1 score for all self-report non-Europeans.
Prior to presenting PC1 controlled results, it is useful to use PC1 to describe the pattern of non-European ancestry in our sample. To do so, we first calculated the mean PC1 score for all self-reported non-Europeans (–0.012005, SD = 0.007717; non-Caucasian participants who reported ethnicities other than African American, Hispanic/Latino, or Asian were excluded; N = 45); notable non-European ancestry was designated as the value 0.5 SD below the mean PC1 score of all self-reported non-Europeans (i.e., –0.0158635). Considering this cutoff, shown in Figure 2, offers an opportunity to both understand the genetic ancestry of our sample and to evaluate the adequacy of using either a PC based cutoff, at this value or another, or self-reported race in such a sample to control for population structure.
Based upon this cutoff, among the N = 1,922 participants with PC1 data, 127 could be classified as being primarily non-European in ancestry (compared to 195 who identified via self-report as belonging to a category other than White, such as African American, Hispanic, or other) and 1,795 (compared to 1,727 by self-report) participants as having primarily European ancestry. When comparing genotyped ancestry calculated per above to self-report of ancestry, 8 of 1,727 self-reported Whites were classified as having primarily non-European ancestry. Numbers of individuals genotypically classified as having primarily European ancestry per this cutoff within other groups were as follows: 0 of 35 self-reported Blacks/African Americans, 47 of 89 self-reported Latinos/Hispanics, 5 of 26 self-reported Asians, and 24 of 45 self-reported as other. Thus, as would be expected given the complex admixture of Hispanic populations, the primary differences between self-reports of group membership and ancestry informative marker-derived classification as primarily of European-descent were among self-reported Latinos/Hispanics and others. These findings also demonstrate the potential shortcoming, in this US sample at least, of dropping all those who self-reported as other than White. Of the 195 who would be dropped, 76 would be primarily of European descent based on our cutoff. Similarly, many individuals who would be retained based upon this cutoff self-reported as non-White. Figure 1 shows the overlap in PC1 scores between self-reported Europeans and self-reported non-Europeans. To avoid incorporating this error, we used PC1 as a statistical control, rather than dropping all those self-reporting non-White status or using a PC1 cutoff for this continuous measure of non-European ancestry. To aid model convergence and interpretation of other model parameters, PC1 was multiplied by 100 and mean-centered via standardization.
Preliminary results
Alcohol use across early and middle adolescence
Table 2 provides information on alcohol use rates across Grades 6 through 12. Several aspects of the alcohol use patterns across these years are noteworthy. First, drinking levels increased from near zero in 6th grade (Waves 1 and 2; 0.36 and 0.47), to 1.85 and 2.02 in 11th and 12th grades on a scale from 0 to 3. Across the early adolescent grades, reports of having “tried” alcohol (e.g., 34.2% in Spring of 6th grade) were far more common than reports of having been “drunk” (2.8% in Spring of 6th grade). Even at 8th grade (Wave 4), only 24.9% (14.8 of 59.0) of adolescents who had tried alcohol reported ever being drunk. However, by later grades reports of having been drunk (53% by 12th grade) approached the frequency of reports of having tried (79.7% by 12th grade). Second, the increase in early adolescence, from 6th grade to 9th grade (Wave 5 = 1.43), appeared steeper than in middle adolescence (9th through 12th grade). Third, increases in overall drinking across early adolescence (6th through 9th grade) were largely due to adolescents having tried, which increased from 27.5% to 68.9%, or having more than a few sips of alcohol, which increased from 6.7% to 47.1%. Increases in overall drinking across middle adolescence were due to more adolescents in the 9th to 12th grades reporting having been drunk. These levels are consistent with trying alcohol being normative by 9th grade, but not drinking above that level. Consistent with expectations, higher levels of drinking by adolescents (e.g., more than a few sips and having been drunk) appeared normative by the later grades of high school. For example, having been drunk was nearly as common (53%) in 12th grade as having tried alcohol by 8th grade (59%).
Table 2. Means across waves derived from analytical sample of N = 1,885

Note: The total number (N) sizes are derived from an analytical sample of N = 1,885.
Finally, to determine the degree of clustering within schools for the drinking outcomes, and whether the level of school-level aggregation would require a multilevel modeling approach, interclass correlations were computed. Across the eight data collections, all interclass correlation values were below 0.014, indicating that, at most, <1.5% of the variance in alcohol use could be accounted for by school-level clustering of the outcome. In addition, t tests were run to determine if the multi-SNP scores for the three ADH genes differed across control and intervention conditions, which would indicate that genes are correlated with intervention exposure. The results indicated that gene scores were not significantly related to condition.
Preliminary growth curves and intervention effects
Unconditional growth model
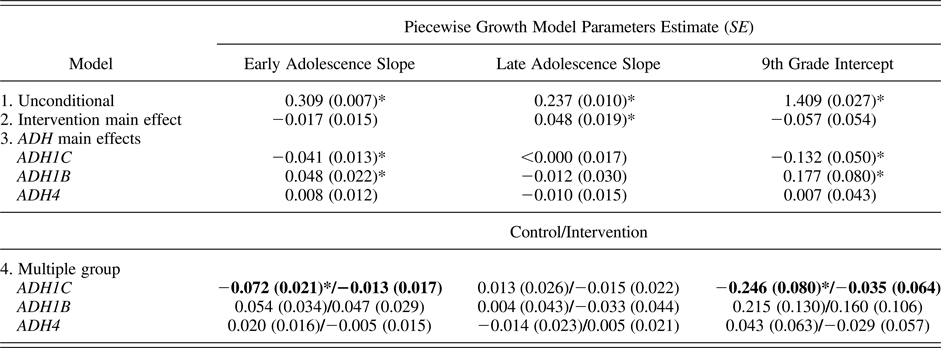
To aid model convergence and develop a model that accurately reflects the data, the unconditional growth model was estimated using an autoregressive residual covariance matrix. Residual covariances were constrained to be equal to preserve degrees of freedom. The piecewise growth model fit the data well, χ2 (26) = 199.34, p < .05; comparative fit index = 0.98, Tucker–Lewis index = 0.98; root mean square error of approximation = 0.059, 90% confidence interval (CI) [0.052, 0.067]. Given the good fit, PC1 was added as a covariate and was included in all analyses reported below. As shown in Table 3, unstandardized model parameters (controlling for PC1) were 0.309 for alcohol use across early adolescence, 0.237 for the middle adolescence slope, and 1.409 at 9th grade (I = 1.409). Consistent with the pattern of means apparent in Table 2, when the two slopes were constrained to be equal, significant model misfit arose, Δχ2 (1) = 25.70, p < .05. This significant χ2 change indicated that alcohol use increased significantly faster across early adolescence than middle adolescence. In addition, PC1 was significantly associated with growth in early adolescent alcohol use (b = –0.015, p < .05) and alcohol use at 9th grade (b = –0.061, p < .05); PC1 was not associated with alcohol use during middle adolescence (b = 0.011, ns). This result is not surprising given that PC1 is an index of European descent: these adolescents generally drink more than do minorities (Cleveland, Zheng, Wiebe, & McGuire, Reference Cleveland, Zheng, Wiebe and McGuire2015).
Table 3. Piecewise growth model results
Note: Estimates for Model 1 are mean slope, intercept, and corresponding standard error. All other estimates are unstandardized regression coefficients (b). Values in bold significantly differ between control and intervention groups. All models include principal component 1 (PC1) as a covariate. ADH1C, ADH1B, and ADH4, alcohol dehydrogenase 1C, 1B, and 4 genes.
*p < .05.
Intervention status
To determine whether intervention status itself was related to increases in alcohol use across early and middle adolescence, intervention status was added to the model as a predictor of early adolescent alcohol use slope, alcohol use at Grade 9, and midadolescent alcohol use slope. Results showed no significant differences between intervention and control adolescents on increases in alcohol use across early adolescence (b = –0.017, ns) or Grade 9 alcohol use (b = –0.057, ns). Intervention status was positively associated with alcohol use change in middle adolescence, however, suggesting intervention adolescents increased their alcohol intake faster during later adolescence than did control adolescents (b = 0.048, p < .05). Taken as a whole, these results are ambiguous. First, means did not significantly differ across control and intervention youth at any grade (results not shown). Second, the means across years for control versus intervention (C/I) youth (e.g., 0.355/0.362 at 6th grade, 1.445/1.415 at 9th grade, and 1.985/2.062 at 12th grade) suggest that the intervention youth are similar to controls in 6th grade, report somewhat less alcohol use by 9th grade, but catch up to normative levels of use by the end of high school.
Primary results: ADH gene impacts on patterns of alcohol use across adolescence
Model 3: ADH1C, ADH1B, ADH4, and alcohol use growth
To determine if ADH genes modified alcohol use patterns across early and middle adolescence, the three ADH gene multi-SNP scores were added, each independently predicting variation in Model 1 parameters. A negative relation was observed for number of ADH1C risk alleles, b = –0.041, 95% CI [–0.067, –0.014], p < .05; whereas ADH1B was positively associated with alcohol use, b = 0.048, 95% CI [0.004, 0.091], p < .05, across early adolescence. Genotype at ADH4 showed no association, b = 0.008, 95% CI [–0.015, 0.030], ns. Similarly, ADH1C was negatively associated with alcohol use at 9th grade, b = –0.132, 95% CI [–0.231, –0.034], p < .05, and ADH1B was positively associated with alcohol at 9th grade, b = 0.177, 95% CI [0.021, 0.3334], p < .05, respectively; ADH4 was not, b = 0.007, 95% CI [–0.078, 0.91], ns. Finally, none of the three ADH genes was associated with the alcohol use slope across middle adolescence (all bs ≤ |0.012|, ns).
Model 4: Differences in ADH between control and intervention
To examine the hypothesis that intervention participation would mitigate the effect of ADH genetic risk on alcohol use growth, a multiple-group piece-wise growth model was conducted using intervention status as the grouping variable (i.e., control vs. intervention). Results among control condition adolescents were as follows: ADH1C was negatively associated with growth in alcohol use in early adolescence, b = –0.072, 95% CI [–0.113, –0.032], p < .05. However, both ADH1B and ADH4 showed no statistically significant association, b = 0.054, 95% CI [–0.011 to 0.120]; b = 0.020, 95% CI [–0.012, 0.052], ns, respectively, with early adolescent alcohol growth. Alcohol use level at Grade 9 was significantly associated with ADH1C, b = –0.246, 95% CI [–0.404, –0.089], p < .05, and not significantly associated with ADH1B, b = 0.215, ns, 95% CI [–0.039, 0.470]) or ADH4, b = 0.043, ns, 95% CI [–0.81, 0.167]. None of the three genes was associated with increase in use across middle adolescence (bs < |0.02|, ns).
In contrast to the control adolescents, there were no significant genetic associations among intervention adolescents. Associations between genes and alcohol use growth during early adolescence were b = –0.013, 95% CI [–0.047, 0.021], b = 0.047, 95% CI [–0.010, 0.103], and b = 0.005, 95% CI [–0.035, 0.024], all ns, for ADH1C, ADH1B, and ADH4, respectively. Likewise, none of the three genes were associated with alcohol use at 9th grade, with nonsignificant associations for ADH1C, ADH1B, and ADH4, b = –0.035, 95% CI [–0.160, 0.091], b = 0.160, 95% CI [–0.047, 0.366], and b = –0.029, 95% CI [–0.141, 0.082], all ns. As in the control and full sample models, ADH1C, ADH1B, and ADH4 were not associated with growth in midadolescent alcohol use (bs ≤ |0.033|, ns).
To test whether the difference in ADH1C associations with alcohol use growth in early adolescence differed in control versus intervention conditions, a model constraining these parameters to be equal across groups was estimated. This model constraint resulted in significant model misfit compared to the model without the constraint, Δχ2 (1) = 4.79, p < .05, indicating that the effect of ADH1C on alcohol use in early adolescence differs between intervention and control conditions. Similarly, constraining the effect of ADH1C on 9th-grade alcohol use also resulted in significant model misfit, Δχ2 (1) = 4.47, p < .05. Although ADH1B parameters for the early adolescent slope were both nonsignificant at the .05 level in control and intervention conditions (bs = 0.054 and 0.047, respectively), these parameters were similar in magnitude to each other and to the full sample parameter (0.048). Although parameter magnitude did not differ in the separate condition compared to the full sample model, the standard errors increased from 0.22 in the full model to 0.34 and 0.29 in the control and intervention parameters.
Follow-up analyses
To better characterize the form of the interactions between intervention status and the ADH genes detected above, we conducted reparametrized regression models as described by Widaman et al. (Reference Widaman, Helm, Castro-Schilo, Pluess, Stallings and Belsky2012) using SAS 9.4 (2012). Intercepts and slopes were exported from the unconditional growth model (controlling for PC1) for use as dependent variables in the reparametrized models. Reparametrized regressions were conducted for the early adolescent slope and Grade 9 intercept using ADH1C, intervention status, and their interaction, given differences in the effect of ADH1C across intervention status reported above. To reduce the number of parameter estimates in reparametrized models, two ordinary least squares regressions were first conducted using ADH1B and ADH4 as predictors of the early adolescent slope and intercept. Unstandardized residuals from the two regressions were saved for use in reparametrized models. Consequently, these analyses controlled for ADH1B and ADH4 in a similar fashion as the growth models above and simplified the reparametrized regression models (Widaman et al., Reference Widaman, Helm, Castro-Schilo, Pluess, Stallings and Belsky2012). The results of the reparametrized model of the early adolescent slope revealed that the intervention and control condition slopes intersected to the right of the ADH1C midpoint, C = 1.18, 95% CI [0.61, 1.75]. Because the value of crossover (1.18) and the upper 95% CI (1.75) were within the range of the independent variable (i.e., ADH1C), a disordinal interaction, consistent with DST, is supported (see Widaman et al., Reference Widaman, Helm, Castro-Schilo, Pluess, Stallings and Belsky2012). A similar result was found for the Grade 9 intercept, C = 1.23, 95% CI [0.54, 1.91].
Discussion
Both the pattern of alcohol use means and the unconditional model results reveal that increases in alcohol use behaviors are steeper in early adolescence than in middle adolescence. Results showing that alcohol use escalates more quickly in early adolescence than later and that these early increases are due to rapid increases in the number of adolescents who transition from never had a drink, to having tried alcohol, to having had more than a few sips, are consistent with prior work. Specifically, from 12 to 15 years of age, the proportion of adolescents who have had a drink increases fourfold, from approximately 10% to 50%. In contrast, over the next 3 years, from 15 to 18 years of age, the proportion of those who have a drink increases relatively less, from 50% to 75% (Substance Abuse and Mental Health Services Administration, 2006). Compared to early adolescence, the number of drinkers who report having been drunk increased at a relatively quicker pace in middle adolescence. This pattern is also consistent with national data (Substance Abuse and Mental Health Services Administration, 2006). These findings document the similarity of drinking patterns in the PROSPER sample, as well as the genetic extension of PROSPER subsample, to national patterns, and demonstrate the generalizability of our findings. That intervention status alone was not significantly related to early adolescent increases and 9th-grade levels of adolescent drinking, although related to differences in slope across middle adolescence, was not surprising given similar null results from prior analyses of genetically informative PROSPER subsamples of in-home (Cleveland, Schlomer, et al., Reference Cleveland, Schlomer, Vandenbergh, Feinberg, Greenberg, Spoth and Hair2015) and in-school participants (Cleveland et al., Reference Cleveland, Griffin, Wolf, Wiebe, Schlomer, Feinberg and Vandenberghin press).
Adding genetic variance to the analyses demonstrated other differences in early versus midadolescent drinking. We found that genetic variance in two of the three ADH genes considered (ADH1C and ADH1B) was linked to differences in growth of alcohol use across early adolescence and the ninth-grade (Wave 5) levels of alcohol use. The direction of ADH1B’s association with increases in alcohol use was in the expected positive direction, indicating that carriers of the putative risk alleles had steeper alcohol use slopes. This finding that ADH1B is positively associated with change in alcohol use behaviors in early adolescence and level of use at ninth grade is consistent with findings from the Collaborative Study on the Genetics of Alcoholism. In that study, adolescents who had had at least one drink by the age of 18 showed an association between alleles at ADH1B and age of first intoxication (Olfson et al., Reference Olfson, Edenberg, Nurnberger, Agrawal, Bucholz, Almasy and Bierut2014). Although prior findings on ADH1C are less certain than those regarding ADH1B, the negative association between ADH1C and early adolescent growth in alcohol use indicated that carrying the putative risk alleles for this gene was linked to a less than average increase in drinking across early adolescence. One might not expect an association of these metabolism genes and a behavior that does not require repeated high levels of alcohol consumption; however, levels of expression of these genes and the enzymes they encode have not been examined across adolescence (Spear, Reference Spear2015). It is possible that differences across development (i.e., ontogeny) in the expression and function of ADH genes might cause adolescent alcohol metabolism to vary from adult rates, making this an important, but unmeasured, aspect of the physiology that underlies these behaviors.
The finding that two of the three ADH genes were related to alcohol use in early adolescence but not middle adolescence is consistent with the developmental psychopathology framework's tenet that time can modify patterns of causal influences. It is unclear, based on the current analyses, what aspect of time is driving these results. The differences may be due to age-related differences in different domains, whether social (e.g., availability of alcohol, and peer relationships), developmental (e.g., cognitive abilities), or biological (e.g., ontological shifts in function), or combinations thereof. On the one hand, that the effects of ADH1C are modified by the intervention may indicate that social processes are critical. On the other hand, that parameters for ADH1B remain constant across intervention versus controls may indicate that the across-adolescence differences in gene relevance might not be moderated by social processes.
In contrast to the significant associations between two of the three ADH genes and increases in alcohol use behaviors in early adolescence, none of the three ADH genes was linked to increased alcohol use across middle adolescence. Although limited to one of the two ADH genes with significant associations, we did find evidence that the PROSPER interventions moderated the impact of ADH genetic variation (in this case, the effects of ADH1C on changing levels of drinking across early adolescence). Specifically, ADH1C was associated with changes in use from sixth to ninth grades and higher levels of alcohol use at ninth grade among control group participants, but not among those in the intervention group. Differences in ADH1C’s association with early adolescence slopes between the control and intervention groups were significant, with the parameter in the intervention group being near zero. This finding demonstrates that interventions can reduce the impact of specific genetic risk on alcohol use.
In contrast to the control versus intervention group differences found for ADH1C, results for ADH1B were largely similar across conditions. As noted, parameters for this gene were similar in magnitude in the full and multigroup models for intervention versus control. The lack of significance for this parameter for each condition as estimated separately in the multigroup model was likely due to the smaller sample sizes created by dividing the full sample into subgroupings for this model.
These results are consistent with the idea that the effect of ADH genotypes is a consequence of differences in rates of metabolism of alcohol, both for the direct effect on drinking and with respect to the interaction with the intervention. It may be that during initial experiences with alcohol (which occur for most adolescents by 9th grade), positive sensations are heightened and/or negative sensations are diminished due to metabolism differences related to genotype. Therefore, allelic differences may influence subsequent alcohol use, even within the range of drinking behaviors examined herein, which does not include frequency of use, let alone problem drinking. The intervention may be mitigating the potential for allelic variation to affect drinking variation in early adolescence by diminishing the likelihood of initiating consumption or reducing the likelihood of continued use after experimentation. In a similar fashion, Vandenbergh et al. (Reference Vandenbergh, Schlomer, Cleveland, Schink, Feinberg, Neiderhiser and Redmond2016) recently showed a clear association between the risk genotype at a nicotinic receptor subunit gene and smoking in control individuals that is not present in individuals who experience the PROSPER intervention (Vandenbergh et al., Reference Vandenbergh, Schlomer, Cleveland, Schink, Feinberg, Neiderhiser and Redmond2016). These tests of interactions between an intervention and a well-characterized functional polymorphism in genes directly related to the action of an addictive drug can offer a useful approach for understanding both how interventions work for different subpopulations as well as how specific genetic variants may contribute to variance in drinking behaviors.
Our findings add weight to the idea that drinking in early adolescence, or at least the patterns of cause contributing to it, differs from drinking during middle adolescence. Two ADH genes, both ADH1C and ADH1B, are linked to levels of alcohol use during early adolescence but not in middle adolescence. This finding shows an important benefit in studying specific genes, which is that they can provide more fine-tuned tools for understanding etiological differences between either similar phenotypes or the same phenotype measured at different times. At the same time, by linking genes associated with adult dependence to drinking during early adolescence, our findings lead to further questions. For example, is the association between early adolescent drinking and later dependence due to a developmental process in which the experience of drinking matters, perhaps by altering biological functions such as reward sensitivity, or even just altering metabolic rates? Are genetic influences on early adolescent drinking and adult dependence the uniting factor, such that the actual experience of early adolescent drinking does not itself cause a greater likelihood of adult drinking problems? See Cleveland and Wiebe (Reference Cleveland and Wiebe2008) for a discussion of genetic influences on versus environmental cascades contributing to escalating substance use behaviors from adolescence to young adulthood.
The results provide mixed support for the argument that the relationship between early adolescent drinking and greater risk of adult problem use and dependence may not be entirely due to the experience of early use leading to later problems (see Ystrom, Kenneth, Kendler, & Reichborn-Kjennerud, Reference Ystrom, Kenneth, Kendler and Reichborn-Kjennerud2014; see also Agrawal et al., Reference Agrawal, Balasubramanian, Smith, Madden, Bucholz, Heath and Linskey2010; Sartor et al., Reference Sartor, Lynskey, Bucholz, Madden, Martin and Heath2009). The positive association between ADH1B and increases in early adolescent use is consistent with the expectation that genetic variants (i.e., putative risk alleles) considered to create risk for alcohol problems in adulthood also increase risk for early use. This gene was similarly related to early use in both control and intervention conditions. In contrast to findings for ADH1B, which were consistent with our understanding of which alleles may convey risk for later alcohol problems, ADH1C’s negative association with early use suggest that this gene does not contribute to early use in the same fashion that it conveys risk for later alcohol problems. It should be noted, of course, that specific gene studies can only contribute in a limited fashion to the question of shared or unshared genetic influences on related phenotypes across the life course. Biometric models, such as those using twins, also are important (see below).
The importance of developmental specificity for candidate gene research
Without a distinction between early versus middle adolescence drinking, we would have likely not found associations with ADH1C and ADH1B. Moreover, if our sample only included middle school adolescents, later negative findings among high school students likely would be viewed as replication failures (incorrectly, we think). Thus, our findings have implications beyond the distinction between early versus midadolescent alcohol use behaviors per se and the role of genes and interventions for these behaviors. Our results underscore the importance of considering developmental context for specific genetic and cG × E research generally. They also call for further study of the ontogeny of ADH genes in humans so that timing of gene expression and behavioral development can be assessed together.
Ambiguity in the literature regarding risk allele determination notwithstanding, thinking about phenotypes also is important when considering the negative association between ADH1C and early adolescent drinking. Early adolescent drinking, while predicting drinking outcomes in adulthood, clearly differs from adult drinking. Early adolescent drinking is more strongly linked to a profile of externalizing than anxiety (Clark et al., Reference Clark, Parker and Lynch1999; McGue et al., Reference McGue, Iacono, Legrand and Elkins2001). In contrast, a substantial portion of adult alcohol use, to the extent that it reflects part of a pattern of dependency, is more often linked to anxiety. Thus, it is clear that measuring drinking at different stages of the life course, adulthood versus adolescence and early adolescence versus middle adolescence, will capture different types of drinking behaviors. It follows, in turn, that these different drinking behaviors across development may be influenced by different social and genetic influences.
Limitations and future directions
This study lacks the type of distinctive measurement necessary to distinguish among drinking behaviors with different etiological pathways. We found that drinking increases more in early than middle adolescence. However, the behaviors that drive those changes are not identical across early and middle adolescence, with transitioning to any use and transitioning to having ever been drunk being more important for changes across early and middle adolescence, respectively. From a measurement perspective, the different levels of drinking, and the behavioral distance between the levels, that contribute to our measure is a limitation. However, this limitation has to be balanced against the challenges of measuring drinking across adolescence, when the levels of drinking vary widely and the importance of collecting similar measures across this timeframe among a large number of adolescents involved in the PROSPER study.
Although the limited scope of the behaviors assessed contributes to analyses being able to consider alcohol use across adolescence, the assessments used narrow the scope of the alcohol behaviors to which findings can be applied. Although our measure including being drunk implies binging and speaks to volume of alcohol consumed, it is important to emphasize that the measure does not provide information on use frequency or dependency. Although the constrained variability in drinking behaviors during early adolescence might require focusing such analyses to middle adolescence, future G × I analyses should consider the frequency and volume of drinking. In terms of future G × I analyses using PROSPER data, it will be especially important to leverage the especially detailed data on drinking included in the young adult assessments.
A related issue is that variation across developmental time and across aspects of the distributional scope of our measure may be intertwined. Adding the measurement specificity necessary to untangle these processes may be a difficult task, especially among community samples of adolescents (in contrast to samples of problem drinkers, who might be recruited into more demanding studies, for instance). Nonetheless, if the goal is to understand the specific processes through which genes and environments coact to contribute to behaviors, it is difficult to imagine this occurring without measuring the behaviors more specifically. To this end, an additional avenue to explore is the use of intensive longitudinal designs (i.e., ecological momentary assessment) to specify within-person processes that may better delineate drinking behaviors that may reflect different etiological processes.
Finally, focusing on a biologically important process helps guide gene selection. This focus does not provide certainty regarding the direction of allele coding, however. An important point about this ambiguity for future studies is that the direction of coding might be different for phenotypes that might superficially appear to be the same, and they might be different in samples with different genetic ancestry. Our goal was to measure variance across purposefully selected genes rather than to select a single SNP with the clearest finding and ignore variance in the rest of a given gene. One alternative at present is to find SNPs across systems based on phenotype “hits” in GWAS (see Belsky et al., Reference Belsky, Moffitt, Baker, Biddle, Evans, Harintno and Caspi2013). Another alternative is to test multiple SNPs in a gene, ignoring their linkage disequilibrium. Although the approach used herein may better characterize gene-level variation than using one SNP per gene, this approach does lead to incorporating lesser studied SNPs, for which the findings in some cases may be less clear than others. For example, Grochans et al. (Reference Grochans, Grzywacz, Małecka, Samochowiec, Karakiewicz and Samochowiec2011) and Preuss et al. (Reference Preuss, Ridinger, Rujescu, Samochowiec, Fehr, Wurst and Zill2011) indicated that A is the risk allele for rs1900759, but this classification is contrary to the protective effect of high enzyme activity associated with the A allele. Other studies have suggested that C is the risk allele (Guindalini et al., Reference Guindalini, Scivoletto, Ferreira, Breen, Zilberman, Peluso and Zatz2005; Luo et al., Reference Luo, Kranzler, Zuo, Wang, Schork and Gelernter2007). Some parts of the Preuss et al. (Reference Preuss, Ridinger, Rujescu, Samochowiec, Fehr, Wurst and Zill2011) article suggest that A might be protective, but other parts indicate that the A allele provides risk. We believe that this limitation is offset by the advantages of being able to examine variance on the gene level linked to biological processes, with functional links to the phenotype being predicted.
Although addressing genetic variance in a specific system with two SNPs per gene is a step forward, it is a very preliminary step toward the goal of incorporating genetic variance into behavioral science in a fashion that captures the complex and dynamic nature of gene-context transactions across development. Progress forward is unlikely to be linear. Different approaches, both data driven, such as genome-wide complex trait analysis (see Yang, Lee, Goddard, & Visscher, Reference Yang, Lee, Goddard and Visscher2011), and biologically informed selection of larger suites of genes, should be considered.
A final limitation relates to representativeness. The PROSPER preventative intervention study collected data in rural Iowa and Pennsylvania, largely populated by European Americans. The sample is representative of these communities, and generalizable to similar contexts. In addition, in light of having relatively few participants with significant non-European ancestry, our G × E findings cannot be generalized to non-European populations.


