


Introduction
Antarctic meltwater ponds are small inland water bodies that form in the depressions on undulating surfaces as a result of ice and snow melt (de Mora et al. Reference de Mora, Whitehead and Gregory1994). They are ubiquitous on the McMurdo Ice Shelf, covering an area of 1500 km2, as well as being found in ice-free areas of Antarctica (e.g. Wharton et al. Reference Wharton, McKay, Simmons and Palmer1985, Vincent & Howard-Williams Reference Vincent and Howard-Williams1986, Howard-Williams et al. Reference Howard-Williams, Vincent, Broady and Vincent1986, Reference Howard-Williams, Pridmore, Downes and Vincent1989, Reference Howard-Williams, Pridmore, Broady, Vincent, Kerry and Hempel1990, Webster et al. Reference Webster, Brown and Vincent1994, Timperley Reference Timperley, Lyons, Howard-Williams and Hawes1997, Healy et al. Reference Healy, Webster-Brown, Brown and Lane2006). The meltwater ponds on the McMurdo Ice Shelf host one of the largest concentrations of non-marine organisms in the southern Ross Sea (Hawes et al. Reference Hawes, Howard-Williams, Schwarz, Downes, Battaglia, Valencia and Walton1997) and exhibit diverse physical and geochemical environments within and between ponds (Wait et al. Reference Wait, Webster, Brown, Healy and Hawes2006). Some meltwater ponds in this area are stratified during winter, with chemical and thermal stratification persisting in some ponds through the summer period (Wait et al. Reference Wait, Webster, Brown, Healy and Hawes2006). Unlike larger Antarctic lake environments, the majority of meltwater ponds freeze solid in winter and fully melt out each summer (Hawes et al. Reference Hawes, Smith, Howard-Williams and Schwarz1999) making this a unique environment exhibiting a significant degree of seasonal change.
The temperature of meltwater ponds controls the presence or absence of liquid water (Howard-Williams & Hawes Reference Howard-Williams and Hawes2007). Consequently, seasonal temperature variation in meltwater ponds, particularly during periods of freeze and thaw, is central to several key physical, biological and geochemical processes. The activity of the microbiological communities that inhabit these ponds also respond to the seasonal cycle of solar radiation and water temperature (Goldman et al. Reference Goldman, Mason and Wood1972, Hawes et al. Reference Hawes, Howard-Williams and Pridmore1993), as temperature plays an important role in the regulation of photosynthesis (Rae et al. Reference Rae, Howard-Williams, Hawes, Vincent, Davidson, Howard-Williams and Broady2000).
Freeze and thaw of meltwater ponds is a direct response to changes in solar radiation and air temperature (Hawes et al. Reference Hawes, Howard-Williams, Schwarz, Downes, Battaglia, Valencia and Walton1997), as in other high latitude water bodies (Cozzetto et al. Reference Cozzetto, McKnight, Nylen and Fountain2006) and cold climate lakes (Kouraev et al. Reference Kouraev, Semovski, Shimaraev, Mognard, Legresy and Remy2007). The basic, generally accepted, model of freeze and thaw is as follows: freezing is initiated at the pond surface in response to a drop in air temperature, then ice grows downward along the temperature gradient between the cold atmosphere and the relatively warm basal pond water (Iliescu et al. Reference Iliescu, Baker and Cullen2002). During the process of freezing, dissolved ions are excluded from the ice and concentrated into the residual water phase eventually forming saline brine with a depressed freezing point (de Mora et al. Reference de Mora, Lee, Grout, Schall and Heumann1994, Marion & Grant Reference Marion and Grant1994, Marion Reference Marion1997, Wait et al. Reference Wait, Webster, Brown, Healy and Hawes2006, Healy et al. Reference Healy, Webster-Brown, Brown and Lane2006). Pond melting is initiated from the base of the pond as air temperatures and solar radiation increase in early summer (Hawes et al. Reference Hawes, Smith, Howard-Williams and Schwarz1999).
This basic model of temperature and chemical change (hereafter referred to as the Top Down Bottom Up, or TDBU model) is consistent with observed meltwater pond behaviour in some cases. For example, migration of the freezing front from the pond surface downwards was observed by Schmidt et al. (Reference Schmidt, Moskal, de Mora, Howard-Williams and Vincent1991) in meltwater ponds at Cape Evans (Ross Island, Antarctica) during winter freezing and in three ponds on the McMurdo Ice Shelf (Hawes et al. Reference Hawes, Smith, Howard-Williams and Schwarz1999). In the latter case, downward freezing was attributed to reducing air temperatures and attenuation of incident radiation penetration due to ice cover (Hawes et al. Reference Hawes, Smith, Howard-Williams and Schwarz1999). However, several observations have been reported that suggest a departure from the TDBU model of the freeze-thaw process.
Although melting was thought to be initiated at the base of the McMurdo Ice Shelf ponds, it was noted that there was ice remaining at the base of one of the ponds in early summer (Hawes et al. Reference Hawes, Smith, Howard-Williams and Schwarz1999). Additionally, imperfect salt exclusion during freezing and the encapsulation of brine inclusions in the ice at the freezing front in McMurdo Ice Shelf ponds resulted in increased conductivity and major ion concentrations with depth in the ice profile (Wait et al. Reference Wait, Webster, Brown, Healy and Hawes2006).
One of the obstacles to understanding meltwater ponds has been the lack of detailed temperature data over a full annual cycle, particularly data relating to thermal gradients with depth. Consequently, the physical process by which ponds undergo cycles of freezing and melting, and how this may deviate from the TDBU model described above, remains poorly understood. The presence of more complex thermal gradients in summer and winter would make the prediction of winter brine chemistry more difficult, therefore limiting our understanding of ecosystem functioning and the tolerance of biota to winter extremes. Deviation from the TDBU model of pond thaw behaviour during early summer melt is also likely to affect the development and persistence of summer stratification, which again would affect biological processes.
In this study a high-resolution record of pond temperature gradients has been collected from Skua Pond, a McMurdo Ice Shelf pond near Bratina Island, over a period of 10 months. For the first time, pond water chemistry has been interpreted in the light of measured seasonal variations in pond temperature and visual observations of the pond during freeze-thaw. The hypothesis was that the thermal gradients developed within meltwater ponds during freeze/thaw differ significantly from those predicted using the accepted, TDBU model of this process. In turn, this will influence the development and persistence of chemical stratification and mineral precipitation.
Sampling techniques and analytical methods
The location of Bratina Island (78°S 166°E) and the ponds included in this study are shown in Fig. 1. On 27 February 2005, eight Campbell Scientific CS107 temperature probes were deployed in the centre of Skua Pond, to measure water temperature at heights of 10, 20, 40, 60, 80, and 100 cm above the base of the pond (the maximum pond depth was 110 cm when fully melted) and air temperature 120 and 140 cm above the base of the pond. Measurements were recorded by a Campbell CR10 data logger at hourly intervals from 27 February 2005, then three hourly from 2 April 2005 to 1 October 2005, and then hourly again until the download of data on 18 December 2005.

Fig. 1. Locality map for Bratina Island, Antarctica (inset) and the meltwater ponds referred to in this study (shaded) (modified from Wait et al. Reference Wait, Webster, Brown, Healy and Hawes2006).
Water sampling was undertaken in December 2005, soon after the ponds had melted, and again in late January 2007, when the ponds had been fully melted for some time. In 2005, the study ponds were selected on the basis that they were stratified and fully melted; in 2007 the same ponds were re-sampled along with several new ponds. Using portable meters, vertical profiles of conductivity, dissolved oxygen and redox (2007 only) were measured in situ at the deepest part of five ponds (all stratified) in December 2005 and in seven ponds (five stratified and two mixed) in January 2007. In December 2005, additional conductivity profiles were taken in seven ponds that had not completely melted and contained residual ice near the base of the pond. Water samples (60 ml) were also collected from the water column for hydrogen sulphide (H2S) analysis, and preserved using 1M Zn acetate. The samples were later analysed using the methylene-blue colorimetric method (APHA 1999), with a detection limit (after pre-concentration of the samples) of 0.005 mg l-1 and precision of approximately 0.001 mg l-1.
Results
Seasonal temperature variation
The high-resolution record of surface air temperatures and pond temperatures collected from representative water depths in Skua Pond for 294 days during 2005 is shown in Fig. 2a & b. This record spanned the freezing and thawing period in the pond, with pond temperatures ranging from a high of 10.3°C (measured 10 cm above the base of the pond in late April) to a low of -41.8°C (at the pond surface in mid August) giving an annual temperature range of 52.1°C within the pond. Air temperatures at the surface of the pond ranged from above 0°C in summer to a winter low of -46.6°C.

Fig. 2. a. A high resolution record of air temperature was recorded 120 cm and 140 cm above the base of Skua Pond from 27 February to 18 December 2005. b. The temperatures in the water column were measured 10, 20, 40, 60, 80 and 100 cm above the base of Skua Pond for the same period.
Within the pond, strong seasonal cycles were demonstrated as well as temperature fluctuations that occurred over periods of days to weeks, and even distinct diurnal cycles that showed hourly changes (particularly evident in Fig. 3a & b which provide a magnified record during the freezing and thawing phases). The significance of seasonal weather patterns were also evident when surface air temperatures increased by approximately 30°C over a period of about 15 days in mid to late June (around 3000 hours on Fig. 2b).

Fig. 3. The temperature profiles recorded in Skua Pond in 2005 during a. freezing (late February–mid June), and b. thawing (October–December).
During the freezing phase, between late-February and May (0 to 2200 hours, Fig. 3a), the temperature measured near the bottom of the pond was largely unresponsive to the rapidly dropping temperatures in the surrounding environment. During this period, substantial vertical thermal gradients were evident within the water column. The greatest thermal gradient occurred in late April (1285 hours) with a temperature gradient of c. 35°C measured through the water column, just before the period of complete darkness began. For the majority of the year the surface layer of the pond was considerably colder than the basal layers, with the exception of brief periods over winter when the pond exhibited an inverted temperature gradient (e.g. 2975, 3500, 4160 and 4805 hours, Fig. 2b). In winter, the temperatures in the pond were strongly correlated with those in the air above.
Water temperatures during freeze and thaw
The temperature data collected for the period during which the meltwater pond actively began to freeze (mid February to May) is shown in Fig. 3a. During the first 500 hours (up to mid March), the pond temperature record showed the near surface layers (100 cm and 80 cm above the base of the pond) cooling steadily and falling below 0°C early in this period. Conversely, the water layers 60 cm and below showed only weak cooling and, after approximately 250 hours, the temperature effectively stabilized well above 0°C. The exception to this behaviour was exhibited by the record 20 cm above the base of the pond, which fluctuated between 0°C and 5°C.
At approximately 570 hours the temperature 10 cm above the base of the pond began to increase from 4.1°C, to a maximum temperature of 10.3°C at approximately 1270 hours (mid to late April). During this 30 day heating period, the temperature at the base of the pond increased by c. 6°C, at a time when the majority of the pond water was cooling rapidly.
The temperatures recorded at various pond depths during thawing, through October to the end of the record (i.e. from 5500 hours onwards), are shown in Fig. 3b. The complexity of seasonal temperature change during this time is clearly evident. As observed during freezing, the temperatures at the base of the pond appeared to respond quite differently to the near surface water temperatures. Initially, the base of the water column was the coldest layer in the pond but then warmed rapidly and was the first layer to exceed 0°C (at 6170 hours). For the later half of November, both the surface of the pond and the water column 40 cm above the base of the pond showed the least warming, remaining colder than the rest of the pond.
From around 6400 hours (late November) the majority of the ponds water column was > 0°C, even though the surface air temperatures remained below freezing point. For most of December, the water column exhibited a temperature maximum varying between 7.5°C and 9.5°C at mid depths (20–60 cm above the base of the pond) with colder layers above and below (generally < 2°C). At the time of the data download Skua Pond was observed to be 100% ice covered with weak “candled” ice (thin vertical candle-like ice crystals).
Field observations of meltwater ponds during thaw (December 2005)
In December 2005, the meltwater ponds near Bratina Island were in different stages of melt. Across a small area (see Fig. 1), ponds ranged from being 100% covered in ice, with an unknown ice volume (e.g. Permanent Ice Pond and Duet Pond), to fully melted with 0% ice cover, and no ice volume (e.g. P70E Pond). In Cripple Creek and Skua Pond, surface ice remained in the centre of the pond, with a fully melted moat around the pond edges. In both of these ponds, the surface ice appeared fixed near the centre of the pond, suggesting that it was attached in some way to the base of the pond. As melting progressed, the surface ice became free-floating allowing it to be blown across the pond surface according to the prevailing wind direction.
In many ponds, seven of which were profiled for conductivity (see Table I), a submerged layer of ice occurred approximately 10–40 cm above the base of these ponds during thawing, trapping liquid brine beneath it. This ‘ice plug’ was frozen in place where the ice made contact with the edge sediments. During the 10 days in the field, the ice plugs gradually melted away from the sides of all but one of these ponds (Orange Pond) until it became detached and floated to the pond surface. Once the ice plug was released, the ponds showed visual characteristics of stratification (as noted by Wait et al. Reference Wait, Webster, Brown, Healy and Hawes2006), such as the greenish viscous appearance of water in the deepest section of the pond.

Fig. 4. a. Conductivity profiles in the water column of Huey Pond overlying an ice plug and immediately post ice plug melting in midsummer, and once again in late summer, illustrating the importance of the ice plug in the development of chemically stratified ponds in summer. b. Hydrogen sulphide concentrations in VXE6, Upper, Eggtimer and Orange Pond in late summer 2007 when the ponds were fully melted. c. Hydrogen sulphide concentrations persist despite summer basal brines that are typically supersaturated with dissolved oxygen for the given water temperature.
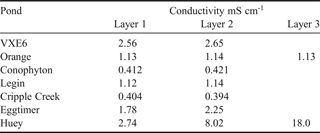
Table I. Conductivity measured in selected ponds containing an intact ice plug on the 21 December 2005. Measurements were taken in situ 10 cm below the pond surface in the centre of the pond (Layer 1), immediately overlying the ice plug in the centre of the pond some distance below the pond surface (Layer 2) and at the contact between the edge of the ice plug and the pond sediment adjacent to the basal brine (Layer 3).
Water chemistry during the thaw and summer period
In ponds with an intact ice plug (December 2005), the water column overlying the ice was generally well mixed with little or no increase in conductivity adjacent to the ice plug surface (Table I). The exception to this was measured in Huey Pond where the water column showed increased conductivity adjacent to the ice plug due to partial melt of the ice away from the edge sediments. Figure 4a shows conductivity profiles in Huey Pond at various stages of melt, illustrating the importance of the ice plug in creating chemical stratification. Once the ice plugs had floated to the surface of the ponds, strong conductivity stratification was evident (e.g. 4.8 mS cm-1 at the surface of VXE6 Pond increasing to 75 mS cm-1 at the base, see Table II). Table II summarizes selected geochemical characteristics of the study ponds after full thaw had occurred for 2005 and 2007.
Table II. Selected geochemical properties of the seven meltwater ponds included in this study measured in December 2005 and late January 2007. The ponds were fully melted at the time of sampling.

nd = not detected, nm = not measured, * indicates the pond was not stratified at the time of sampling, and only a single representative sample was taken from the mixed water column.
Anoxic conditions and the presence of H2S at the base of the ponds in December 2005 (Table II and Fig. 4b & c) showed that the basal brines had been physically and chemically isolated from the fully melted, oxygenated water column above the ice plug. In Huey Pond and Upper Pond basal water samples were taken soon after the ice plug release; concentrations of H2S were 14.8 mg kg-1 and 0.2 mg kg-1 respectively and dissolved oxygen concentrations were low but measurable (1.27 mg l-1 in Huey Pond and 1.0 mg l-1 in Upper Pond).
In late January 2007, conductivity stratification was still present in five of the seven study ponds. In the five ponds that were profiled in both years, the conductivity and thickness of the brine layer was reduced in 2007 compared to 2005 (with a maximum conductivity of 36.1 mS cm-1 compared to 75 mS cm-1 and a maximum thickness of 0.17 m compared to 0.32 m in 2007 and 2005 respectively, see Table II). Detectable levels of H2S (ranging from 0.02 mg kg-1 to 0.33 mg kg-1, see Table II) were present in some stratified brines despite their saturation (or over saturation) with dissolved oxygen (Fig. 4b & c). This co-existence of oxygen and H2S is very unusual.
Discussion
Factors controlling meltwater pond temperatures
Regional climate is the primary influence on changes in pond temperature. Data from the automatic weather station (AWS) Pegasus North (http://amrc.ssec.wisc.edu/aws/archive/Pegasus_Narchive.html - 30.05.07) on the McMurdo Ice Self (77.95°S, 166.50°E, 8 m elevation), c. 23 km from Bratina Island, shows that regional air temperature changes coincide with changes in pond temperature in Skua Pond, confirming the dominance of a regional weather effect rather than localized or micro-scale events.
Data from the Pegasus North AWS show that periods of rapid warming coincide with strong (> 10 m s-1) wind events, particularly from a southerly direction (inland) suggesting that warming events are caused by föhn or katabatic winds moving through the region from more elevated inland areas (Nylen et al. Reference Nylen, Fountain and Doran2004). These events were particularly apparent in the pond record during winter as they caused pond temperatures to increase by up to 24°C in a single event (e.g. 2975–3205 hours). The rapid response of the surface ice resulted in short periods of normal temperature stratification in the pond. There was evidence of at least six of these rapid warming events during winter 2005 (see Fig. 2b).
A strong diurnal temperature signal was visible in the pond temperature record during the periods when 24 hour daylight was present (before 500 hours and after 5000 hours in the record). These diurnal changes are related to the change in solar energy flux during the day, with topographical shading and cloud cover potentially contributing to the variation (Vincent Reference Vincent1988). Interestingly, even during periods with only partial darkness (approximately 500–1500 hours and 3450 to 5000 hours in Fig. 2b), the solar energy was sufficiently weak that the temperature signal within the pond no longer exhibited a significant diurnal signature. In the absence of a solar energy flux during the complete darkness of winter, variation in pond temperature was governed by air temperature alone.
Pond temperature, driven by air temperature, ultimately controls the freeze and thaw processes and the presence, or absence, of ice at different times of the year. In turn, ice cover affects geochemical and ecosystem processes by influencing mixing, sedimentation and radiative transfer, as well as physiological characteristics of microbial communities (Fritsen & Priscu Reference Fritsen and Priscu1999). Temperature also plays an important role in determining the physical properties of the water within the pond contributing, along with salinity, to the density of water and consequently to convection within a pond. Therefore, pond temperatures play a direct role in determining the presence, or absence, of stratification.
Four distinct phases, representing the seasons, occur annually within meltwater ponds, three of which are illustrated in the temperature record presented here. These four phases consist of a freezing phase, a winter phase, a thaw phase and a summer phase (not measured here) all of which show unique temperature variation reflecting the physical processes operating in the pond at that time. Each of these phases has a significant influence on the geochemical processes occurring at that time.
The freezing phase
As temperature and the intensity of solar radiation decrease towards the end of summer, ice begins to form on the surface of the meltwater ponds and freezing commences. An important process that occurs as the meltwater freezes is the release of latent heat, the energy released when water changes state to form ice. The latent heat of fusion influences meltwater pond temperatures, having reportedly caused the delay of microbial mat freezing in high latitude northern hemisphere ponds (Mueller & Vincent Reference Mueller and Vincent2006). It has also been identified as the additional source of heat at the ice-water interface in mid latitude ponds (Rogers et al. Reference Rogers, Lawrence and Hamblin1995). A slight increase in water temperature, immediately prior to freezing in several McMurdo Ice Shelf ponds has been previously attributed to the release of latent heat of fusion (Hawes et al. Reference Hawes, Smith, Howard-Williams and Schwarz1999).
In order to appreciate the extent to which the latent heat of fusion has contributed to the temperature variation measured during freezing in Skua Pond, a simple heat budget has been calculated. This heat budget considers only the first 1000 hours of the temperature record and makes the following assumptions: heat transfer in the pond is one-dimensional (heat transfer through the sides of the pond is ignored) and the base of the pond is a no-flux boundary; the heat loss through the pond surface is by diffusion alone and the upper layers of the pond are the first to begin freezing; and the top 60% of the pond is assumed to be frozen by the end of the 1000 hour period as suggested by the temperature record (Fig. 2b). The physical properties of water and ice are as given in Table III, and the fully melted water depth is taken to be 110 cm.
Table III. Physical properties of water and ice used in the heat budget calculations and mathematical models.

An estimate of the temperature gradient at the surface of Skua Pond was based on the difference in temperature between the two near surface temperature probes (100 cm and 80 cm above the base of the pond), which varied over the 1000 hour period but averaged around -25°C m-1. Thus the heat loss through the pond surface is estimated as 60 W m-2, corresponding to a heat loss of 2.2 × 10⁸ J m-2 over the 1000 hour period.
To determine the heat loss from the residual water phase within Skua Pond as it cooled, approximate values from the temperature record were used. The top 60% of the water column that was assumed to freeze, cooled by approximately 5°C in its liquid state, before cooling a further 8°C in its solid state. Therefore the latent heat of fusion released by the upper 60% of the water column that changes state during the 1000 hour period is 2.2 × 10⁸ J m-2 (based on the values given in Table III). The lower 40% of the water column that remained liquid dropped in temperature by c. 3°C. As a result, the heat lost from cooling is c. 3.0 × 10⁷ J m-2. This value, while approximate, is nearly an order of magnitude smaller than the calculated heat flux through the surface of the pond. It is clear from these calculations that the latent heat of fusion accounts for the majority, if not all, of the heat lost from the meltwater pond during the freezing process.
Some of the energy derived from latent heat of fusion may have been available to heat the residual fluid underlying the ice in Skua Pond. This would explain the c. 6°C increase in temperature recorded at the base of the pond (10 cm above the sediment) while the majority of the water column exhibits cooling (see Fig. 3a). Although latent heat released at the freezing front would slightly increase the temperature of the interfacial fluid, there is potential for this heat to be quickly transported to the underlying fluid through convection. The gravitational instability of the fluid at the freezing front and consequent convection is due to the exclusion of salt from the growing ice. An approximate calculation of the energy required to heat a 10 cm layer at the base of the pond by 6°C (the amount suggested by the temperature record) yields a value of 2.5 × 10⁶ J m-2. Therefore only a very small proportion of the latent heat released, needs to be transferred to the basal fluid in order to account for the warming behaviour observed between 500 and 1270 hours. Consequently, the release of latent heat is thus an important process during meltwater pond freezing with significant implications for geochemical and biological processes.
The winter phase
From mid April to mid November, temperatures in the water column in Skua Pond were below freezing and the majority of the pond was assumed frozen (allowing for the possibility of a small volume of basal brine). During this period, temperatures within the water column were driven by changes in air temperature at the pond surface. The close relationship between air temperature and pond surface temperature can be seen by comparing Fig. 2a & b. Figure 2b also shows the response of the underlying layers of ice in the pond as changing air temperatures were communicated downwards. Alternate periods of normal and reverse vertical temperature gradients in the record reflected the interchange between regional warming and cooling events.
A simple one-dimensional diffusion model is proposed here as a tool for exploring the thermal behaviour of the pond in response to the major warming and cooling events observed during the winter period. The model assumes that molecular diffusion occurs vertically through a homogenous layer of ice, a no-flux boundary condition exists at the base of the pond, the thermal forcing at the pond surface is sinusoidal, and initially the pond ice is assumed to be isothermal in equilibrium with the air temperature. The small layer of liquid brine that may be present beneath the ice at the base of the pond during winter is ignored. Mathematically this model can be stated as
with
where T is the temperature within the pond, t is time, x is the vertical coordinate (distance) measured from the base of the pond, κ is the thermal diffusivity of ice, d is the depth of the pond, T 0 is the initial temperature of the ice and air, T 1 is the amplitude of the thermal forcing at the surface and ω is the frequency of the forcing.
An eigenfunction expansion solution to this problem is given by
![\eqalign{T \lpar x\comma \; t\rpar &= T_0 + T_1 \sin \omega t \cr &\quad + T_1 \sum_{n=0}^\infty {4\lpar -1\rpar ^n \over \lpar 2n + 1\rpar \pi \,\lpar 1 + \lpar \lambda_n^4 / \omega^2\rpar\rpar } \cr &\quad \times \left[{\lambda_n^2 \over \omega} \left(e^{- \lambda_n^2 \lpar \kappa t / d^2\rpar } - \cos \omega t\right)- \sin \omega t\right]\cos \left(\lambda_n {x\over d}\right)}](https://static.cambridge.org/binary/version/id/urn:cambridge.org:id:binary:20160203095011608-0188:S0954102009001904_eqn5.gif?pub-status=live)
where
Diffusion problems of this sort, where one boundary is sinusoidally forced, are known to exhibit certain characteristics. The thermal response below the surface will have reduced amplitude when compared to the surface forcing itself, and this amplitude decays with distance below the surface, and with increasing forcing frequency. In addition, the maximum/minimum temperature within the ice lags behind that at the surface with the lag reducing as forcing frequency and distance below the surface decrease.
The appropriateness of this model can be tested by comparing the predicted lag between the surface of the pond and the base of the pond, with the lag measured in the field. For this purpose three surface warming events (W1, W2 and W3) and four surface cooling events (C1, C2, C3 and C4) during winter were selected from the temperature record. For each event the forcing frequency, ω, was estimated from the field record, and the phase lag between the temperature maxima/minima at 100 cm and 10 cm above the base of the pond were noted. In each case the air temperature, and ice temperatures throughout the pond, were initially approximately the same. These values, together with the phase lag predicted by the mathematical model using the measured forcing frequencies, are given in Table IV.
Table IV. Phase lags between thermal maxima and minima at 100 cm and 10 cm above the base of the pond from field measurements and model predictions. H1, H2 and H3 are heating events and C1, C2, C3 and C4 are cooling events. Δtm is the phase lag predicted by the mathematical model and Δtf is the phase lag measured in the field.

Average ratios of the predicted phase lag to the measured phase lag for the warming and cooling events were 0.96 and 1.50 respectively. This provides strong support for the underlying assumption that diffusive processes can account for the heat transfer through the ice column during warming events. However, the ratio was significantly different during cooling events where the model consistently predicted phase lags greater than those measured in the field.
Heat transfer could occur more rapidly during surface cooling events due to the presence of the vertical brine channels within the ice, reported in Wait et al. Reference Wait, Webster, Brown, Healy and Hawes2006. During cooling events, colder temperatures at the pond surface may lead to weak convection within the channels, increasing the rate of heat transfer to the pond layers below. During a warming event this mechanism is unavailable due to the stabilizing nature of the normal temperature gradient (warmer temperatures overlying relatively cold temperatures). The effectiveness of these brine channels in the heat transfer process will depend on the physical characteristics of the brine channels, such as their diameter, the vertical distances over which they form a coherent conduit, and the viscosity of the brine within them. Consequently, it is not possible to incorporate this mechanism into the mathematical model. However, the likelihood that convection occurs within the brine channels during cooling events is significant in that it leads to the possibility of secondary brine evolution within these channels.
The thaw phase
The temperature profile shown in Fig. 3b illustrates the complex thawing process that takes place in the pond during melting. While surface cooling is the primary mechanism driving the freezing process, the pond warming and melting process is controlled by a combination of increasing air temperatures and an increase in solar radiation.
In very early summer, temperatures near the surface of the pond rapidly increased in response to rising air temperatures, with the deeper layers in the pond following this overall warming trend through the process of molecular diffusion of heat (as in the winter phase). This resulted in the longest period of normal temperature stratification observed in the record (Fig. 3b). Occasional atmospheric cooling events occurred during this period, as well as diurnal temperature fluctuation, preventing a monotonic increase in temperature (Fig. 2a).
The temperatures at the base of the frozen pond (i.e. 10 and 20 cm above the base of the pond) respond more rapidly to the warming than those some distance above. This reflects the greater concentration of brine channels in these layers, the possibility of a small volume of basal brine and the depressed freezing points that correspond with these fluids (Wait et al. Reference Wait, Webster, Brown, Healy and Hawes2006). Therefore little heat is required to transform the saline ice (or ice with significant interstitial brine channels) to a liquid state and latent heat of fusion is not required to raise the temperature above the melting point. Wait et al. (Reference Wait, Webster, Brown, Healy and Hawes2006) reported liquid brine with a temperature of -18°C at the base of Skua Pond in mid October 2001. In the temperature record presented here, the base of Skua Pond approaches temperatures of -18°C at around 5680 hours (22 October) (Fig. 3b), and it is expected that from this time onwards there may be liquid brine present at the base of the pond. Once liquid is present at the base of the pond it will continue to adsorb heat allowing further temperature increases to occur.
The amount of heating generated by the absorption of solar radiation is expected to decrease with depth as a greater thickness of overlying ice will result in a greater degree of attenuation (Vincent et al. Reference Vincent, Rae, Laurion, Howard-Williams and Priscu1998). Significant seasonal changes occur in the optical properties of surface ice in some Antarctic lakes when the ice nears 0°C (Fritsen & Priscu Reference Fritsen and Priscu1999). This phenomenon includes ice “whitening”, and the formation of candling features, which result in increased attenuation of radiation and an increase in albedo during midsummer when radiation is at its peak (Fritsen & Priscu Reference Fritsen and Priscu1999). “Meteoric” ice, formed by melting and refreeze of the snowpack on top of a pond also results in opaque ice due to the high density of air bubbles trapped in the ice (Iliescu et al. Reference Iliescu, Baker and Cullen2002). In addition to the properties of ice that influence solar radiation absorption, the amount of wind blown sediment on or in the pond ice can effectively offset any attenuation (Vincent Reference Vincent1988).
By early November (6000 hours) the rise in air temperature above the surface of the pond had slowed but temperatures measured within the pond continued to increase due to the absorption of solar radiation by the ice, water column and underlying sediments. As thawing of the pond progressed, a pronounced temperature maximum developed 20 cm and 60 cm above the base of the pond (from approximately 6350 hours, Fig. 3b) suggesting that the absorption of solar radiation down to this level was strong. From this time, temperatures in these layers exceeded 0°C and presumably the ice had melted. In contrast, the layer 40 cm above the base of the pond was frozen during the winter months and likely to have fewer brine channels, therefore latent heat of fusion must be supplied before melting can occur. This explains the presence of the ice-plugs observed to remain partway through the water column in ponds that are otherwise fully thawed. Consequently, latent heat plays an important role in determining temperature profiles in meltwater ponds during the thawing phase where the supply of this additional energy is required to bring about the change in phase from winter ice to summer meltwater.
From 6600 hours, the water column 40 cm above the base of the pond also exhibited a temperature maximum, possibly indicating that the middle layers in the pond were mixed. Despite strong absorption of solar radiation in the layers above 60 cm, the thermal gradients in the record suggest that the proximity to the pond surface and the lower air temperatures above the pond results in diffusive heat loss through the pond surface. Consequently, absorption of solar radiation is less effective at warming the ice 80 and 100 cm above the base of the pond.
A conceptual model of meltwater pond freeze and thaw
A key finding of the results presented here is that the process of freezing and thawing in meltwater ponds near Bratina Island differs from the accepted TDBU model (e.g. Hawes et al. Reference Hawes, Smith, Howard-Williams and Schwarz1999), particularly during the period of pond melt. By correlating physical and chemical observations of meltwater ponds in various states of freeze and thaw with the high resolution record of temperature throughout the year, a new conceptual model of the freeze and thaw process has been developed (Fig. 5). This model illustrates how chemical stratification is set up during freezing and how stratification may be maintained during summer melt.

Fig. 5. Conceptual model of the freeze-thaw process in meltwater ponds and the development of stratification (density of shading reflects the salinity of the water, while white represents ice). Freezing commences in a fully mixed melted pond (a.) from the top down, in response to decreasing air temperatures, excluding salt to form a basal brine (b.–d.) that may or may not freeze (e.). Melting occurs from the base up and sides in (f.–i.) to form an ice plug (j.) which eventually floats to the surface (k.) and melts away leaving a stratified melted pond (l.).
Initially, ice forms at the surface of a fully melted pond in response to a drop in air temperature (Fig. 5a & b). As air temperatures continue to fall the volume of ice increases, growing progressively downwards. During the ice formation process, the majority of salts are excluded and the remaining liquid becomes increasingly saline until dense basal brine is formed (Fig. 5c & d). An increase in basal water temperature may occur due to the release of latent heat.
Basal brine may or may not freeze (Fig. 5e), as the freezing point will depend primarily on the salinity of the brine. There is also the possibility that the brine may become super-cooled, remaining as a liquid below its equilibrium freezing point. Schmidt et al. (Reference Schmidt, Moskal, de Mora, Howard-Williams and Vincent1991) recorded minimum temperatures of -12°C and -13°C at the base of the two ponds at Cape Evans, Ross Island, before the ponds froze solid between midwinter and late November. Others have recorded temperatures as low as -20°C and -22°C in liquid brines of 111 mS cm-1 and 148 mS cm-1 respectively (Healy et al. Reference Healy, Webster-Brown, Brown and Lane2006; Wait et al. Reference Wait, Webster, Brown, Healy and Hawes2006). The ultimate state of the brine at the base of Skua Pond during the recording period is unknown, but the ability of basal brines in meltwater ponds to freeze solid during winter appears to depend upon a combination of factors including the initial composition of the pond, the effectiveness of salt exclusion, the salinity of the basal brine and the depth of the pond which will determine the degree of insulation provided by the ice column overlying the brine.
Meltwater pond thawing occurs due to the absorption of solar radiation by the ice and the sediments lining the base of the pond. Early melting occurs at the sediment-ice interface in shallow areas of the pond and increases inwards both vertically and horizontally towards the centre of the pond (Fig. 5f & g), most likely caused by the convection of warmer fluids. This results in a stem of ice connecting an ice plug to the surface ice during the early thaw period (Fig. 5 h). This stem eventually snaps or melts away, followed by melting of the surface ice to leave just the ice plug near the base of the pond (Fig. 5i & j). The effect of this thawing phenomenon is significant in that the ice plug separates the winter basal brine from the overlying water column and helps to protect the brine from wind induced mixing and diffusion. Once the ice plug melts away from the sediments at the edge of the pond it floats to the surface (Fig. 5 k) leaving the dense brine intact at the base of the pond, resulting in summer stratification that may persist until meltwater pond refreeze (Fig. 5l).
Meltwater pond thaw is not a one-dimensional process and isotherms are not horizontal within the pond (unlike in some larger ice-covered lakes (e.g. Mortimer & MacKereth Reference Mortimer and MacKereth1958)). This reflects the differential heating of the sediments and the reduced water depth in the littoral zone. Additional high-resolution temperature records from littoral areas of the pond would be needed if a more quantitative model of this process is to be produced.
Geochemical implications of pond temperature regimes
During freezing, pond temperatures control the rate at which ice formation occurs, consequently, the process of salt exclusion from the ice during freezing is also driven by pond temperatures. Increasing salinity during freezing lowers the freezing point of the liquid water, altering the solubility and the saturation point of minerals (e.g. Marion Reference Marion1997). The depression of freezing point was calculated from the major ion chemistry for a basal brine sample collected from Skua Pond in 2001 (Wait et al. Reference Wait, Webster, Brown, Healy and Hawes2006). The predicted freezing point was -12.4°C compared to the measured temperature of -18°C, suggesting that there is some other factor influencing the freezing point depression of the brine. A very high total organic carbon concentration of 4640 mg l-1 (J. Webster-Brown, unpublished data) was measured in an unfiltered Skua Pond basal brine sample collected in October 2001, most likely concentrated during freezing and unlikely to be significantly utilised by microbes during the winter period. This combined with a strong yellow colouration in the Skua Pond brine (Wait et al. Reference Wait, Webster, Brown, Healy and Hawes2006) indicates very high concentrations of organic material. The presence of dissolved organic material in the brine may further depress the freezing point as freezing point depression is a colligative property that depends on the concentration, not the nature, of dissolved ions.
Once the majority of the water column has frozen, further variation in pond temperature may drive downward convection within the brine channels resulting in secondary brine evolution. This has significant implications for the prediction of basal brine chemistry, which is important for our ability to understand ecosystem functioning during winter, as multiple evolutionary brine processes would need to be accounted for. Pockets of high conductivity brine included in ice midway through the water column (Wait et al. Reference Wait, Webster, Brown, Healy and Hawes2006) may also be partially explained by this process if convection of brine resulted in further salt exclusion, from the upper layers of ice, which then pooled at the base of the brine channels. Mineral precipitation may also eventuate if concentrations reach saturation with respect to minerals within these evolving brine inclusions.
The presence of ice plugs in meltwater ponds has significant geochemical implications for several reasons. Firstly, it dramatically increases the chance of stratification being preserved during summer, when the ponds are fully melted, compared to relying on density gradients alone to suppress mixing. The presence of summer stratification influences the stability of minerals precipitated during freezing, as well as leading to a greater habitat differentiation for both planktonic and benthic communities (Mueller & Vincent Reference Mueller and Vincent2006). Secondly, by preserving the anoxic brine conditions at the base of the pond beneath the ice-plug, the time during which anaerobic processes can operate is extended, possibly well into the summer melt period.
Anoxic conditions allow significant H2S concentrations to be present in some basal brines beneath the pond ice until the release of the ice plug during pond melting. This anoxia and the presence of H2S combined with high salinity in the basal brines means that the less hospitable winter-type conditions may persist into summer longer than previously thought, effectively shortening the length of time that environmental conditions are favourable for biological production. One of the geochemical implications of this relates to trace metal solubility, as concentrations of trace metals such as Cu, Pb, Zn, and Ni in anoxic Antarctic brines are primarily controlled by the concentration of H2S (Webster et al. Reference Webster, Brown and Vincent1994, Webster-Brown & Webster Reference Webster-Brown and Webster2007). In the presence of even trace concentrations of H2S, mineral sulphides with these metals will start precipitating, effectively removing metals from the water column. This study has shown that such processes linked to the presence of H2S may continue for the entire summer melt period, despite high concentrations of dissolved oxygen and an oxidizing redox environment, as detectable levels of H2S (0.02 mg kg-1 to 0.33 mg kg-1) were still present in several of the stratified brines at the end of summer (late January) (Fig. 4b & c). This thermodynamic anomaly suggests very slow H2S oxidation reaction rates. It may reflect the absence or inactivity of sulphur–oxidizing bacteria, such as the Thiobacillus species that has been found in Lake Fryxell, Antarctica (Sattley & Madigan Reference Sattley and Madigan2006). It may also indicate a predominance of sulphate-reducing bacteria that continue to produce H2S at the base of the pond into the summer months. Other reduced sulphur gases, such as dimethylsuphide (DMS) and carbon disulphide (CS2), have also been found dissolved in McMurdo Ice Shelf ponds during the summer period and attributed to biological activity (de Mora et al. Reference de Mora, Grout and Shooter1990, 1996).
Supersaturated dissolved oxygen at the base of stratified meltwater ponds soon after ice plug melting (Fig. 4) in early summer most probably reflects the commencement of biological processes in the cyanobacterial mats at the base of the pond once the ice plug has melted away. Cyanobacteria produce dissolved oxygen during photosynthesis. The dissolved oxygen present in the summer brines is probably produced at the base of the pond from increased photosynthesis rather than downward diffusion from the oxygenated water column above. Consequently, it appears that the release of the ice plug also influences the timing of biological processes occurring at the base of the meltwater ponds. A deep peak in dissolved oxygen has also been associated with a photosynthesis maximum in Lake Vanda (Vincent Reference Vincent1981). The absence of dissolved oxygen in the basal brines at the end of winter (Wait et al. Reference Wait, Webster, Brown, Healy and Hawes2006) and immediately after ice plug melting suggests that any increase in dissolved oxygen resulting from freeze concentration (Wharton et al. Reference Wharton, McKay, Mancinelli and Simmons1987) is lost during the winter period, perhaps by bacterial respiration or sulphide oxidation.
Conclusions
Seasonal variation in water temperature within meltwater ponds has significant implications for meltwater chemistry and ecosystem functioning. Reverse temperature gradients during freezing and the downward progression of the freezing front drives salt exclusion and in turn influences brine evolution, salt precipitation and the nature of the environmental conditions tolerated by microbiological communities living within these ponds during winter. During both freezing and thawing of meltwater ponds, the release of latent heat of fusion strongly affects thermal gradients within the water column. The most significant feature of the thawing process in early summer that differs from previously accepted TDBU model is the presence of an ice plug which supports the persistence of chemical stratification by creating a barrier to mixing. The ice plug phenomena also acts as a barrier to chemical processes and lengthens the duration of highly saline anoxic water conditions at the base of the pond during summer. The preservation of anoxic brine beneath ice plugs and the persistence of stratified basal brines during summer have significant implications for microbial communities and the precipitation of certain minerals, potentially influencing the toxicity of the meltwater pond environment.
Acknowledgements
This study was partly funded by a Tertiary Education Commission Bright Futures Top Achiever Doctoral Scholarship and a grant from the Foundation of Research Science and Technology in New Zealand. We gratefully acknowledge the logistical support of Antarctica New Zealand, and Helicopters NZ Ltd, in Antarctica, and the help of Dr Ian Hawes, Dr Brian Sorrell and Ms Donna Sutherland (NIWA) with fieldwork and data collection at Bratina Island. Mr Nick Velychko (University of Auckland) constructed the temperature sensor array for use in Skua Pond. Finally, we would like to thank Professors Clive Howard-Williams (NIWA) and Bryan Storey (Gateway Antarctica, University of Canterbury) for their ongoing support for this research.


