Introduction
Cognitive dysfunction is a core feature of all psychotic disorders; however, substantial variability exists in terms of cognitive domains of dysfunction – both within and between diagnostic groupings – and a clear ‘profile’ of cognitive strengths and weaknesses has not emerged (e.g. Goldstein, Reference Goldstein1990; Seaton et al. Reference Seaton, Goldstein and Allen2001). Cluster analysis provides an opportunity to group individuals using a data-driven approach rather than pre-determined grouping criteria (e.g. diagnosis). Such approaches permit individuals to be classified based not on single variables or factors but on patterns or profiles of traits, creating the potential for more homogeneous groupings than single domains or predefined categories.
Cluster-analytic studies of neurocognition in patients with schizophrenia (SZ) suggest that meaningful groupings emerge using this data-reduction approach (for a review, see Seaton et al. Reference Seaton, Goldstein and Allen2001). The most consistent findings on subgroups include a cluster of patients with a ‘neuropsychologically normal’ profile, a cluster with widespread and significant deficits, and one to three intermediate profiles of mixed cognitive deficits (Heinrichs & Awad, Reference Heinrichs and Awad1993; Goldstein & Shemansky, Reference Goldstein and Shemansky1995; Goldstein et al. Reference Goldstein, Beers and Shemansky1996, Reference Goldstein, Allen and Seaton1998, Reference Goldstein, Shemansky and Allen2005; Palmer et al. Reference Palmer, Heaton, Paulsen, Kuck, Braff, Harris, Zisook and Jeste1997; Seaton et al. Reference Seaton, Allen, Goldstein, Kelley and van Kammen1999; Hill et al. Reference Hill, Ragland, Gur and Gur2002; Allen et al. Reference Allen, Goldstein and Warnick2003). These findings suggest that, while most patients with SZ suffer from significant and/or widespread cognitive impairment, a subset of patients with SZ exhibits cognitive functioning that is similar to that of the general population.
Findings regarding intermediate or mixed clusters are more heterogeneous. Heinrichs & Awad (Reference Heinrichs and Awad1993) found a five-cluster solution including three mixed clusters with relatively selective deficits (executive-prefrontal dysfunction, executive-motor deficits, and selective motor deficits). Goldstein et al. (Reference Goldstein, Allen and Seaton1998) ran two separate analyses, one using Wechsler Adult Intelligence Scale-Revised (WAIS-R) measures and the other using a combination of neuropsychological assessments; they found four-cluster solutions for both analyses, but with only weak association between solutions. Their intermediate clusters included moderate impairment overall, and more specific deficits (WAIS-R solution: low performance ability; combined solution: low abstraction and problem-solving ability). Also using the WAIS-R subtest scores, Seaton et al. (Reference Seaton, Allen, Goldstein, Kelley and van Kammen1999) found a similar solution to that of Goldstein et al. (Reference Goldstein, Allen and Seaton1998), with a ‘low average’ cluster and a cluster with poor performance scores but average verbal scale scores. All of the above studies also reported the commonly found ‘normal’ and ‘globally impaired’ clusters. The neurocognitive measures used in these studies varied considerably; thus, it is likely that differences in cluster profiles reflect, at least in part, the instruments used to derive the clusters. In support of this interpretation, the two studies that used WAIS-R scores found the most comparable emergent clusters (Goldstein et al. Reference Goldstein, Allen and Seaton1998; Seaton et al. Reference Seaton, Allen, Goldstein, Kelley and van Kammen1999).
Neurocognitive clusters may be associated with clinical characteristics and community functioning in patients with SZ and related disorders. A report of patients with schizoaffective disorder (SZA) compared with clinical subtypes of SZ (paranoid, undifferentiated, and residual) found that patients with SZA or paranoid-type SZ had more intact cognitive functioning than undifferentiated- or residual-type SZ patients (Goldstein et al. Reference Goldstein, Shemansky and Allen2005). They also found a higher percentage of the SZA/paranoid-type SZ in a ‘neuropsychologically normal’ cluster. Similarly, Hill et al. (Reference Hill, Ragland, Gur and Gur2002) found that patients with paranoid-subtype SZ were more likely to be included in a higher-performing cluster, whereas patients with negative or disorganized clinical subtypes were more likely to be assigned to the impaired clusters. Similar reports have also found associations between the neuropsychologically normal cluster, increased socialization and fewer hospitalizations (Palmer et al. Reference Palmer, Heaton, Paulsen, Kuck, Braff, Harris, Zisook and Jeste1997; Allen et al. Reference Allen, Goldstein and Warnick2003). However, Seaton et al. (Reference Seaton, Allen, Goldstein, Kelley and van Kammen1999) found no association between clusters on symptom profile, severity or diagnostic subtypes.
Despite a growing literature supporting cognitive dysfunction as a key feature of bipolar disorder (BD), and particularly BD with psychosis (BDP), cluster approaches to characterizing cognitive deficits in BD have not been reported. Further, despite an ongoing nosological debate concerning BD and SZ, and increasing evidence of substantial clinical, biological and etiological overlap in these disorders, cluster approaches in neurocognition have not been applied to cross-diagnostic samples of patients with psychosis and affective illness. In this study we applied a cluster-analysis approach to a large, well-characterized, cross-diagnostic sample of patients with psychotic disorders using a broad neurocognitive battery selected to assess multiple domains of cognition often reported to show deficits in psychotic disorders. We then compared emergent clusters on diagnosis and clinical, demographic and community functioning variables.
Method
Participants
Patients with diagnoses of SZ (n = 41), SZA (n = 53) or BDP (n = 73) between the ages of 18 and 55 years were recruited through the Schizophrenia and Bipolar Disorder Program at McLean Hospital. All procedures were approved by the McLean Hospital Institutional Review Board. Participants were recruited through in-patient units after stabilization or via fliers posted at the hospital. Participants had no history of substance dependence within the last year, no substance abuse within the past 3 months, and no history of seizure disorder or head injury with loss of consciousness.
Materials
Participants were administered clinical and neuropsychological assessments and a diagnostic interview. The neuropsychological battery included: Trails A and B (Trails; processing speed, executive functioning); the Brief Visuospatial Memory Test (BVMT; visuospatial learning and memory) total recall and delayed recall measures; the Stroop color and word test (Stroop; attention, processing speed, executive functioning) color and color–word (interference) forms; the Hopkins Verbal Learning Test – Revised (HVLT; verbal learning and memory) total recall and delayed recall measures; category fluency (verbal fluency). Raw scores were converted to standard scores using published normative data (Golden, Reference Golden1978; Selnes et al. Reference Selnes, Jacobson, Machado, Becker, Wesch, Miller, Visscher and McArthur1991; Benedict, Reference Benedict1997; Benedict et al. Reference Benedict, Schretlen, Groninger and Brandt1998; Gladsjo et al. Reference Gladsjo, Schuman, Evans, Peavy, Miller and Heaton1999). Standardized scores were then converted to Z-scores.
Diagnosis was established using the Structured Clinical Interview for DSM-IV-TR (SCID; First et al. Reference First, Spitzer, Gibbon and Williams1996) completed through patient interview, medical record review, and – when possible – consultation with the participant's treatment provider(s). The SCID was administered by trained clinicians as part of a larger study on genotype and phenotype in psychotic disorders. SCID interviewers met routinely for reliability exercises and to discuss difficult cases and arrive at a consensus diagnosis. Rates of agreement were perfect (1.0) for SCID diagnoses (Öngür et al. Reference Ongür, Lin and Cohen2009). The same study staff conducting the cognitive assessments never administered the SCID.
The assessment also included the Positive and Negative Syndrome Scale (PANSS; Kay et al. Reference Kay, Fiszbein and Opler1987), the Young Mania Rating Scale (YMRS; Young et al. Reference Young, Biggs, Ziegler and Meyer1978) and the Montgomery–Åsberg Depression Rating Scale (MADRS; Montgomery & Asberg, Reference Montgomery and Asberg1979) to evaluate current psychotic and mood symptoms, and the Multnomah Community Ability Scale (MCAS; Barker et al. Reference Barker, Barron, McFarland and Bigelow1994) to assess community functioning. The MCAS measures community functioning in several domains including daily living, social involvement and interest, and occupational/other meaningful activity. We administered a modified version, eliminating items that directly assessed clinical symptoms (M3, M4, M17), substance abuse (M16) and intellectual functioning (M2) in order to obtain a measure of community functioning that was less directly influenced by clinical and cognitive symptoms. The final MCAS version used in this study included 11 items scored in the range of one to five (a score of five indicating highest functioning) for a total of 55 points.
Information about medication at time of assessment was obtained from the discharge medication list (in- patients) or by patient report (out-patients). Chlorpromazine (CPZ) equivalents were calculated based on the recommendations set forth in Baldessarini (Reference Baldessarini2012).
Procedures
All participants completed the above assessment lasting approximately 3 h broken into two sessions. The SCID was administered during the first session and the neurocognitive assessment during a second session. Clinical symptoms were assessed during either the first or second session. Clinical and cognitive data were collected within 1 week of each other. Diagnostic interviews and neuropsychological assessments were always conducted by different staff members; however, cognitive and symptom assessments were often conducted by the same study staff, and staff members were not always able to remain blind to diagnosis.
Statistical approach
Cluster analyses were performed in Stata (StataCorp LP, USA) using Ward's linkage with squared Euclidean distance. The number of clusters examined was selected by visual inspection of the dendrograms and confirmed by discriminant function analysis. Data were then entered into a K-means cluster, with the number of means selected based on results of the hierarchical cluster analysis and the results of the discriminant function analysis. Clusters (using K-means results) were then compared on demographic, clinical and cognitive variables using analysis of variance (ANOVA) or χ 2. Post-hoc t tests with Bonferroni correction were conducted to examine pairwise relationships between clusters. Lastly, we conducted a series of linear regressions modeling age, education, CPZ equivalents, diagnosis, cluster and the diagnosis × cluster interaction to predict cognitive outcomes in order to examine the association of cluster with each cognitive variable after accounting for demographic and clinical variables, diagnosis and the interaction term.
Results
Cluster solutions
All neurocognitive data were adjusted for age or age and education using published norms and then converted to standard (Z) scores for ease of comparison, and so that each variable contributed equally to the distance measure. Ward's method of cluster analysis with a squared Euclidean distance was applied to the BVMT total and delayed recall scores, HVLT total and delayed recall scores, Trails A time to completion, Trails B time to completion, category fluency total number generated, Stroop color test correct in 45 s, and Stroop color–word interference condition correct in 45 s for the total sample. The dendrogram provided evidence for two-, three- and four-cluster solutions, with reasonable separation between clusters. The two-cluster solution characterized generically ‘better’ and ‘poorer’ neurocognitive functioning, with cluster 1 scores between 0.5 and 1.0 standard deviations below the mean and cluster 2 scores between 1.0 and 2.5 standard deviations below the mean. The three-cluster solution offered separation of meaningful groupings, with cluster 1 performing in the normal range of cognitive functioning, cluster 2 performing at a moderate level of dysfunction, and cluster 3 performing significantly below the mean on all measures. The four-cluster solution further divided cluster 2 (from the three-cluster solution) into mixed profiles in terms of domains of dysfunction. Based on inspection of the dendrogram and the cognitive profiles by cluster, a four-cluster solution was selected as providing the best differentiation amongst clusters with meaningful groupings in terms of cognitive functioning. A multivariate test of group differences was performed using canonical linear discriminant function analysis, which confirmed that the four groups were adequately differentiated (p < 0.0001–p < 0.05 at each level).
Next a K-means cluster analysis was performed specifying four clusters, entering the cognitive variables above. K-means is an iterative cluster approach, which allows movement of cases among clusters, thus constructing a more stable cluster solution. The four-cluster solution produced by the K-means analysis was used for all subsequent analyses. Neurocognitive profiles by cluster included a ‘neuropsychologically normal cluster’ (cluster 1), a globally and significantly impaired cluster (cluster 4), and two clusters of mixed cognitive profiles: cluster 2 exhibited poor visuospatial learning and memory, moderate verbal learning and memory impairment, and relatively intact processing speed and executive function, whereas cluster 3 exhibited poor verbal memory, verbal fluency, executive functioning and processing speed but intact visuospatial learning and memory.
Cognitive characteristics by cluster
Clusters were compared on cognitive characteristics using one-way ANOVAs (Table 1); all variables showed significant group differences. Bonferroni-corrected post-hoc t tests were used to examine pairwise comparisons between clusters (see Fig. 1 for cluster profiles). Cluster 4 performed significantly worse on most variables than the other clusters: cluster 1 all variables (t = −6.23 to−20.18, p < 0.0001); cluster 2 all variables (t = −4.15 to −9.11, p < 0.01 to p < 0.0001); cluster 3 all variables (t = −2.74 to –20.60; p < 0.05 to p < 0.0001) except category fluency (t = −2.22, p = 0.19) and Trails A (t = −2.21, p = 0.18). Clusters 1 and 2 differed on BVMT and HVLT measures (t = −7.34 to −13.22, p < 0.0001) and Stroop interference (t = 2.94, p < 0.05); clusters did not differ on the two processing speed measures (Stroop color and Trails A; t = −0.84, p = 1.0; and t = −0.33, p = 1.00, respectively), Trails B (t = −1.96, p = 0.32) or category fluency (t = −2.05, p = 0.23). Clusters 1 and 3 differed on all variables (t = −4.80 to −8.26, p < 0.0001) except BVMT total and BVMT delayed recall (t = −1.66, p = 0.39; and t = −0.40, p = 1.0, respectively). Clusters 2 and 3 differed on all measures except HVLT total and delayed recall (t = −1.40, p = 0.62 and t = 0.48, p = 1.0, respectively) and category fluency (t = −2.51, p = 0.09) (all other variables t = −3.68 to 11.50, p < 0.01 to p < 0.0001).

Fig. 1. Cogntive scores by K-means cluster. (a) Cluster 1 (‘neuropsychologically normal’). (b) Cluster 2 (‘processing speed/executive’). (c) Cluster 3 (‘visuospatial’). (d) Cluster 4 (‘globally significantly impaired’). BVMT, Brief Visuospatial Memory Test; HVLT, Hopkins Verbal Learning Test – Revised.
Table 1. Cognitive scores by K-means cluster
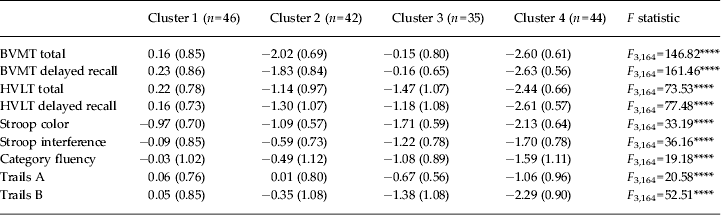
Data are given as mean (standard deviation).
BVMT, Brief Visuospatial Memory Test; HVLT, Hopkins Verbal Learning Test – Revised.
**** p < 0.0001.
Demographic and clinical comparisons by clusters
Demographic and clinical data were compared by diagnosis prior to clustering (Table 2) and by cluster using one-way ANOVAs or χ 2 analyses (Table 3). In terms of demographics, clusters differed on age and educational attainment. Post-hoc t tests with Bonferroni correction showed that cluster 4 was older than cluster 1 (t = 2.87, p = 0.02), and had lower educational attainment than clusters 1 and 2 (t = −4.07, p = 0.001, and t = −2.71, p = 0.04, respectively). Groups did not differ on sex, ethnicity or number of lifetime hospitalizations.
Table 2. Demographic and clinical means by diagnosis
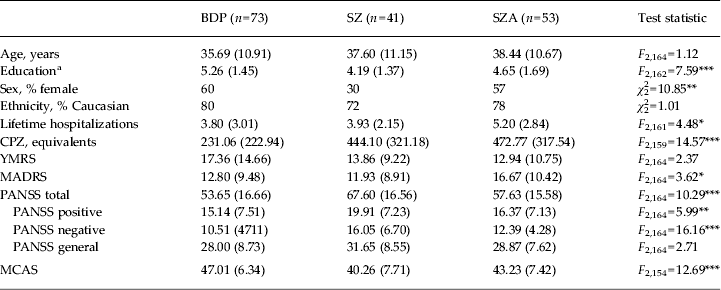
Data are given as mean (standard deviation) unless stated otherwise.
BDP, Bipolar disorder with psychosis; SZ, schizophrenia; SZA, schizo-affective disorder; CPZ, chlorpromazine; YMRS, Young Mania Rating Scale; MADRS, Montgomery–Åsberg Depression Rating Scale; PANSS, Positive and Negative Syndrome Scale; MCAS, Multnomah Community Ability Scale; SCID, Structured Clinical Interview for DSM-IV-TR.
a Education is coded based on the SCID Education and Work History scale: 1 = grade 6 or less; 2 = grade 7–12 (without graduating); 3 = high school graduate or equivalent; 4 = part college; 5 = graduated 2 year college; 6 = graduated 4 year college; 7 = part graduate/professional school; 8 = completed graduate/professional school.
* p < 0.05, ** p < 0.01, *** p < 0.001.
Table 3. Demographic and clinical means by K-means cluster
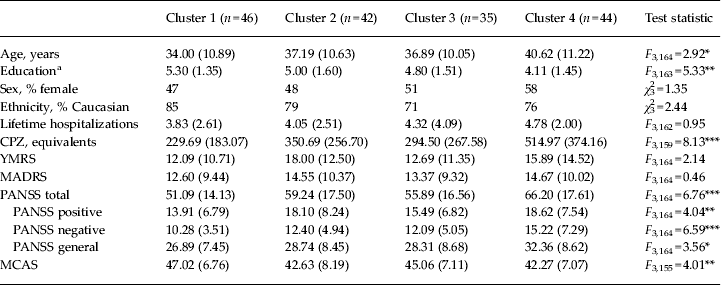
Data are given as mean (standard deviation) unless stated otherwise.
BDP, Bipolar disorder with psychosis; SZ, schizophrenia; SZA, schizo-affective disorder; CPZ, chlorpromazine; YMRS, Young Mania Rating Scale; MADRS, Montgomery–Åsberg Depression Rating Scale; PANSS, Positive and Negative Syndrome Scale; MCAS, Multnomah Community Ability Scale; SCID, Structured Clinical Interview for DSM-IV-TR.
a Education is coded based on the SCID Education and Work History scale: 1 = grade 6 or less; 2 = grade 7–12 (without graduating); 3 = high school graduate or equivalent; 4 = part college; 5 = graduated 2 year college; 6 = graduated 4 year college; 7 = part graduate/professional school; 8 = completed graduate/professional school.
* p < 0.05, ** p < 0.01, *** p < 0.001.
In terms of clinical characteristics, clusters differed on CPZ equivalents at the time of testing and all PANSS scores and PANSS total. Post-hoc t tests showed that in all cases cluster 4 had the highest level of symptomatology. Compared with cluster 1, cluster 4 had significantly higher symptom ratings on all PANSS measures (t = 3.14 to 4.55, p = 0.01 to p < 0.0001). Cluster 4 had higher PANSS total scores than cluster 3 (t = 2.67, p = 0.04). Clusters did not differ on YMRS or MADRS scores. Cluster 4 had significantly higher CPZ dosing than clusters 1, 2 or 3 (t = 2.34 to 4.55, p < 0.05 to p < 0.0001), which did not differ from each other on CPZ levels. Clusters differed in MCAS scores, with cluster 1 showing better community functioning scores than clusters 2 and 4 (t = −2.74, p = 0.03; and t = −3.18, p = 0.02, respectively); there were no other differences between clusters in terms of community functioning scores.
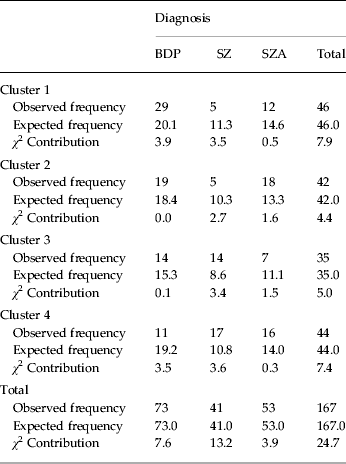
Diagnoses by cluster
All diagnoses were represented in each cluster, although they were not distributed evenly (χ 2 = 24.71, p < 0.001) (Table 4). Patients with BDP made up 63% of cluster 1 (‘neuropsychologically normal’), compared with 26% SZA and 11% SZ. Similarly, cluster 2 (‘processing speed/executive’) was made up primarily of patients with BDP (45%) and SZA (43%), with only five patients with SZ (12%) being assigned to this cluster. Diagnoses were more evenly distributed in cluster 4 (‘globally-impaired’) (BDP: 25%; SZA: 36%; SZ: 39%). Cluster 3 (‘visuospatial’) contained 40% BDP, 20% SZA and 40% SZ.
Table 4. Cluster assignment by diagnosis a

BDP, Bipolar disorder with psychosis; SZ, schizophrenia; SZA, schizo-affective disorder.
a Pearson χ 2 6 = 24.71 (p < 0.001).
Linear regression analyses
We conducted a series of linear regressions to examine effects of demographic (age, education) and clinical (CPZ equivalents) variables and diagnosis on cognitive outcomes, and to examine any possible diagnosis × cluster interactions. Cluster membership contributed to the model even after accounting for these other variables (t = 3.59 to t = 16.99, p < 0.001). Diagnosis was only a significant predictor of category fluency (t = −2.67, p < 0.01), and cluster membership continued to contribute significantly to the model. CPZ contributed only to HVLT total (t = −3.23, p < 0.01) and HVLT delayed recall (t = −2.98, p < 0.01). Education contributed only to Trails B (t = 2.25, p < 0.05). Age and the diagnosis × cluster interaction were not significant predictors in any model.
Discussion
We conducted a data-driven, exploratory hierarchical cluster analysis followed by a K-means cluster analysis to examine patterns of cognitive profiles in a large, cross-diagnostic sample of patients with psychotic disorders. A four-cluster solution provided adequate separation of the clusters and meaningful cognitive profiles. Cluster 1 represents a ‘neuropsychologically normal’ group in which all cognitive scores except Stroop color were within 0.5 standard deviations of the mean. Of note, we have reported previously that Stroop color scores in our samples are significantly lower than would be expected, even in controls, with controls scoring approximately 0.8 standard deviations below the mean (Lewandowski et al. Reference Lewandowski, Cohen, Keshavan and Öngür2011). In examining the distribution of these scores, this finding did not appear to be driven by one or more outliers; therefore it is likely that the Stroop values here represent artificially lowered scores by half or more standard deviation and should be interpreted with caution. Conversely, the cognitive profile of cluster 4 shows all neurocognitive variables between 1 and greater than 2.5 standard deviations below the mean, and represents a globally and significantly impaired group. In cluster 2 visuospatial memory was significantly impaired, but processing speed and verbal fluency did not differ from the neuropsychologically normal cluster, and executive functioning was relatively intact, with both measures approximately half a standard deviation from the mean and only one measure differing from cluster 1; verbal learning and memory was moderately impaired. Cluster 3 exhibited normal visuospatial learning and memory, but differed significantly from the neuropsychologically normal cluster on all other variables. Cluster 3 also performed worse than cluster 2 on most measures (although significantly better than cluster 2 on visuospatial memory). Thus, the four clusters represent broadly: (1) a ‘neuropsychologically normal’ cluster; (2) a ‘processing speed/executive’ cluster; (3) a ‘visuospatial’ cluster; and (4) a ‘global cognitive impairment’ cluster.
Our finding of a neuropsychologically normal cluster and a globally and significantly impaired cluster is consistent with previous studies of cognitive clusters in SZ, and indicates that these cognitive profiles extend to other patients with psychotic disorders as well. As noted above, comparison of ‘mixed’ clusters with findings from previous studies is challenging, as cluster solutions appear to be largely dependent upon the content (and likely the psychometric properties) of the measures used to derive them. We found two ‘mixed’ deficit clusters, ‘processing speed/executive’ and ‘visuospatial’, which are similar to the findings of Goldstein et al. (Reference Goldstein, Allen and Seaton1998) and Seaton et al. (Reference Seaton, Allen, Goldstein, Kelley and van Kammen1999) who found a cluster with poor performance ability but relatively intact cognition otherwise, and a cluster with more broad impairment that was not as severe as the globally impaired cluster. Our ‘visuospatial’ cluster was similar to that of cluster 1 from Dawes et al. (Reference Dawes, Jeste and Palmer2011), which was characterized by poor visual learning and memory relative to other cognitive abilities. Our mixed clusters differ considerably from those of Heinrichs & Awad (Reference Heinrichs and Awad1993); however, the measures used in their study differed considerably from ours. For instance, they included a motor measure, which we did not, but did not include tests of visuospatial learning, which we did. Thus, differences in cluster profiles may reflect measurement differences between studies.
Clusters differed on several demographic characteristics, including age and education. Cluster 1 was significantly younger than cluster 4; clusters 2, 3 and 4 did not differ from each other. Cluster 4 also had lower educational attainment than clusters 1 and 2. While this finding may be causally associated with neurocognitive performance, the direction of that relationship is not clear. That is, lower educational attainment could lead to poorer neurocognitive performance, or neurocognitive dysfunction could lead to lower educational attainment. Unfortunately, we did not have adequate data regarding pre-morbid intelligence quotient and were not able to examine the association between pre-morbid cognitive functioning and cluster membership.
All diagnoses were represented in all cognitive clusters. Subjects with BDP were over-represented in cluster 1 (63%) compared with subjects with SZA (26%) and subjects with SZ (11%), although it should be noted that of patients with SZ, 12% were assigned to the neuropsychologically normal cluster (cluster 1). Similarly, cluster 2 was made up primarily of patients with BDP (45%) or SZA (43%), with only five subjects with SZ (12%) being assigned to this cluster. Patients with SZ were over-represented in clusters 3 and 4, suggesting that patients with SZ are disproportionately more likely to exhibit widespread impairment. These findings suggest that patients with affective psychosis may be more likely to exhibit no cognitive impairment or significant impairment in one or two select domains, such as visuospatial processing, than patients with non-affective psychosis, who are more likely to exhibit moderate to severe impairments more globally. However, it is notable that cluster 4 was comprised somewhat more evenly of all three diagnoses (BDP = 25%; SZA = 36%; SZ = 39%), suggesting that a subset of patients across psychotic disorders presents with significant and global cognitive impairment. The interaction of cluster × diagnosis was not significant for any regression model, indicating that within cluster cognitive performance did not differ by diagnosis. These findings support the concept of a cognitive symptom dimension that cuts across diagnostic categories in psychosis, although the distribution of cognitive profiles may differ by diagnosis or history of affective symptoms.
Clusters were associated with clinical measures of positive, negative and general symptoms, with cluster 4 showing the highest symptom ratings on all measures and CPZ dose; the other three clusters did not differ from each other. Clusters were not associated with state mania or depression, and were not associated with number of lifetime hospitalizations. Given the findings of differences in cluster membership between affective and non-affective psychoses, these findings suggest that the severity of state mood symptoms is not associated with cognitive profiles, whereas history of mood symptoms is associated with better cognitive functioning or more focal cognitive deficits. Cognitive profiles may be trait-like features that are more closely associated with other illness traits (e.g. affective versus non-affective psychosis) than with state symptom presentation.
Clusters were also associated with community functioning. Cluster 1 exhibited the best community functioning; clusters 2, 3 and 4 did not differ from each other. These findings suggest that both significant cognitive impairment in select domains and more global impairment are associated with poor community outcomes, and support substantial work indicating that cognitive deficits are among the strongest predictors of outcomes in patients with psychosis (e.g. Green, Reference Green2006; Barch, Reference Barch2009). In a cross-diagnostic sample of patients with psychosis, baseline cognitive functioning after an acute episode was the strongest predictor of community functioning after clinical recovery 6 months later (Lewandowski et al. Reference Lewandowski, Cohen, Keshavan, Sperry and Ongür2013). Identification of patients with intact versus patients with poor cognitive functioning – both patients with significant and widespread impairment and patients with significant deficits in select domains – may have significance for prognosis and treatment planning. Additionally, cognitive remediation programs may attempt to develop training paradigms tailored to different profiles of cognitive dysfunction rather than applying a ‘one size fits all’ approach. Whether or not profile-specific remediation programming would enhance efficacy or adherence is a question that remains to be tested.
Identification of more cognitively homogeneous groups may also hasten the discovery of neurodevelopmental or neurodegenerative processes affecting some but not all patients with any given diagnosis. For instance, a cluster-analytic study of neurophysiological clusters in patients with BD or SZ reported three profiles described as ‘globally impaired’, ‘high cognitive’ and ‘sensory processing’ (Hall et al. Reference Hall, Smoller, Cook, Schulze, Hyoun Lee, Taylor, Bramon, Coleman, Murray, Salisbury and Levy2012). Clusters were similar between diagnoses, suggesting that neurobiological measures may be more closely linked to specific phenotypes rather than diagnostic groupings.
Future studies should examine the stability of cognitive clusters over time. If clusters represent stable cognitive symptom profiles, then these groupings can be used to study associations with neurobiological measures (Seaton et al. Reference Seaton, Goldstein and Allen2001). Further, their predictive validity can be studied in terms of clinical and functional outcomes. In a study examining the stability of cognitive clusters over a 3-year follow up, Heinrichs et al. (Reference Heinrichs, Ruttan, Zakzanis and Case1997) found low to moderate stability of clusters (individual κ's ranged from 0.12 to 0.66), suggesting that some clusters were considerably more stable than others. The identification of stable, homogeneous groupings of patients by symptom dimension may lead both to better understanding of the pathophysiology of these illnesses, and to better diagnostic procedures and treatments to target these key symptoms.
Acknowledgements
This work was supported by the National Institutes of Health (grant no K23MH91210 to K.E.L. and grant no. R01MH094594 to D.O.) and The Shervert Frazier Research Institute at McLean Hospital (to K.E.L.).
The authors assert that all procedures contributing to this work comply with the ethical standards of the relevant national and institutional committees on human experimentation and with the Helsinki Declaration of 1975, as revised in 2008.
Declaration of Interest
D.O. serves on the scientific advisory board for Eli Lilly.