


Introduction
Oppositional defiant disorder (ODD) and conduct disorder (CD) with a prevalence rate ranging from 2 to 4% (Polanczyk, Salum, Sugaya, Caye, & Rohde, Reference Polanczyk, Salum, Sugaya, Caye and Rohde2015) are among the most commonly diagnosed mental health disorders in youth (Loeber, Burke, Lahey, Winters, & Zera, Reference Loeber, Burke, Lahey, Winters and Zera2000). ODD is characterized by a frequent and persistent pattern of irritable and angry mood, vindictiveness and inappropriate, negativistic, defiant, and disobedient behavior toward authorities, while CD is defined as a repetitive and persistent pattern of behavior, which violates the rights of others and major age-appropriate societal rules (American Psychiatric Association, 2013). Additionally, the clinical representation of ODD/CD is heterogeneous, with distinct subtypes of aggression and high comorbidity rates with attention-deficit hyperactivity disorder (ADHD). Moreover, current research suggests that callous-unemotional (CU) traits, which include reduced guilt, callousness, uncaring behavior, and reduced empathy, contribute to this heterogeneity (Blair, Leibenluft, & Pine, Reference Blair, Leibenluft and Pine2014; Frick & Viding, Reference Frick and Viding2009). On this basis, CU traits have been added to the fifth edition of the DSM (DSM-5) as a specifier for the diagnosis of CD called ‘limited prosocial emotions’. Additionally, two distinctions in reactive (RA) and proactive (PA) aggression are often made to subtype aggressive behavior (Raine et al., Reference Raine, Dodge, Loeber, Gatzke-Kopp, Lynam, Reynolds and Liu2006). RA is associated with impulsive, high arousal or affective aggression, whereas PA refers to goal-directed, planned behavior associated with reduced arousal and higher levels of CU traits (HCU) (Blair et al., Reference Blair, Leibenluft and Pine2014).
Recent brain imaging findings have provided insights into the underlying neural mechanisms of these aggression-related disorders. Altered neural activity has previously been found in brain areas, such as the amygdala, ventromedial prefrontal cortex, orbitofrontal cortex, anterior insula, and the caudate in children with ODD/CD when compared to typically developing children (TD) and children with ADHD (Noordermeer, Luman, & Oosterlaan, Reference Noordermeer, Luman and Oosterlaan2016; Viding, Seara-Cardoso, & McCrory, Reference Viding, Seara-Cardoso and McCrory2014). Moreover, different neural activity patterns of the amygdala in children with ODD/CD compared to TD children in response to negative (i.e. angry or fearful) face stimuli (Jones, Laurens, Herba, Barker, & Viding, Reference Jones, Laurens, Herba, Barker and Viding2009; Viding, Sebastian, et al., Reference Viding, Sebastian, Dadds, Lockwood, Cecil, De Brito and McCrory2012) suggest impaired recognition of other's facial expressions (Blair, Reference Blair2013; Veroude et al., Reference Veroude, von Rhein, Chauvin, van Dongen, Mennes, Franke and Buitelaar2016). However, previous studies have yielded inconsistent findings showing evidence of both hypo- and hyperactivity of the amygdala to affective stimuli (Coccaro, McCloskey, Fitzgerald, & Phan, Reference Coccaro, McCloskey, Fitzgerald and Phan2007; Herpertz et al., Reference Herpertz, Huebner, Marx, Vloet, Fink, Stoecker and Herpertz-Dahlmann2008; Passamonti et al., Reference Passamonti, Fairchild, Goodyer, Hurford, Hagan, Rowe and Calder2010). This is consistent with the heterogeneity within aggression-related disorders. Two main theories might explain these divergent findings. First, the threat sensitivity theory, which describes an over-activation of limbic areas (i.e. amygdala), presumably associated with higher RA, and the deficient empathy theory, which is associated with reduced amygdala activity and more PA and higher CU traits (Blair et al., Reference Blair, Leibenluft and Pine2014). However, these studies with inconsistent findings did not take subtypes of aggression and the level of CU traits into account. Studies that considered the influence of CU traits have revealed amygdala hypoactivity in youth with HCU and amygdala hyperactivity in children with low CU traits (LCU) (Baker, Clanton, Rogers, & Brito, Reference Baker, Clanton, Rogers and Brito2015; Blair, Veroude, & Buitelaar, Reference Blair, Veroude and Buitelaar2016; Viding, Fontaine, & McCrory, Reference Viding, Fontaine and McCrory2012). Moreover, these altered amygdala responses, particularly to fearful expressions, were shown to be independent of comorbidities, such as ADHD (Hyde et al., Reference Hyde, Shaw, Murray, Gard, Hariri and Forbes2016; Marsh et al., Reference Marsh, Finger, Mitchell, Reid, Sims, Kosson and Blair2008; Posner et al., Reference Posner, Nagel, Maia, Mechling, Oh, Wang and Peterson2011). Nevertheless, several recent studies did not find a significant influence of CU traits on amygdala activity to negative stimuli (Dotterer, Hyde, Swartz, Hariri, & Williamson, Reference Dotterer, Hyde, Swartz, Hariri and Williamson2017; Ewbank et al., Reference Ewbank, Passamonti, Hagan, Goodyer, Calder and Fairchild2018; Hyde et al., Reference Hyde, Shaw, Murray, Gard, Hariri and Forbes2016), although the samples were not clinical.
Heterogeneous findings on the psychophysiological level [i.e. skin conductance response (SCR)] might also be explained by differential associations with aggression-related subtypes. Physiological hypo-arousal has been observed in children with HCU (Fanti, Reference Fanti2016), whereas hyper-arousal was most commonly associated with RA and internalizing symptoms (Gao, Tuvblad, Schell, Baker, & Raine, Reference Gao, Tuvblad, Schell, Baker and Raine2015; Scarpa, Haden, & Tanaka, Reference Scarpa, Haden and Tanaka2010). Further, general reduced skin conductance (SC) (i.e. during resting state) has been found in ODD/CD (Lorber, Reference Lorber2004; Van Goozen, Matths, Cohen-Kettenis, Buitelaar, & Van England, Reference Van Goozen, Matths, Cohen-Kettenis, Buitelaar and Van England2000).
Our study aimed to evaluate if accounting for aggression-related subtypes and CU traits in children and adolescents with high aggression can disentangle the heterogeneity of amygdala responses and SCR to negative face stimuli into more consistent patterns, and to characterize divergent neural reactivity in response to negative face stimuli in these groups by comparing them with a large sample of TD children.
Methods and materials
Participants
Participants in the current study were part of both the EU-Aggressotype and EU-MATRICS projects. In total, 208 participants aged 8–18 years were assessed using functional magnetic resonance imaging (fMRI) across nine sites in Europe. The measures used here were part of a larger test battery including questionnaires, neuropsychological testing, MR scanning, and genotyping. Participants who were included as ‘cases’ were diagnosed with ODD and/or CD based on the structured diagnostic interviews with child and parents using the Kiddie Schedule for Affective Disorders and Schizophrenia (K-SADS) (Kaufman et al., Reference Kaufman, Birmaher, Brent, Rao, Flynn, Moreci and Ryan1997) according to DSM-5, or scored above the clinical cut-off (T value ⩾70) for the subscales of aggressive and/or rule-breaking behavior as measured with the Child Behavior Checklist completed by parents, teachers, or youths (CBCL/TRF/YSR; Achenbach, Howell, Quay, Conners, & Bates, Reference Achenbach, Howell, Quay, Conners and Bates1991). Exclusion criteria for all participants were any contraindications for MRI, an IQ<80 measured from four subtests (vocabulary, similarities, block design, and picture completion/matrix reasoning) of the Wechsler Intelligence Scale for Children-IV (Wechsler, Reference Wechsler2003), and a primary DSM-5 diagnosis of psychosis, bipolar disorder, major depression, and/or an anxiety disorder. In the typically developing comparison group, no DSM axis I disorder, assessed via the K-SADS, and no clinical score in the CBCL, TRF, or YSR was allowed. For cases, medication use had to be stable for at least 2 weeks prior to inclusion. The parent-rated Inventory of Callous-Unemotional Traits (ICU) (Essau, Sasagawa, & Frick, Reference Essau, Sasagawa and Frick2006) and the self-reported Reactive Proactive Aggression Questionnaire (RPQ) (Raine et al., Reference Raine, Dodge, Loeber, Gatzke-Kopp, Lynam, Reynolds and Liu2006) were used to subtype aggressive behavior. ADHD symptoms were measured with the parent-rated SNAP-IV questionnaire (Bussing et al., Reference Bussing, Fernandez, Harwood, Hou, Garvan, Swanson and Eyberg2008). Ethical approval for the study was obtained for all sites separately from local ethics committees. Written (or oral) informed consent was given by the participants and their parents or legal representatives.
fMRI task
Participants performed a modified version of the emotional face-matching task (Hariri, Bookheimer, & Mazziotta, Reference Hariri, Bookheimer and Mazziotta2000). In this task, participants completed four blocks of a perceptual face-matching task in which they had to match the presented emotions. Stimuli comprised a trio of faces in which the participants had to select one of two emotions (displayed on the bottom) identical to the target stimulus (displayed on the top). Each block consisted of six images derived from a standard set of facial affect with either negative (anger and fear) or positive faces (happy and neutral). Interleaved between these blocks, participants completed two blocks of a sensorimotor control task with geometric shapes (horizontal ellipses or vertical ellipses).
Skin conductance recording and pre-processing
SCR was recorded simultaneously with fMRI data in a subsample collected at three sites (Mannheim, Nijmegen, and Zürich), using a pair of Ag/AgCI electrodes and electrode paste with 0.5% saline (TD-246 Skin Resistance–Skin Conductance Electrode Paste, Discount Disposables, Vermont, USA) placed on the distal phalanges of digits I and II on the non-dominant hand. MR-compatible amplifiers and sensors were used (Brain Products GmbH Gilching, Germany). Data were downsampled to 10 Hz and analyzed in Ledalab (Version 3.4.9; www.ledalab.de) applying the continuous decomposition analysis and we extracted the time integral of the SCR (Benedek & Kaernbach, Reference Benedek and Kaernbach2010) for further analysis.
Image acquisition and pre-processing
MRI scans were performed in nine different sites across Europe (online Supplementary Table S1). Whole-brain data were acquired with echo-planar T2*-weighted imaging (EPI), sensitive to the Blood Oxygenation Level Dependent (BOLD) signal contrast [36 axial slices (except for one site with 39 slices), 3 mm thickness; repetition time 2100 ms; echo time 35 ms; voxel size: 3 × 3 × 3 mm; Flipangle 74°; FOV = 192 mm]. Data were analyzed using SPM12 (www.fil.ion.ucl.ac.uk/spm/). The first five volumes were discarded to allow longitudinal magnetization to reach equilibrium. A high-resolution structural magnetization-prepared rapid gradient echo (MP-RAGE) scan was also acquired at a resolution of 1 × 1 × 1.2 mm. EPIs were interpolated in time to correct for slice time differences and realigned to the middle scan to correct for head movements. EPIs were co-registered and normalized to the standard EPI template in MNI space (Montreal Neurological Institute) using linear and non-linear transformations, and smoothed with a full-width-half-maximum Gaussian kernel of 8 mm. Realignment parameters were examined to ensure head movement did not exceed 3 mm.
Statistical analysis
Analysis of demographic and behavioral data
Group differences in demographic variables were analyzed using analysis of variance (ANOVA) or χ2 tests, when appropriate. Further, behavioral performance data of the face-matching task were assessed by repeated-measures ANOVA with an experimental condition (negative faces v. shapes) as the within-subject factor and a between-subject factor of group. Behavioral data were corrected using age, sex, IQ, and medication as covariates of non-interest.
fMRI analysis
For each participant, a General Linear Model (GLM) assessed regionally specific effects of task parameters on BOLD indices of activation (Friston et al., Reference Friston, Holmes, Worsley, Poline, Frith and Frackowiak1994). The model included experimental conditions (negative and positive faces and shapes), instructions, and task end, plus six realignment parameters as covariates of no interest, to account for residual motion-related variance. Low-frequency signal drift was removed using a high-pass filter (cut-off 128 s) and an autoregressive [AR(1)] correction for serial correlations was applied.
Contrast images for the comparisons of negative faces v. shapes and positive faces v. shapes were generated. Since we expected the largest effects in the negative faces v. shapes condition, we concentrated on this contrast. Exploratory analyses of the positive faces v. shapes and negative v. positive faces are reported in the Supplementary material. Group differences were assessed by means of a two-sample t test. For group comparisons, several brain regions, including the bilateral amygdala, insula, orbitofrontal cortex, and anterior cingulate cortex, were defined as region of interest (ROI) thresholded at a corrected FWE <0.05 level and corrected for each ROI analysis (0.05/4 = 0.0125). Further, the influence of the CU traits was analyzed by regression analysis coding groups as −1 for HCU, 0 for TDs, and 1 for LCU. Participants for the HCU group were selected based on the ICU means previously published (Lozier, Cardinale, VanMeter, & Marsh, Reference Lozier, Cardinale, VanMeter and Marsh2014; Sebastian et al., Reference Sebastian, McCrory, Dadds, Cecil, Lockwood, Hyde and Viding2014; Viding, Fontaine, et al., Reference Viding, Fontaine and McCrory2012). To obtain a reliable subgroup with HCU in our sample, participants had to score ⩾38, which represents 27.7% (n = 30) of the cases sample. Additionally, the influence and the differential effects of subtypes of aggression were analyzed applying a regression analysis including continuous measurements of RA and PA, separately.
Brain regions were defined with the Talairach Daemon atlas implemented in the Wake Forest University (WFU) PickAtlas (Lancaster et al., Reference Lancaster, Woldorff, Parsons, Liotti, Freitas, Rainey and Fox2000) using the atlas for automated anatomical labeling (Tzourio-Mazoyer et al., Reference Tzourio-Mazoyer, Landeau, Papathanassiou, Crivello, Etard, Delcroix and Joliot2002). Exploratory whole-brain analyses are reported at an uncorrected p < 0.001 level for clusters including at least 10 voxels. All analyses were controlled for age, sex, IQ, medication, and site.
Finally, to account for possible influences of ADHD, we repeated all analysis adding parent-rated ADHD (continuous variable measured with the SNAP-IV questionnaire). In addition to covariate analyses, it was tested how sensitive amygdala activity was for the variables of no interest (site, medication, and sex) in general. Additionally, we matched both groups for IQ and age and repeated the main analyses. Participants were randomly selected using MedCalc Software 18.9 (MedCalc Software, Mariakerke, Belgium)
Analysis of skin conductance response
In analogy to the behavioral data, SCR data were analyzed by repeated-measures ANOVA with within-subject factors experimental condition (negative faces and shapes) and a between-subject factor of group. Additionally, the relation between SCR, RPQ, and ICU total score was investigated with Pearson's correlations. SCRs were defined as responses between 0.9 and 4 s after stimulus presentation that needed to exceed 0.01 μs (Boucsein et al., Reference Boucsein, Fowles, Grimnes, Ben-Shakhar, Roth, Dawson and Filion2012). The SCR amplitude was log-transformed by means of 1 + logSCR to obtain normally distributed data.
Results
Sample characteristics
Table 1 shows the sample characteristics. From the 208 participants available for fMRI analysis, 31 participants were excluded due to excessive motion. Finally, 177 participants were included for analysis, 69 TDs and 108 cases (43 [39.8%] with ODD, 10 [9.2%] with CD alone, 19 [17.6%] with both diagnoses and 36 [33.3%] with a CBCL T value >70 in aggression or rule-breaking behavior). Compared to TDs, the cases group consisted of more males (p < 0.001), lower IQ (p < 0.001), and did differ marginally with regard to age (p = .078).
Table 1. Characteristics of the participants included in the functional magnetic resonance imaging analysis

CBCL, Child Behavior Checklist; ICU, Inventory of Callous-Unemotional Traits; RPQ, Reactive Proactive Questionnaire; SNAP-IV, ADHD total score; m, male; s.d., standard deviation; TD, typically developing peers.
a IQ estimated from a subset of the Wechsler Intelligence Scale for Children III (Wechsler, Reference Wechsler2003).
b For cases n = 98.
c For cases n = 81.
Behavioral data
Repeated-measures ANOVA for accuracy of correct emotional matching showed only a trend for significance between groups [F (1,171) = 2.826, p = 0.095]. Cases showed overall less accuracy compared to TDs. As expected, older participants showed a higher accuracy regardless of condition (p = 0.015). All other covariates were not significant. In a further exploratory RM-ANOVA with a within-condition factor for further separating emotions into angry, fearful, happy, and neutral faces and shapes, the interaction term condition × group was significant [F (4,684) = 2.805, p = 0.026]. Post-hoc tests revealed that the cases made more mistakes than TD in matching fear (p = 0.018) or neutral faces (p < 0.001). Regarding reaction times, no significant group differences were found [F (1,171) = 1.118, p = 0.292] but a trend for a condition × group interaction effect [F (1,171) = 2.775, p = 0.098] was found (online Supplementary Table S2).
fMRI
Group comparisons (cases v. TDs) for negative faces v. shapes
Figure 1 shows the group comparisons for the amygdala ROI using a t test, which revealed that cases had higher left amygdala activity compared to TDs [t (163) = 3.66, p fwe-corrected = 0.007, k = 9; x = −27, y = −4, z = −13]. No other effects were found in the ROIs. Group effects on a whole-brain level are depicted in online Supplementary Table S3. For positive faces v. shapes, see online Supplementary Table S4.
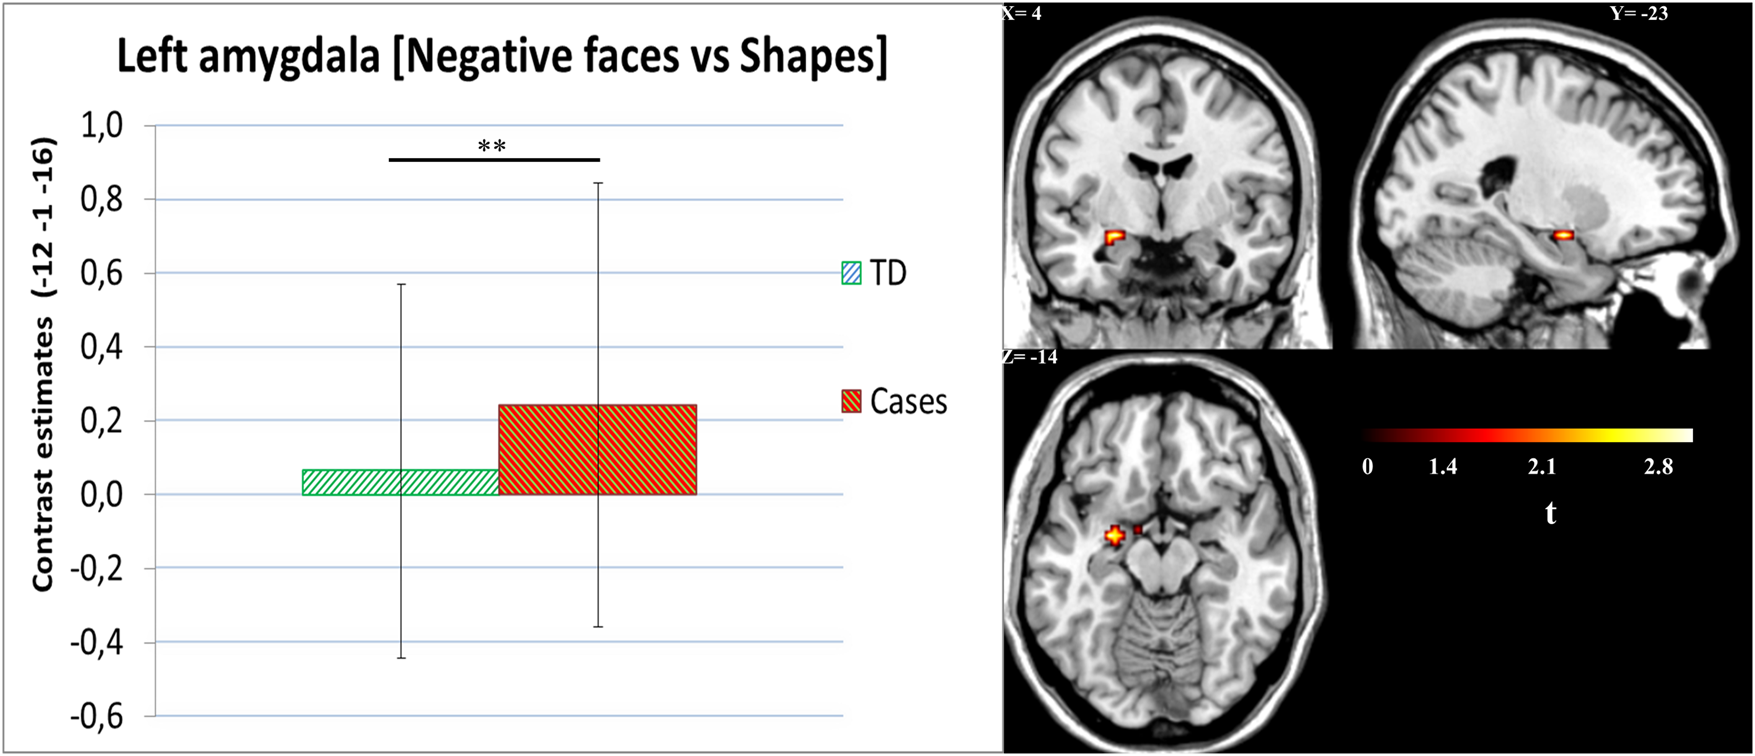
Fig. 1. Negative faces v. shapes. Left amygdala activity for cases v. TD group. Cases showed higher amygdala activity [t (163) = 3.66, p fwe-corrected = 0.007, k = 9; x = −27, y = −4, z = −13].Cases = ODD/CD, oppositional defiant disorder; CD, conduct disorder; TD, typically developing peers.
Effects of CU traits
In total, 166 participants were available with complete CU traits data, resulting in 30 cases HCU group, 64 TDs, and 72 cases LCU group. Interestingly, HCU participants were significantly older than the LCU subgroup, and showed significantly higher scores for proactive aggression (p < 0.001), but not for reactive aggression. For more details, see Table 2.
Table 2. Characteristics of the participants included in the regression analysis

CBCL, Child Behavior Checklist; ICU, Inventory of Callous-Unemotional Traits; RPQ, Reactive Proactive Questionnaire; SNAP-IV, ADHD total score; s.d., standard deviation; LCU, low ICU; HCU, high ICU; TD, typically developing peers.
a IQ estimated from a subset of the Wechsler Intelligence Scale for Children III (Wechsler, Reference Wechsler2003).
Regression analysis was only performed for the left amygdala, since only this ROI was significant at the group differences, and showed a significant association with CU traits [t (153) = 3.27, p fwe-corrected = 0.012, k = 3, x = −12, y = −1, z = −16]. The HCU group showed the lowest amygdala activity for negative faces v. shapes, TD children showing intermediate activity, and LCU children the highest activity for this contrast (Fig. 2). The whole-brain analysis is shown in online Supplementary Table S5. For the positive faces v. shapes contrast, no significant group difference or an association with CU traits was found.

Fig. 2. Left amygdala activity for negative v. shapes. Group-specific amygdala activity for negative v. shapes contrast depending on the CU subtypes [t (153) = 3.27, p fwe-corrected = 0.012, k = 3; x = −12, y = −1, z = −16]. HCU, high callous-unemotional traits; TD, typically developing peers; LCU, low callous-unemotional traits.
Effects of reactive and proactive aggression subtypes
When adding reactive and proactive aggression as covariates in the same model of CU traits, the effect of CU traits on the left amygdala remained significant [t (144) = 3.08, p fwe-corrected = 0.018, k = 1, x = −12, y = −1, z = −16]. Additionally, we assessed the RPQ without CU traits which did not show any significant association. Exploratory analysis for the cases group only showed a negative relationship with the proactive subscale for the left amygdala at a trend level [t (85) = 2.37, p fwe-corrected = 0.091, k = 1, x = −12, y = −1, z = −16]. At whole-brain level for both groups (at an uncorrected level), a positive relationship with the right fusiform area [t (150) = 4.10, p uncor<0.001, k = 15, x = −42, y = −34, z = −16] was observed.
Sensitivity analyses
ADHD as an additional covariate
To control for potential influences of ADHD symptoms, we added the SNAP-IV as a covariate. In total, 158 participants were available with complete ADHD symptom data. The inclusion of this covariate further strengthened the results of the main group comparison [left amygdala: t (143) = 3.63, p fwe-corrected = 0.008, k = 16; x = −24, y = −4, z = −13; right amygdala t (143) = 3.35, p fwe-corrected = 0.018, k = 16; x = 27, y = −4, z = −13] and for the CU effect [left amygdala: t (133) = 3.60, p fwe-corrected = 0.010, k = 6; x = −12, y = −1, z = −16].
Effects of control variables: medication, site, age, and sex
Medication was related to amygdala activity [F (1,164) = 7.814, p = 0.006], with higher amygdala activity during the negative v. shapes contrast in non-medicated participants [t (164) = 3.32, p fwe-corrected = 0.010, k = 8; x = −15, y = 2, z = −16]. A significant effect of site on amygdala activity [F (8,164) = 2.259, p = 0.026] was observed. Nevertheless, when excluding unbalanced sites (four sites with fewer than five participants per group), no significant impact of site was found [F (8,131) = 1.159, p = 0.181], and the main result did not change [t (131) = 3.53, p fwe-corrected = 0.011, k = 19; x = −24, y = −4, z = −13]. In addition, there was no significant effect of age and sex. For details, see online Supplementary Tables S6, S7, and S8.
Matching groups for age and IQ
Matching both groups left 112 participants (56 in each group) for the main analysis including sex and medication as covariates. Amygdala activity in the cases group remained significantly increased [t (110) = 3.12, p fwe-corrected = 0.018, k = 3; x = −27, y = −4, z = −13]. However, the CU effect reached only a trend (p = 0.081), presumably related to the lower sample size.
Skin conductance
Simultaneous fMRI and SC data were available for 37 cases and 26 TDs. A significant interaction between experimental condition and group was found [F (1,61) = 5.523, p = 0.022]. In the cases group, a lower SCR to negative facial stimuli (p = 0.002), but not to shapes (p = 0.280) was seen compared to TDs. The total score on the ICU scale was negatively associated with SCR for negative faces (r = −0.395, p = 0.001) and shapes (r = −0.300, p = 0.018) (Fig. 3). Additionally, significant correlations between RA (r = −0.292, p = 0.021), PA aggression (r = −0.286, p = 0.024), and RPQ total scale (r = −0.324, p = 0.010) were found for SCR of negative faces only.

Fig. 3 Skin conductance response and ICU. Skin conductance response (SCR). Cases showed lower SCR activity to negative faces. ICU was negatively associated with SCR and the CU. TD, typically developing peers; HCU, high callous-unemotional traits; LCU, low callous-unemotional traits; ICU, inventory of callous-unemotional traits.
Discussion
Our study addressed the neural characterization of aggression-related subtypes and CU traits in children and adolescents with aggression-related problems from a large multicenter cohort during a well-established and robust fMRI task. Cases showed different levels of amygdala activity during the presentation of negative faces v. shapes than TDs. However, even more importantly, when considering effects of CU traits, our results showed that increased CU traits were associated with amygdala hypoactivation, and that only patients with low CU traits showed increased amygdala activity to negative faces. This finding is in line with previous studies showing higher amygdala activity in youth with low CU traits, and lower activity in those with high CU traits (Viding et al., Reference Viding, Seara-Cardoso and McCrory2014). Regarding subtypes of aggression (reactive and proactive aggression), we did not find any significant association that survived family-wise correction, but there was a trend for a negative relationship between PA and amygdala activity to negative faces.
The general higher activity in the amygdala adds evidence to the heightened threat sensitivity theory in aggression-related disorders (Blair et al., Reference Blair, Leibenluft and Pine2014; Dotterer et al., Reference Dotterer, Hyde, Swartz, Hariri and Williamson2017; Viding, Fontaine, et al., Reference Viding, Fontaine and McCrory2012). Importantly, this effect remained stable after controlling for age, sex, medication, site, IQ, ADHD, and after excluding one outlier (>3SD). Additionally, our results revealed that this higher amygdala activity showed a phenotype-specific pattern for participants with significantly lower PA.
Concerning the differential effect of CU traits, our results showed that these traits are able to disentangle specific neural alterations, which is in line with previous findings (Jones et al., Reference Jones, Laurens, Herba, Barker and Viding2009; Lozier et al., Reference Lozier, Cardinale, VanMeter and Marsh2014; Marsh et al., Reference Marsh, Finger, Mitchell, Reid, Sims, Kosson and Blair2008; Viding et al., Reference Viding, Seara-Cardoso and McCrory2014; White et al., Reference White, Marsh, Fowler, Schechter, Adalio, Pope and Blair2012). It is worth noting that in our study, only the most severe CU patients (ICU >38) showed amygdala under-activation. This probably underlies our finding of on average increased amygdala activity across the entire sample of cases and highlights the importance of subtyping approaches when investigating the neural basis of aggression. Earlier studies using the same instrument found LCU-specific effects on amygdala activity, in an even higher CU traits population (ICU mean of 52) (Lozier et al., Reference Lozier, Cardinale, VanMeter and Marsh2014; Sebastian et al., Reference Sebastian, McCrory, Dadds, Cecil, Lockwood, Hyde and Viding2014; Viding, Fontaine, et al., Reference Viding, Fontaine and McCrory2012). In line with a recent study (Docherty, Boxer, Huesmann, O'Brien, & Bushman, Reference Docherty, Boxer, Huesmann, O'Brien and Bushman2017) which evaluated a cut-off for the ICU questionnaire (ICU>40), our finding might be an important result which might reflect a biological correlate (ICU⩾38; lower amygdala) which could be used in the classification of aggression-related disorders (specifier) and probably subtypes. Interestingly, the HCU subgroup showed higher scores for PA compared to the LCU subgroup. However, no differences between high and low CU subgroups were found for RA. Some studies showed that both aggression-related subtypes are associated with high CU traits (Kimonis et al., Reference Kimonis, Frick, Skeem, Marsee, Cruise, Munoz and Morris2008; Pechorro, Ray, Gonçalves, & Jesus, Reference Pechorro, Ray, Gonçalves and Jesus2017; Waller et al., Reference Waller, Wright, Shaw, Gardner, Dishion, Wilson and Hyde2015), while one study reported that only PA is correlated with CU traits (Urben et al., Reference Urben, Habersaat, Pihet, Suter, de Ridder and Stéphan2018), whereas in our sample, both PA and RA correlated high with CU traits (PA r = 0.51, RA r = 0.41). Further, while CU traits were obtained using parent-ratings, PA and RA were self-rated. Thus, we cannot rule out informant-based biases in self-ratings and further investigations using the same informants for all measures are warranted. Altogether, our result might suggest that CU traits measured via the parent-reported ICU questionnaire reflect stable traits, which are more prone to identify subtype-specific aggression.
Finally, the SC data showed general physiological hypoactivation in response to negative emotions in cases compared to TDs, and a negative association between SCR, CU traits, PA, and RA were found. These findings are in line with numerous studies (Blair, Reference Blair1999; Fanti, Reference Fanti2016; Herpertz et al., Reference Herpertz, Mueller, Qunaibi, Lichterfeld, Konrad and Herpertz-Dahlmann2005, Reference Herpertz, Huebner, Marx, Vloet, Fink, Stoecker and Herpertz-Dahlmann2008) showing reduced SC in aggression-related disorders, particularly those with high CU traits. However, the SCR and fMRI data showed divergent patterns with higher amygdala activity in the LCU subgroup when compared with TDs. This, together with the overall reduced SCR, might suggest an interrupted physiological circuit with neural processes involved in response to affective stimuli in cases within the LCU subgroup. However, this should be interpreted with caution, since our fMRI-SCR data were only based on a subsample of cases.
Strengths and limitations
The strengths of this study include a large sample of aggression-related disorders and TDs children and adolescents, the assessments of reactive and proactive aggression and CU traits, enabling to disentangle subtype- and trait-specific differences, and a well-established fMRI task to elicit amygdala activity. There are also limitations worth noting. First, the multicenter nature of this study, in which nine different institutes participated and contributed to a sample size which would have been difficult to reach at an individual site, might have also introduced heterogeneity. However, sensitivity analysis with fewer sites did not change the main results, indicating that this did not negatively influence the results. Second, our relatively small proportion of subjects high in CU traits (27.7%) suggests that our sample is predominantly reactively aggressive, since there were no significant differences between low and high CU subgroup on reactive aggression. Moreover, within the emotional face-matching task, there are two major shortcomings; (1) our task was an explicit emotional-matching task, whereas the majority of other studies used an implicit task (identifying gender) or passive viewing of emotions and (2) the negative faces included two emotions in a block design (fear and angry). These shortcomings could have diluted our effects as studies which showed CU effects on amygdala activity found mainly effects for fearful faces (Jones et al., Reference Jones, Laurens, Herba, Barker and Viding2009; Lozier et al., Reference Lozier, Cardinale, VanMeter and Marsh2014; Marsh et al., Reference Marsh, Finger, Mitchell, Reid, Sims, Kosson and Blair2008; Viding, Fontaine, et al., Reference Viding, Fontaine and McCrory2012). Interestingly, this is confirmed by our performance data with fewer correct responses specifically during the matching of fearful faces.
Conclusion
In summary, this large study compared children and adolescents with aggression-related problems v. TD during an fMRI emotional face-matching task, investigating the role of subtypes of aggression and CU traits. Overall, children and adolescents with high aggression showed amygdala hyperactivity in emotion and face processing areas, particularly in the subgroup with low CU traits. In contrast, in those with high CU traits, amygdala hypoactivity was observed. Our findings underline the importance to specify subtypes and CU traits in aggression-related disorders, brain-based evidence and therefore providing a possible biomarker, which could be used for improved diagnostics and personalized treatment.
Supplementary material
The supplementary material for this article can be found at https://doi.org/10.1017/S0033291720002111.
Acknowledgements
This project has received funding from the European Union's Seventh Framework Programme for research, technological development, and demonstration under grant agreement 602805 (Aggressotype) and no 603016 (MATRICS). This manuscript reflects only the author's view and the European Union is not liable for any use that may be made of the information contained herein. B. Franke received additional funding from a personal Vici grant of the Dutch Organisation for Scientific Research (grant 016-130-669) and from a grant for the Dutch National Science Agenda for the NWA NeurolabNL project (grant 400 17 602). S. Walitza received royalties from Thieme, Hogrefe, Kohlhammer, Springer, Beltz. Her work was supported in the last 5 years by the Swiss National Science Foundation (SNF), diff. EU FP7s, HSM Hochspezialisierte Medizin of the Kanton Zurich, Switzerland, Bfarm Germany, ZInEP, Hartmann Müller Stiftung, Olga Mayenfisch, Gertrud Thalmann Fonds. Outside professional activities and interests are declared under the link of the University of Zurich www.uzh.ch/prof/ssl-dir. T. Banaschewski served in an advisory or consultancy role for Actelion, Hexal Pharma, Lilly, Medice, Novartis, Oxford outcomes, Otsuka, PCM Scientific, Shire, and Viforpharma. He received conference support or speaker's fee by Medice, Novartis, and Shire. He is/has been involved in clinical trials conducted by Shire and Viforpharma. He received royalties from Hogrefe, Kohlhammer, CIP Medien, and Oxford University Press. JK Buitelaar has been a consultant to/member of the advisory board of and/or speaker for Janssen Cilag BV, Eli Lilly, Bristol-Myer Squibb, Shering Plough, UCB, Shire, Novartis, and Servier. He is not an employee of any of these companies, nor a stock shareholder of any of these companies. D. Brandeis serves as an unpaid scientific consultant for an EU-funded neurofeedback trial. C. Arango has been a consultant to or has received honoraria or grants from Acadia, Ambrosseti, Caja Navarra, CIBERSAM, Fundación Alicia Koplowitz, Forum, Instituto de Salud Carlos III, Gedeon Richter, Janssen Cilag, Lundbeck, Merck, Ministerio de Ciencia e Innovación, Ministerio de Sanidad, Ministerio de Economía y Competitividad, Mutua Madrileña, Otsuka, Roche, Servier, Shire, Schering Plough, Sumitomo Dainippon Pharma, Sunovio, and Takeda. All other authors report no potential conflict of interest. The present work is unrelated to the above grants and relationships. The authors express their deepest gratitude to all participating children and adolescents and their families.


