


1. Introduction
The ship domain represents the surrounding effective waters which the navigator would like to keep free with respect to other ships and fixed objects (Goodwin, Reference Goodwin1975; Rawson and Brito, Reference Azevedo, Ciuffo, Cardoso and Ben-Akiva2020). Great efforts have been made in the research of ship domain models. The ship domain model is of great significance to the safety of inland shipping and the comprehensive utilisation of water resources (Liu et al., Reference Liu, Wang and Wu2011). Meanwhile, the concept of ship domain has been widely applied in the study of navigation safety, especially in open waters, since the 1970s (Fujii and Tanaka, Reference Fujii and Tanaka1971; Goodwin, Reference Goodwin1975; Wang et al., Reference Wang2017).
In the literature, the ship domain models are divided into three types according to their shapes: the circular ship domain, the elliptical ship domain and the polygonal ship domain. Relevant methods for ship domain modelling are divided into three categories: statistical-based methods (Coldwell, Reference Coldwell1983), analytical expression-based methods (Chen and Guo, Reference Chen and Guo2008), and intelligent technology-based methods (Zhu et al., Reference Zhang, Montewka, Manderbacka, Kujala and Hirdaris2001; Chen et al., Reference Chen, Chen, Zhang, Cheng, Zhang and Wu2020). In statistical-based methods, using the ship domain calculation method based on statistics combined with the navigation characteristics of navigable waters and water collision avoidance rules, traffic observation data are analysed to determine the shape and size of the ship domain (Liu et al., Reference Liu, Wang and Wu2011). Statistical-based methods have been used in several ship encounter situations. Therefore, these models have been simulated and analysed. Based on the dynamic model, the polygonal ship domain was obtained focusing on different encounter situations in open waterways, poor visibility and narrow waterways (Pietrzykowski and Uriasz, Reference Pietrzykowski and Magaj2004, Reference Pietrzykowski and Uriasz2006, Reference Pietrzykowski and Uriasz2009). Statistical research on inland ship domains has also been performed to investigate their characteristics. The method based on the analytical expression for calculating ship domain includes the speed, heading and position of the target ship and other ships as inputs using the ship motion equation. The deceleration model or the steering equation is utilised to calculate the minimum distance which the ship could maintain in all directions. Thus, the ship domain model is finally derived. Concerning analytical expression-based methods, the quaternion ship domain model is proposed to calculate the minimum range in four directions around the ship based on the ship's length and speed (Zhang et al., Reference Zhang, Goerlandt, Montewka and Kujala2021). The methods based on intelligent technology generally include fuzzy theory and neural networks, among which the fuzzy theory is usually adopted for establishing the mapping relationship between the ship distance, the heading and relative orientation of the ship and the navigational risk of the ship. Thus one can proceed to determine the fuzzy boundaries of the ship domain (Pietrzykowski, Reference Pietrzykowski2008).
The dense vessel traffic flow near bridge-waters, which refer to the waters within a certain distance along the bridge axis, exert high pressure on the inland maritime administration. Although ship domain models have been accomplished, there are few studies in the literature focusing on ship domain models for inland waterways (Szlapczynski and Szlapczynska, Reference Szlapczynski and Szlapczynska2017), especially the area near bridge-waters where collisions between ships and bridge piers often occur due to human error (Zhang et al., Reference Zhang, Meng, Xiao and Fu2020). Because of the special navigation rules and conditions near bridge-waters, the ship domain model is expected to be different from the conventional models, and its characteristics need to be further explored.
AIS (automatic identification system) data are crucial for research on navigation safety. They provide not only guidance for ship collision avoidance, but also an effective way of retrieving ship trajectories. The frequencies of ship collisions and possible near-miss ship collisions have been widely investigated by researchers (Montewka et al., Reference Montewka, Hinz, Kujala and Matusiak2010; Weng et al., Reference Weng, Meng and Qu2012; Zhang et al., Reference Xiao, Ligteringen, Gulijk and Ale2015). Shipping risks were analysed by Wang et al. (Reference Wang, Yan, Wang and Wu2017) and Felski and Jaskólski (Reference Felski and Jaskólski2013); analysis of ship traffic behaviour and a traffic simulation model were presented by Xiao et al. (Reference Willems, Scheepens, van de Wetering and van Wijk2015) and Azevedo et al. (Reference Azevedo, Ciuffo, Cardoso and Ben-Akiva2015). In other research, situational awareness of inland navigation was achieved through vessel trajectory visualisation and traffic density mapping (Willems et al., Reference Willems, Scheepens, van de Wetering and van Wijk2013). Therefore, AIS data could be helpful for research on ship domain in the vicinity of bridge-waters since massive historical AIS data can reflect the actual navigation conditions to a certain extent (Pietrzykowski and Magaj, Reference Pietrzykowski and Magaj2017; Zhang et al., Reference Zhang and Meng2017; Zhang and Meng, Reference Xiang, Hu, Shi and Yang2019; Rawson and Brito, Reference Pietrzykowski and Uriasz2021).
In this paper, the ship domain model for inland navigation on multi-bridge waterways is established by using AIS data. Ship domain is defined as the area free from ships and fixed objects, which mainly refers to bridge piers in multi-bridge waterways. Firstly, the inland ships are classified by their speed and length, and the trajectory distribution of surrounding ships is determined. The relative distance between ships and bridge piers is calculated when ships are passing through bridges. Secondly, the nearest point boundary determination method is adopted, and the elliptical ship domain is established. The shape of the ship domain (i.e., the longitudinal and lateral radii) is computed by the least squares method. Its relationship with the ship's length and speed is thus discussed. Fuzzy quaternion ship models are also presented for inland ships and bridge piers. A case study is carried out in the Wuhan reach of the Yangtze River, China. The model results are noted as consistent with field observations and the literature.
The main part of this study is organised as follows: the methods for construction of ship domain based on AIS data and calculation of the regional collision risk are introduced in Section 2. In Section 3, a case study is conducted in the Yangtze River, China, including the construction of the ship domains near bridge-waters, comparison between different domains, and analysis of the characteristics of collision risk distribution. In Section 4, the conclusions are presented.
2. Methodology
This section includes two parts, the first part describes the process of construction of ship domain in detail. The second introduces the risk assessment based on the fuzzy quaternion ship domain. The aim is to analyse ship collision risk by establishing the fuzzy quaternion ship domain for bridge-waters. The nomenclature table (Table 1) explains the meaning of the variables in this paper.
Table 1. Description of variables

2.1 Construction of ship domain
The ship domain is determined by the relative positions of ships near bridge-waters. In order to determine the parameters of the ship domain model, the ships are classified according to their length and speed, and the position and direction of the neighbouring ships are superimposed to obtain the scope of the specific type of ships. In some research, the type of ship is supposed to be related to ship domain size (Szlapczynski and Szlapczynska, Reference Rawson and Brito2017). In narrow and crowded waters, however, the ship's length and speed are mainly considered. In this paper, ‘target ships’ refers to ships sailing in the research domain.
After preprocessing of AIS data, the moving ships are selected as target ships. The position and direction of the neighbouring ship are calculated during the current trajectory time of the target ship; multiple data are superimposed to obtain the ship domain of a single ship. According to the ship's length and speed, the data is classified and superimposed to obtain the ship domain of a specific ship type (Xiang et al., Reference Weng, Meng and Qu2015). The algorithm flow of statistical analysis is shown in Figure 1.

Figure 1. Flowchart of ship domain statistical algorithm
As shown in Figure 1, the flowchart is composed of five critical processes: preprocessing of AIS data, selection of target ship, superimposition of single ship data, superimposition of data of the same type of ship and obtaining the ship domain of the specific type of ship. The specific steps are as follows:
• AIS data preprocessing
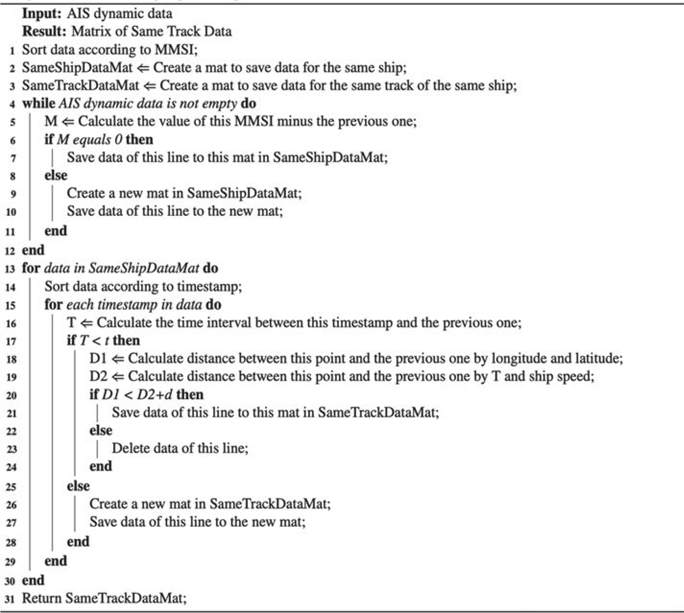
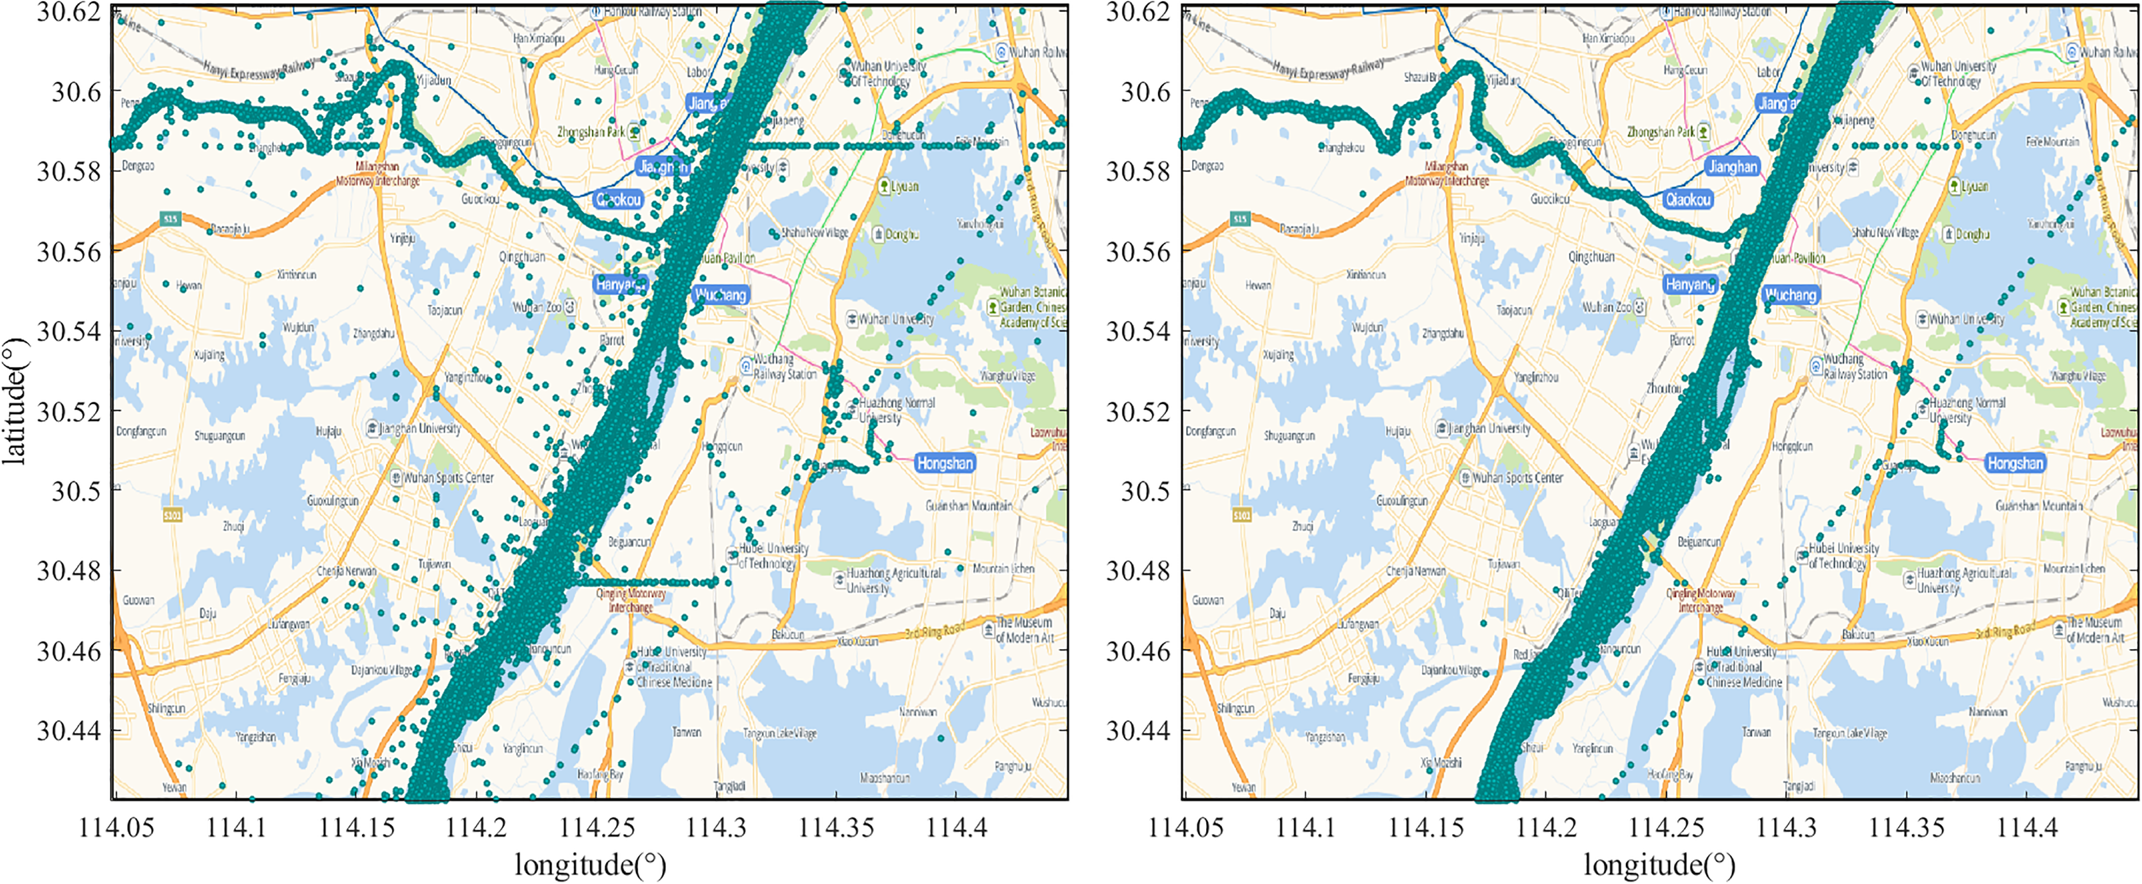
• Ships whose length or width do not conform the actual static data are excluded. The dynamic AIS data are cleansed by frequency and maritime mobile service identity (MMSI). The latitude and longitude drift data are filtered out. Ship trajectories are restored. The AIS data preprocessing is generally demonstrated as the following algorithm 1 (Zhang et al., Reference Zhang, Zhang, Fu, Yan and Goncharov2018), and the results are presented in Figure 2. Although some points are not eliminated due to the method based on the spatial distance between adjacent points, they have no impact on subsequent content about ship domain statistics.
Algorithm 1: AIS Data pre-processing.

Figure 2. Comparison of inland AIS data before (left) and after (right) preprocessing
• Target ships selection
• Select various types of ships in the research domain with stable speeds of not less than 3 knots as target ships from AIS data according to the partition method of reporting intervals in ITU-R m.1371-4 Proposal (ITU, 2010).
• Data matching
• To reduce the calculation complexity and improve the efficiency of the algorithm, the matching process is divided into two steps: preliminary matching and advanced matching. The preliminary matching uses overlapping timestamps to determine that the ships appear in a certain area at the same time. Meanwhile, the advanced matching can find the ship's trajectory point within the target ship's range, which is prepared for ship domain analysis. When another ship's timestamp is different from the target ship, it is necessary to predict their movement at the same time. In this paper, piecewise cubic Hermite interpolation is adopted to obtain the prediction result.
• Coordinate transformation
• Firstly, because the accurate location of ship-borne AIS is not available at the moment, the AIS antenna position is regarded as the centre of the target ship. Furthermore, since the latitude and longitude data cannot be directly used for coordinate calculation, latitude and longitude are converted to Universal Transverse Mercator (UTM) coordinates. Let $\theta$
denote the angle between ship heading and the north direction, $({a,b} )$ and $({x,y} )$ represent the UTM coordinates of target ship and neighbouring ship respectively, the coordinate transformation is performed for neighbouring ships (in Figure 3). The origin is set at the position of the target ship.
(1)\begin{align}x^{\prime} & = ({x - a} )^{\ast} \cos\theta - ({y - b} )^{\ast} \sin\theta \end{align}
(2)\begin{align}y^{\prime} & = ({x - a} )^{\ast} \sin\theta + ({y - b} )^{\ast} \cos\theta \end{align}
• Distance and angle calculation
• Through the above coordinate transformation, the distance between the target ship and neighbouring ship can be calculated as follows:
(3)\begin{equation}\textrm{Dis} = {({a - x} )^2} + {(y - b)^2}\end{equation}The clockwise angle between other ships and the target ship can be calculated as follows:
(4)\begin{align}k & = ({\vec{m} \otimes \vec{n}} )/({|{\vec{m}|{^{\ast} } |\vec{n}} |} )\end{align}
(5)\begin{align}\delta & = \textrm{Arc}\cos(k )\end{align}
(6)\begin{align}\delta & = \begin{cases} \delta , & x^{\prime} > 0\\ 360 - \delta,& x^{\prime} < 0 \end{cases}\end{align}


$\vec{m}$ represents the positive direction of the y-axis, which can be taken as (0,1), $\vec{n}$
 denotes the transformed coordinates of neighbouring ships $(x^{\prime},y^{\prime})$
 .
.
• Distance conversion
• To obtain the ship domain, the spherical distance is projected into the transformed coordinate:
(7)\begin{align}\textrm{Lx} & = \hbox{Dis}^{\ast} \sin\delta \end{align}
(8)\begin{align}\textrm{Ly} & = \mathrm{Dis}^{\ast} \cos\delta\end{align}
• Statistical results
• The ships are classified according to their length and speed, and superimposed on this basis to obtain the distribution map of other ships and bridge piers, so as to calculate the characteristic parameters of the ship domain. The ship domain boundary is fitted by the least squares method based on the nearest points around the target ship (Section 3.1).
• Ship domain model construction
• Considering that ships are in a relatively crowded scenario when passing through river bridge-waters, the domain model of the target waters is constructed based on the model proposed in the papers (Jia, Reference Jia1989; Fan et al., Reference Fan, Zhang, Zhou, Tan and Wang2013) in which the ship domain model in congested river water areas is analysed, as follows:
(9)\begin{align}\it{a}& = \frac{1}{2}{LKv}\end{align}
(10)\begin{align}\it{b} & = \frac{1}{2}{BK}{{v}^{{k_0}}}\end{align}


where a and b indicate the longitudinal and lateral radii of the shipping domain respectively, L and B represent the length and width of the ship, v is the speed over ground of the target ship, K is a positive scale factor and K 0 is a constant less than 1. Since the focus is on the influence of the ship's length and speed on the ship domain, the ship width is replaced by ship's length with a coefficient:


Figure 3. Schematic diagram of coordinate transformation
2.2 Collision risk quantification model
Based on the statistical analysis of inland ship domain, a spatial collision risk quantitative model combined with a novel inland fuzzy quaternion ship domain model is proposed to quantify collision risk (Szlapczynski and Szlapczynska, Reference Szlapczynski and Szlapczynska2017). In this paper, collision risk refers to the probability of collision between ships or between ships and bridge piers. The key of collision risk assessment is the degree of invasion of one ship to another. Therefore, fuzzy quaternion ship domain is first introduced to distinguish different levels of intrusion, and then a collision risk quantification model is constructed. Then, the method of regional risk grid calculation is proposed to visualise the collision risk in a specific area, which is helpful to understand the risk pattern of ships passing through particular bridge-waters.
2.2.1 Fuzzy quaternion ship domain
In view of the fact that the longitudinal and lateral radii of the ship domain selected in this paper are determined by the nearest point of the target ship, the model of the ship domain can be further constructed by means of the fuzzy quaternary ship domain. Generally, a fuzzy quaternion ship domain model (Pietrzykowski, Reference Pietrzykowski2008; Szlapczynski and Szlapczynska, Reference Szlapczynski and Szlapczynska2017) is defined as follows:


where ${\mathop{\rm sgn}} x = \left\{ {\begin{array}{*{20}{c}} {1,x \ge 0}\\ { - 1,x < 0} \end{array}} \right.$ , ${R_{\textrm{before}}}$
 , ${R_{\textrm{after}}}$
 , ${R_{\textrm{starb}}}$
 and ${R_{\textrm{port}}}$
 represent the radius in the four directions of forward, after, port and starboard, respectively, as shown in Figure 4. r is the value corresponding to the boundary of a ship domain (${r_0} = 0.8$
 is adopted in the present study considering the innermost layer), thus the values of r from inside to outside are respectively 0⋅8, 0⋅6, 0⋅4, 0⋅2.

Figure 4. Schematic diagram of fuzzy quaternion ship domain model
2.2.2 Collision risk quantification model
For the purpose of calculating collision risk, the fuzzy quaternion ship domain is applied to develop the longitudinal collision risk model and the lateral collision risk model of the ship (Zhang and Meng, Reference Zhang and Meng2019). The spatial collision risk quantitative model is then obtained. The longitudinal collision risk model is mainly for the calculation of the risk in the fore and rear directions of the ship during navigation. The model is defined as follows.

where $\textrm{LonC}{\textrm{R}_k}$ represents the longitudinal collision risk, and x and y represent the relative position of the neighbouring ship (or pier) to the target ship shown in Figure 3, while other symbols have been explained in the previous section. The lateral collision risk model is used to calculate the risk value in the port and starboard. The model definition is shown as follows.

where $\textrm{LatC}{\textrm{R}_k}$ represents the lateral collision risk. Through the above two quantitative models, the spatial collision risk ($\textrm{SCR}$
 ) quantitative model is established and defined in Equation (17).

2.2.3 Regional collision risk calculation
Based on the $\textrm{SCR}$ for the calculation of single ship spatial collision risk, the regional collision risk could be quantified, superimposed and visualised. The detailed process is shown as follows:
1 Area gridding: according to the longitude and latitude range of the area and the grid size, the water area is divided into grids.
2 Data selection: select ships navigating in the specified area within a specified time period.
3 Data matching: transforming coordinates and calculating distances are the same as the steps described in Section 2.1.
4 Ship risk evaluation: the risk of the target ship is calculated according to the distance measurement and spatial collision risk model aforementioned;
5 Grid risk accumulation: the position of the target ship is matched to the grid of the water area. Then the collision risk of each grid is superimposed to obtain the grid ship collision index ($\textrm{GSCI}$
). Finally, we obtain the distribution of ship collision risk in the water area.
(18)\begin{equation}\textrm{GSC}{\textrm{I}_{(X,Y)}} = \sum_i^n {\textrm{SC}{\textrm{R}^i}} {}_{(x,y)},(x \in X) \cap (y \in Y)\end{equation}


where $\textrm{SC}{\textrm{R}_{(x,y)}}$ refers to the collision risk of the corresponding grid and $X,Y$
 indicates the longitude and latitude coordinates of the grid.
3. Case study
A case study has been conducted on bridge-waters in the Wuhan reach of the Yangtze River. The target ships are divided into different categories to analyse the relationship between ship domain and ship's length and speed. After obtaining the ship domain boundary through the construction process outlined in Section 2.1, the relationship between ship domain near bridge-waters and ship's speed and length is analysed, and then two ship domain models are constructed. In order to evaluate these models, comparison between the ship domains in this study and other popular domains is performed, and the model based on ship–pier data is applied to the actual on-going ship passing through the WYRB. Finally, the collision risk distribution for different bridges is characterised on the basis of $\textrm{GSCI}$ when ships pass through.
3.1 Statistical analysis of inland ship domain
The Wuhan reach of the Yangtze River has been characterised as a multi-bridge waterway. There are eight bridges within the research domain: Zhuankou Yangtze River Bridge (ZYRB), Baishazhou Yangtze River Bridge (BYRB),Wuhan Yangsigang Yangtze River Bridge (WYYRB), Yingwuzhou Yangtze River Bridge (YYRB), Wuhan Yangtze River Bridge (WYRB), Wuhan Yangtze River Second Bridge (WYRSB), Wuhan Erqi Yangtze River Bridge (WEYRB) and Tianxingzhou Yangtze River Bridge (TYRB), from upstream to downstream (as presented in Figure 5). A total number of 5,994 trajectories are derived for statistical analysis in the present study. Navigation marks have been set up to ensure water transport safety in the research domain. Their positional information is obtained from the Yangtze River Maritime Bureau, Ministry of Transport, China.

Figure 5. The layout of bridges in the research domain
Ships navigating on multi-bridge waterways should avoid collisions with neighbouring ships, piers and navigation marks. Therefore, the statistics of ship domain based on other ships, bridge piers and navigation marks are separately counted. Since the speed of inland ships varies with ship's length, the ships are divided into seven categories according to their length (m) as: <20, 20–39, 40–59, 60–79, 80–99, 100–119, and >120; the distribution of ship lengths is shown in Figure 6. Ships with a length of 40–59, 60–79, 80–99 and 100–119 were selected for the present study. The distribution of ship speeds is therefore provided for the corresponding ships (Figure 7).

Figure 6. Distribution of ship lengths

Figure 7. Distribution of average ship speeds
According to the method described above, the spatial distribution of other ships and navigation marks around the target ship could be obtained. To determine the boundary of the ship domain, the distance corresponding to other ships and bridge piers in all directions around the target ship needs to be computed. In view of the navigation rules and restrictions in multi-bridge waterways, ships are not allowed to surpass. Generally, both up-bound and down-bound ships keep to the right on the waterways. In other words, oncoming ships sail on the left side of the target ship. Combined with the least squares method, nearest boundary points of the target ship are used to determine the boundary of the ship domain. Specifically, it can be divided into two steps: firstly, the 600 m circular water area around the target ship is divided into 72 sectors with intervals of 5o, and the nearest boundary point is determined for each sector; secondly, the least squares method is used to fit the elliptical ship domain boundary after obtaining the 72 distance values in different directions. The selection of nearest boundary points is also based on the construction of a fuzzy ship domain model, and the boundary based on nearest boundary points can be the innermost boundary.
3.1.1 Ship domain statistics based on other ships
As stated before, ship trajectories have been classified and analysed according to the ship's length and speed. The distribution of other ships around target ships is thus matched and spherical distances are calculated. The spatial distribution of other ships is presented in Figure 8. The origin denotes the position of the target ship while the blue points represent surrounding ships.

Figure 8. Spatial distribution of ships (blue points) around target ships of four different lengths and speeds
The analysis flow of visual exploration is schematically shown in Figure 2. First of all, the differential distance is calculated from the raw data and displayed in a scatterplot. According to the visualisation of distance in the scatterplot, the data quality problems are identified and their spatiotemporal distribution is displayed on figure by interacting with the scatterplot. Finally, the hidden values of dirty data are explored by means of interaction and observation with the distribution graph and the four-quadrant stacked graph.
Some ships on the left travel in the opposite direction without characteristics of the ship domain boundary. Therefore, the relevant positional information should be excluded during the boundary determination. In the present study, the following rules have been defined and applied:
Rule I: the boundary points with positive abscissa values higher than the positive mean value or with negative abscissa lower than the negative mean value will be deleted;
Rule II: the boundary points with a distance from the centre greater than the threshold (X) will be deleted; the value of X is determined according to the actual situation.
By analysing the spatial distribution of other ships (in Figure 9), the threshold value of X is defined as 400. The fitting results of the elliptical ship domain boundary are illustrated in Figure 10. The major and minor axes are calculated for each elliptical ship domain and tabulated (in Table 2). The accuracy of elliptical ship boundary fitting is affected by the sample dataset. Therefore, part of the elliptical ship domain calculation has been excluded for analysis, e.g., the last row in Table 2.

Figure 9. Fitted elliptical ship boundary for ships with different speeds

Figure 10. The horizontal interface of the target ship domain for four ships of different lengths and speeds
Table 2. Elliptical ship domain size for ships of different length and speed

The Pearson correlation coefficients of the major axis, minor axis and ship's speed under the same ship's length are 0⋅9375/0⋅9498/0⋅8721/0⋅9363, 0⋅5609/0⋅9818/0⋅4823/0⋅8627, which indicates that there is a strong linear relationship between shipping and the major and minor axes of ship domain. In other words, the ship domain will vary according to ship's speed. This is consistent with the results of applying the density-in-cell method (Wen et al., Reference Wen, Li, Zheng, Huang, Zhou and Xiao2018). The correlation coefficients of the major axis, minor axis and length of the ship at the same speed are 0⋅8901/0⋅7900/0⋅9667/0⋅7173, 0⋅8075/0⋅7765/−0⋅1942/0⋅8265 respectively, which also illustrates that the major and minor axes of the ship domain will vary with the ship's length.
The sectional distribution patterns around the target ship are also explored. Take the minor axis section as an example (as shown in Figure 10), the water area near the target ship is divided by grids with the side length of 10 m, the x-axis represents the number of each grid where neighbouring ships in the port and starboard sides are located while the target ship is located in No.30 grid, and the Y coordinate indicates the frequency of the number of neighbouring ships in a corresponding grid divided by the total number of ships in all the grids. The frequency of neighbouring ships in the grid between No. 0 and No. 30 is higher than that in the grid numbered larger than 30. This is because both up-bound and down-bound ships keep to the right on the waterways, which can be seen in Figure 9. Although fluctuations are noted for the transverse frequency distribution, characteristics of the ship domain are found to be similar to Wen et al. (Reference Wen, Li, Zheng, Huang, Zhou and Xiao2018). However, compared with the relationship between the major and minor axis of the ship domain and the ship's length in Wen et al. (Reference Wen, Li, Zheng, Huang, Zhou and Xiao2018), the ratio in the present study is found to be smaller, especially on the minor axis. On the other hand, compared with the results in Table 2 obtained by nearest boundary point and least squares method, the minor axis is relatively close, which verifies the effectiveness of the aforementioned method of obtaining the boundary. However, it does not show the relationship between ship domain and ship's speed and ship's length because it only considers peak values on the port and starboard sides instead of boundaries in all directions.
3.1.2 Ship domain statistics based on bridge piers
The position of the bridge pier relative to the target ship is overlapped and counted when the target ships pass by. Figure 11 shows the spatial distribution of ships passing through specified bridge piers with different speeds. The origin denotes the target ships while the blue points represent the relative location of the bridge pier.

Figure 11. Spatial distribution of ships passing through bridge piers
Figure 11 shows that most of the ships do not go straight ahead when they pass through the vicinity of bridge-waters. Instead, they either deflect to the right and then to the left or keep skewing to the left. The ship domain boundary based on the bridge pier is obtained by the method for the nearest boundary point as described above. The fitted elliptical ship boundary for ships passing through bridge piers is presented in Figure 12. Meanwhile, the results of major and minor axes calculations are shown in Table 3.

Figure 12. Fitted elliptical ship boundary for ships passing through bridge piers
Table 3. Elliptical ship domain size for ships of different length and speed passing through piers

The ship domain model of navigation marks is also investigated in the present study. However, the results indicate no obvious evidence of its existence. Since the navigation marks are relatively small compared with the ships and their location is not fixed, ship domain based on navigation marks is not obvious. This will not be considered and discussed hereinafter.
3.2 Ship domain model in WYRB waters
Based on the statistical results in Section 3.1, the ship domain was constructed based on other ships and piers respectively.
3.2.1 Fuzzy elliptical ship domain model based on ship–ship data
According to the above-mentioned quaternion ship domain model, given ${R_l} = {R_{\textrm{before}}} = {R_{\textrm{after}}}$ and ${R_s} = {R_{\textrm{strab}}} = {R_{\textrm{port}}}$
 , the function fitting the longitudinal and lateral radii with the ship's speed and the ship's length using least squares is obtained, as shown in the following equation:


where ${R_l}$ and ${R_s}$
 represent the longitudinal and lateral radii respectively, v and l represent the speed and length of target ships. The ship domain model is shown on the right of Figure 13.

Figure 13. Fuzzy ship field model based on the neighbouring ships (left) and bridge piers (right)
3.2.2 Fuzzy elliptical ship domain model based on ship–pier data
Using the above method to curve fit the ship domain based on bridge piers, the following formulas for the longitudinal and lateral radii are obtained:


where ${R_l}$ and ${R_s}$
 represent the longitudinal and lateral radii respectively, v and l represent the speed and length of target ships. The ship domain model is shown on the right of Figure 13.
The ship domain is compared with the traditional ship domains, including Fujii's domain (Fujii and Tanaka, Reference Fujii and Tanaka1971), a quaternion ship domain. The Goodwin's domain (Goodwin, Reference Goodwin1975) is not drawn in the figure because it is much bigger than other domains. Figure 14 shows the comparison results. From outside to inside, they are, respectively: Fujii's domain, ship domain based on ship–pier data, and ship domain based on ship–ship data. Specifically, the rear boundary of the ship domain based on ship–ship data is basically equal to that of the quaternion ship domain. In terms of the fore boundary, the ship domain based on ship–pier data approximately matches the quaternion ship domain. The difference between the quaternion ship domain and other domains lies in the port and starboard, because the boundary distance in port and starboard is even greater than that in the fore and rear directions. It seems that the estimation method of longitudinal and lateral radii in the quaternion ship domain is not suitable for bridge-waters.

Figure 14. Comparison of ship domain models
To evaluate further the applicability of the proposed ship domain, the ship domain based on ship–pier data is applied to the actual moving ship. In Figure 15, the scenario of target ship passing through the WYRB waters is illustrated. The piers are mainly located between the boundaries corresponding to $r = 0.4$ and $r = 0.2$
 of the fuzzy ship domain when the ship passes through the bridge in the centre between the piers, which means that the collision risk is relatively small and verifies the effectiveness of the model.

Figure 15. Ship domain for ships passing through WYRB ((a). The first stage of target ship passing WYRB waters, the pier on the one side starts to enter the boundaries corresponding to r = 0.2; (b). The second stage of target ship passing WYRB waters, the pier on the other side starts to enter the boundaries corresponding to r = 0.2; (c). The third stage of target ship passing WYRB waters, the piers on the two side are located between the boundaries of r = 0.2 and r = 0.4; (d). The fourth stage of target ship passing WYRB waters, the piers on the two sides start to leave the ship domain boundaries)
3.3 Collision risk analysis in bridge area
The concept of ship domain is broadly adopted for collision risk analysis in maritime traffic. Therefore, risk analysis for ships passing WYRB was conducted on the basis of the fuzzy quaternion ship domain model. In the beginning, the collision risk evaluation model was developed based on the fuzzy quaternion ship domain model mentioned above. Then, through the accumulation of regional collision risks, the risk analysis of ship navigation in the vicinity of bridge-waters was conducted.
In the present collision risk analysis, the aim is to measure and visualise the collision risk when ships navigating upstream and downstream pass through the bridge-waters. On the basis of the fuzzy quaternion ship domain based on bridge piers, analysis of the collision risk of ships passing the bridge is carried out. Figures 16–18 show the results of visualisation of collision risk when a number of ships pass through different bridges in turn. The colour bar shows the superimposed quantitative result of collision risk based on Equation (20) when ships passed the bridge.

Figure 16. Collision risk heatmap of downstream ships passing through the bridge

Figure 17. Collision risk heatmap of upstream ships passing through the bridge

Figure 18. Collision risk heatmap of upstream and downstream ships
It can be seen from Figures 16–18 that there are major differences in collision risk when ships pass through three particular bridges: WYRB, TYRB and BYRB. When a ship passes the WYRB, the risk zone is longer and thinner, and the maximum collision risk is also significantly higher than at the others. These patterns can be explained by the diameters of the navigation areas at WYRB, TYRB and BYRB, which are are 128 m, 504 m and 618 m, respectively. As a result, affected by the bridge-waters’ navigation conditions, when a ship passes the narrower channel between piles of WYRB, the collision risk is higher than that of TYRB and BYRB.
4. Conclusions
The ship domain plays an important role in the assessment of collision risk. However, few research studies have considered the practical considerations of implementing this method with regard to collission risk near bridge-waters. In order to solve this problem, this paper has investigated the characteristics of the inland ship domain model in multi-bridge waterways considering ship–ship collision and ship–pier collision based on historical AIS data. Combined with the ship domain model, a grid ship collision index (GSCI) has been proposed, which realises the regional risk grid calculation and realises the visualisation and analysis of the collision risk near bridge-waters. Taking the multi-bridge waterways in the Wuhan waterway of Yangtze River as an example, the conclusions have been drawn as follows. Firstly, the ship domain based on navigation marks is not obvious, while the domains of neighbouring ships and bridge piers obviously exist. Secondly, the Pearson correlation coefficients of the longitudinal and lateral radii and ship's speed and ship's length are calculated after the ship domain boundary is determined by the nearest boundary point method, which indicates that there is a strong relationship between them. The models were also compared with others and it was found that the models are relatively small but move suitably for bridge-waters. Thirdly, the collision risk of ships passing through different bridges is quite different. The risk zone will be thinner and longer when the navigation area of the bridge is smaller.
Through the ship domain models constructed by the proposed method and the results of analysis of collision risk, this paper has demonstrated the application of ship domain in quantifying collision risk. In addition, a visual analysis of the collision risk near bridge-waters has been performed, which helps to characterise the collision risk distribution, provide guidance for maritime supervision and improve the safety of ships passing through bridge-waters. The accuracy of the model could be affected by the amount of sample data and the data for specific ship length and ship speed not being enough to obtain the corresponding boundaries of ship domain reliably. The ship domain may also be related to the ship type, which is not involved in this work due to the consideration of previous studies and the incompleteness of static data in AIS data. Therefore, the fuzzy quaternion ship domain would be further developed on the basis of more comprehensive consideration. On the other hand, future research can focus on the early warning of collision accident of ships passing the bridge-waters according to the distribution of collision risk in the area and the real-time status of ship navigation.
Acknowledgement
This work is supported by the Fujian Province Natural Science Foundation (No. 2018J01506, 2020J01860), and University-Industry Cooperation Programme of the Department of Science and Technology of Fujian Province (No.2019H6018) and The Key Project of Science and Technology of Wuhan (No. 201701021010132).


