


Introduction
From superficial observation, the Antarctic littoral environment would appear to be virtually lifeless, with nothing more than small numbers of the relatively mobile limpet Nacella concinna being apparent (e.g. Zacher et al. Reference Zacher, Wulff, Molis, Hanelt and Wiencke2007). There is no visible zonation, one of the most obvious and defining features of rocky shores globally. The barren appearance of Antarctic and many sub-Antarctic shores is heavily influenced by the effects of ice scouring (Pugh & Davenport Reference Pugh and Davenport1997, Barnes Reference Barnes1999), which removes nearly all macroflora and -fauna from the surface of the intertidal zone. However, the physical characteristics of the intertidal environment at sites around Adelaide Island (and elsewhere in Antarctica) may permit the existence of cryptic communities, which whilst being both spatially and temporally patchy, are richer and more diverse than previously anticipated (Waller et al. Reference Waller, Barnes and Convey2006a). Zonation is not obvious in the Antarctic intertidal, despite the intertidal zone globally being a three dimensional environment with taxa colonizing upper and lower surfaces of rocks along a surface gradient extending between high water spring level and low water spring level. Whilst the concept zonation is not applicable to the Antarctic surface intertidal zone, previous studies have reported a range of taxa surviving in the protected lower layers of the cobble matrix (Waller 2006a, 2006b).
Habitat structure and complexity have been proposed as important factors in structuring many biological communities, with more complex habitats providing refuges from physical extremes and predation (Menge et al. Reference Menge, Lubchenco, Ashkenas and Ramsey1986, Raffaelli & Hawkins Reference Raffaelli and Hawkins1996). Although there are many studies of community structure on cool temperate (e.g. Rios & Mutschke Reference Rios and Mutschke1999, Barnes & Lehane Reference Barnes and Lehane2001, Kuklinski et al. Reference Kuklinski, Barnes and Taylor2006) and sub-Antarctic boulder shores (Pugh & Davenport Reference Pugh and Davenport1997), to date there have been no studies of possible zonation and community structure through a vertical section of an intertidal cobble matrix.
This study considers the influence of depth within the cobble matrix on the diversity, abundance and distribution of taxa present within a low shore Antarctic intertidal zone. The hypothesis being examined is that diversity, species-richness and abundance of taxa will increase with depth within the matrix.
Materials and methods
Sample sites and protocol
Samples were collected from Lagoon Island, close to Rothera Research Station, Adelaide Island, west Antarctic Peninsula (Fig. 1) over two consecutive days in early January 2005, approximately one hour either side of spring tide low water (c. +0.44 m above chart datum). The site was characterized by compacted cobble pavements (size 64–256 mm, Wentworth scale), with virtually no sediment within the matrix. Three haphazardly placed 0.25 m2 quadrats 300–500 m apart were excavated to a level where water was encountered (deemed as being equivalent to the immediate sublittoral). Bedrock was not encountered in any of the replicates. Rocks were considered to be within the quadrat if over 50% of their volume was encompassed. The rocks were collected, upper surface marked, and then bagged and labelled by depth and replicate. Depth classes were defined as layer 1: 0–0.10 m, layer 2: 0.11–0.25 m, layer 3: 0.26–0.35 m and layer 4: 0.36–0.45 m (the maximum depth attained before water was encountered). On occasions rocks were encountered that encompassed more than one depth class. In these circumstances the depth of the upper, mid-point and under-surface of the rock were recorded. The rocks were then returned to the laboratory where tube-dwelling polychaetes (excluding spirorbids and serpulids) and samples of hydroids and sponges were removed and preserved. The rocks were then dried, allocated a unique reference number and the encrusting taxa present identified to lowest taxonomic level possible, in most cases to species. A similar process was applied to mobile taxa, which were collected in plastic pots filled with seawater, labelled according to the depth and surface on which they were found, and then returned to the laboratory where they were identified and counted. For highly abundant, mobile species (e.g. Tigriopus angulatus) an estimate of the percentage collected was made in situ.

Fig. 1 a. Location of Rothera research station on Adelaide Island, and b. location of Lagoon Island relative to Rothera research station.
Analyses of collected rocks
Ten random 2.5 cm2 areas on each surface of all rocks were analysed for abundance of species present within the selected area. The surface area of each rock was estimated using a non-elastic mesh of 1 cm2 grid size following Barnes et al. (Reference Barnes, Rothery and Clarke1996). All encrusting fauna were counted on each rock and the abundance of each taxon calculated by using the relative proportions estimated from the grid subsamples. These values were then standardized to 1 m2. Sizes of 50 randomly selected cheilostome bryozoan colonies from both upper and lower surfaces of cobbles in each layer were measured to an accuracy of 0.1 mm using digital callipers.
Data analysis
The data were pooled by layer and surface and fourth root transformed to downweigh the effects of very abundant taxa. Indices of species-richness, abundance, diversity (Shannon H’(log2)) and evenness (Pielou J’) were calculated using the DIVERSE routine within the PRIMER ecological software package (Primer-e Ltd, Plymouth, UK). Data were transferred to the Minitab statistical software package, checked for normality and homoscedacity and transformed where necessary (fourth root transformations were applied to abundance and cheilostome bryozoan colony size data to stabilize variance). These data were then subjected to General Linear Model (GLM) ANOVA with depth class and surface (top or bottom) as fixed factors. Where differences were found, post hoc Tukey pair-wise comparisons were made to identify the surface and layers contributing to the difference.
The SIMPER routine within the PRIMER package was applied to Bray Curtis similarity matrices of square root transformed data of species distribution within the intertidal zone in order to ascertain whether there were significant differences between assemblage composition between rock surfaces and layers.
Results
A wide range of both encrusting and mobile taxa was found to be present in the intertidal zone at the study sites selected. In the current study a total of 40 species, representing 22 orders and nine phyla, were identified within the cobble matrix that formed the substratum (Table I). The species accumulation curve approached an asymptote (Fig. 2), indicating that, despite the relatively small sampling area, the sampling protocol used was appropriate to provide a representative description of the taxa present in the intertidal zone at this site. Overall the intertidal community comprised 57.5% vagile and 42.5% sessile taxa, however, the proportions of each varied significantly with layer (depth) and rock surface (Table II) (ANOVA F3,1 = 13.21, P < 0.001). The dominant (i.e. the most frequently occurring and numerically most abundant) groups were all encrusting (cheilostome bryozoans, hydroids and spirorbid polychaetes), but mobile taxa, whilst numerically less abundant, were more speciose with totals of 17 encrusting and 23 vagile species found. Upper surfaces were dominated by spirorbid polychaetes and the cheilostome bryozoan Celleporella antarctica. Lower surface communities were more diverse, with a greater number of species contributing to the within-surface similarity. Analysis by trophic groups revealed that both upper and lower surface communities were predominantly composed of suspension feeders.
Table I Presence/absence of taxa found on each layer and surface of the rock matrix. Number represents rock layer, u = upper surface, l = lower surface of rock. + denotes taxa present.


Fig. 2 Taxon accumulation curve by layer and surface (black triangles show bootstrapped data).
Table II Summary of significant results obtained from a posteriori Tukey pair-wise comparisons of means, after application of General Linear Model (GLM) ANOVA on abundance, richness, evenness and diversity data. Significance of result is denoted as *P < 0.05, **P < 0.01 ***P < 0.001.

Univariate measures of community structure with depth and surface
Abundance
At the study site there was a significant difference in overall faunal abundance between both layers and cobble surfaces within layers (ANOVA F3,1 = 8.04, and F3,1 = 25.29, P < 0.001 in both cases). Upper surfaces had significantly lower abundances than lower surfaces of rocks (Tukey T = -5.029, P < 0.001). There was also a significant difference between layers. Layer 1 had significantly lower faunal abundance than all other layers. Mean faunal abundance on the upper surface of the top layer of the matrix was 97 individuals m-2 (range 15–212), an order of magnitude lower than the mean of 2400 individuals m-2 on the lower surface of the bottom layer of rocks (Fig. 3a). The cheilostome bryozoan Celleporella antarctica and spirorbid polychaetes accounted for an average of 90% of the animals present on upper surfaces of rocks.

Fig. 3 a. Mean faunal abundance (± s.e.) found on upper (○) and lower (●) surfaces of rocks found at increasing depth through the intertidal cobble matrix. b. Mean species-richness (± s.e.) on upper (○) and lower (●) surfaces of rocks in the intertidal zone. c. Mean diversity (± s.e.) found on upper (○) and lower (●) surfaces of rocks in the intertidal zone. d. Mean evenness (± s.e.) found on upper (○) and lower (●) surfaces of rocks in the intertidal zone.
Richness
Overall there were significant differences in species-richness with both surface and layer (ANOVA F3,1 = 5.60, P < 0.001). However, post hoc Tukey comparisons again revealed that this was due to the difference between the upper surface of the top layer of rocks (i.e. the visible intertidal environment) and all other points (Table II). The mean richness of the outer (exposed surface of layer 1) surface of the intertidal at these Lagoon Island sites was only 4.3 species (Fig. 3b) compared with lower layers, which had a mean across the layers of 14.5 species. The maximum richness (a mean of 16 species) was found on the upper surface of layer 3.
Diversity and evenness
Shannon (H’) diversity differed significantly between both surfaces and layers (ANOVA F3,1 = 5.70 and 39.01, P < 0.001 in both cases) and ranged from 0.84 on the outer face of the upper layer of the intertidal to 2.18 on the lower surface of the bottom layer of rocks (Fig. 3c). Post hoc Tukey pair-wise comparisons revealed that the differences were predominantly caused by the low diversity of taxa found on upper and lower surfaces of the initial layer of rocks (Table II). Lower surfaces had significantly higher diversity than upper with the exception of the initial layer of the matrix (Tukey T = -6.246, P < 0.001). Evenness was not as variable as diversity at the study sites. The main difference in evenness was between surfaces, with lower values obtained on upper surfaces (Fig. 3d).
Size of residents: cheilostome bryozoan colonies as an example
Cheilostome bryozoan colonies were significantly larger on lower surfaces, with the exception of the uppermost layer of rocks. Mean size ranged from c. 2 mm on the exposed upper surface of the intertidal zone to c. 6.4 mm at the bottom of the matrix (Fig. 4). The maximum colony size recorded was 28.5 mm and was found on the lower surface of layer 4. The maximum size colony found on upper surfaces was a colony of 14.0 mm diameter on the second layer of the matrix.

Fig. 4 Mean cheilostome bryozoan colony size in mm (± s.e.) found on upper (○) and lower (•) surfaces of rocks in the intertidal zone.
Variability of community structure with depth and rock surface
Community composition varied with layer and surface through the intertidal matrix, with much greater variability in assemblage structure present in comparisons between the upper surface communities of different layers. The top layer community was significantly different from those of all other layers (Table II). Communities on lower surfaces were similar, both within and between layers, and showed a distinct gradient of similarity with depth. Visualization of underlying trends using non-metric multidimensional scaling (nMDS) ordination showed that the upper surface communities were more variable than those on lower surfaces (Fig. 5), with average similarities of around 50% for upper surfaces of all layers except layer 4 (68%) and around 68% for lower surfaces. The dissimilarity between layers was due to a wider range of taxa with no clear patterns emerging. The dissimilarities between surfaces were predominantly due to several cheilostome bryozoans and Spirorbidae.
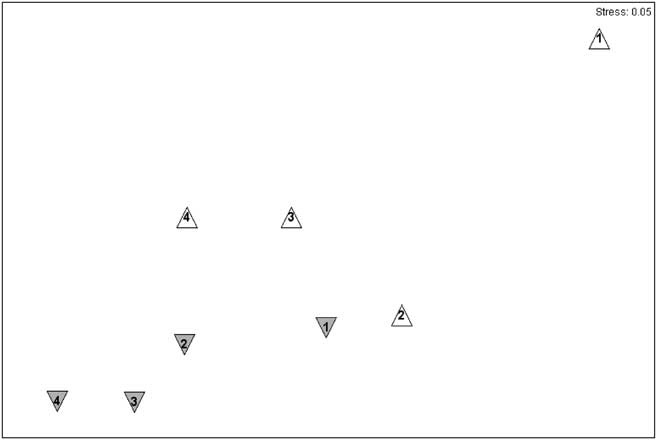
Fig. 5 Non-metric multidimensional scaling (nMDS) showing similarities between layers and surfaces. The symbols are lower surfaces (grey downward triangles), upper surfaces (white upright triangles), layers are indicated by numbers 1–4, 1 being the top layer and 4 being the lowest layer.
Discussion
The concept of a three dimensional environment and attenuated distribution of taxa is an accepted phenomenon within the study of soft sedimentary habitats (Raffaelli & Hawkins Reference Raffaelli and Hawkins1996). Typically, this is associated with meio- and macro-organisms living within the surface few centimetres of sands and muds. In principle, many organisms may live in the spaces made available amongst substrata of much larger grain sizes, such as the boulders of the study environment examined here. Studies of temperate rocky shores have compared variability in various metrics of their communities (e.g. diversity, richness, abundance, biomass) with habitat characteristics, including heterogeneity at differing scales (see Benedetti-Cecchi & Cinelli Reference Benedetti-Cecchi and Cinelli1997, Kuklinski et al. Reference Kuklinski, Barnes and Taylor2006), degree of exposure (McQuaid & Branch Reference McQuaid and Branch1985, Bustamante & Branch Reference Bustamante and Branch1996) and position along intertidal gradients (Benedetti-Cecchi et al. Reference Benedetti-Cecchi, Maggi, Bertocci, Vaselli, Micheli, Osio and Cinelli2003, Davidson et al. Reference Davidson, Crook and Barnes2004), but these studies generally have not considered depth within the matrix per se. Temperate rocky shores vary dramatically when compared with southern polar littoral environments, as only the most exposed temperate localities have few obvious signs of macrobiota. In contrast, Antarctic intertidal zones superficially appear to support little more than small populations of mobile species such as the limpet N. concinna (Zacher et al. Reference Zacher, Wulff, Molis, Hanelt and Wiencke2007). Colonization of the intertidal zone at localities around the current study area can be both temporally and spatially patchy (Barnes & Brockington Reference Barnes and Brockington2003, Waller et al. Reference Waller, Barnes and Convey2006a). Such patchiness, the relatively limited number of previous studies (a total of 16 studies south of the Antarctic Circumpolar Current, the majority of which report on specific groups of taxa) and the fact that some previous sampling protocols at the current study site only collected the outer layer of rocks (D.K.A. Barnes, personal communication, 2007), go some way to explaining why so few macrobiota have previously been found.
The physical appearance of much of the intertidal at this site and others around Adelaide Island is also notable. In addition to large areas of bare bedrock and unconsolidated boulder-fields on bedrock, the effect of persistent summer ice scour and winter encasement in ice has resulted in many places in a characteristic “pavement” effect. This comprises a flat densely packed mosaic of ice-smoothed boulders and cobbles. Such morphological characteristics are common throughout the Maritime Antarctic and sub-Antarctic islands as well as at sites along the Antarctic Peninsula (Hansom Reference Hansom1983, C. Waller personal observation). These structures are highly resistant to wave and ice disturbance and may offer a stable and protected environment for community development within the protected matrix. Radiocarbon dating of such pavements in both the South Shetland Islands and South Georgia suggests that it may take up to 300 years for the pavements to form. Pavements in South Georgia are well developed on glacial till dated at over 9000 years whereas they stop abruptly at the limit of similar till dated at 200 years (Hansom Reference Hansom1983). These pavements could therefore be highly stable over thousands of years, supporting the proposition that populations of subtidal taxa with sufficiently wide physiological tolerances are able to colonize these protected habitats on a permanent basis. Previous studies at sites on Adelaide Island showed at least 17 macrofaunal species to be present in the intertidal boulder matrix in winter and live four year old bryozoan colonies have been found to be present (Waller et al. Reference Waller, Barnes and Convey2006a, Reference Waller, Worland, Convey and Barnes2006b). It would seem that in contrast with the long held view that few macro-organisms would survive winter in this environment, intertidal communities are persistent over annual cycles.
The most obvious differences in all diversity metrics (except species-richness) were found between the surfaces of boulders in each depth layer examined. Lower surfaces of all boulder layers had significantly higher values than upper surfaces (the exception being the lower surface of layer 1 and upper of layer 2). Although there appear to be no directly comparable Antarctic intertidal studies available in the literature, the findings of the current study are similar to those of Barnes et al. (Reference Barnes, Rothery and Clarke1996) who reported that c. 80% of the (fauna and) bryozoans present on rocks at Signy Island were found on the under-surfaces (although that study only sampled the surface layer of rocks). The highest abundances and greatest diversity of fauna were found on the lower surface of the lowest layer of rocks. Intuitively this seems reasonable as this environment will be exposed to air for the shortest duration, is protected from ice scouring and is closest to the sublittoral communities which may provide a larval recruitment pool. However, as well as evidence suggested by the age/size of fauna present, it is also plausible that the intertidal community may be self-sustaining and not reliant on external recruitment from lower tidal levels, as reproduction, predation, commensalism and both intra- and inter-specific competition were observed at all sites. That such processes occur provides evidence that the Antarctic intertidal, in contrast to a current paradigm, can support a true community. If so, it may be argued that this hitherto largely ignored Antarctic habitat is less inhospitable than has previously been thought, as it is protected from the worst of ice scouring and UV irradiation, which has been shown to damage intertidal macro-algal assemblages present on exposed substrata at a similar site (Zacher et al. Reference Zacher, Wulff, Molis, Hanelt and Wiencke2007).
The Antarctic Peninsula is experiencing one of the fastest rates of climate change anywhere on Earth (Vaughan et al. Reference Vaughan, Marshall, Connolley, Parkinson, Mulvaney, Hodgson, King, Pudsey and Turner2003), and new areas of ice-free coast are becoming available for colonization so it is possible that these communities have developed in response to a new habitat becoming available. Shallow-water Antarctic marine species are generally thought to be stenothermal and adapted to survive in a narrow and stable temperature band of c. -1.8 to +1.8°C (Clarke et al. Reference Clarke, Holmes and White1988, Portner et al. Reference Portner, Berdal, Blust, Brix, Colosimo, De Wachter, Giuliani, Johansen, Fischer, Knust, Lannig, Naevdal, Nedenes, Nyhammer, Sartoris, Serendero, Sirabella, Thorkildsen and Zakhartsev2001, Peck Reference Peck2002). This contrasts with environmental conditions in the intertidal zone, where temperatures are highly variable with summer maxima of c. 15°C and winter minima of -15°C. Seventeen species have been shown to be able to permanently survive under these conditions (Waller et al. Reference Waller, Barnes and Convey2006a, Reference Waller, Worland, Convey and Barnes2006b), with a further 23 being present in summer seasons. This suggests that some marine taxa have the physiological range to adapt to changing conditions and that current warming is not necessarily a death sentence for all marine communities.
Acknowledgements
This research was funded from British Antarctic Survey Polar Science for Planet Earth core funds. I thank the marine team at Rothera Research Station, P. Convey, S. Hull and two anonymous reviewers for constructive comments on earlier versions of the manuscript and James Procter for technical advice.


