


Pest damage may cause up to 90% losses of cereal stocks after 5 months of storage (Nukenine et al., Reference Nukenine, Monglo, Awasom, Tchuenguem and Ngassoum2002). The use of chemical insecticides is often effective, but these are harmful to human beings, and they generate major problems in terms of environmental pollution (Yarou et al., Reference Yarou, Silvie, Komlan, Mensah, Alabi, Verheggen and Francis2017). It is therefore necessary to find alternatives if we are to achieve sustainable development. Aromatic plants such as Lippia multiflora are used in popular conservation strategies to reduce post-harvest losses (Boulogne et al., Reference Boulogne, Petit, Ozier-Lafontaine, Desfontaines and Loranger-Merciris2012). The essential oil (EO) of this plant has the biological properties of antimicrobial activity (Pélissier et al., Reference Pélissier, Marion, Casadebaig, Milhau, Kone and Loukou1994; Bassolé et al., Reference Bassolé, Lamien-Meda, Bayala, Tirogo, Franz and Novak2010), insecticidal activity (Tia et al., Reference Tia, Lozano, Menut, Lozano, Martin, Niamké and Adima2013), antifungal activity (Baba Moussa et al., Reference Baba Moussa, Koumaglo, Ayedoun, Akpagana, Moudachirou and Bouchet1997) and has pediculocidal and scabicidal properties (Oladimeji et al., Reference Oladimeji, Orafidiya, Ogunniyi and Adewunmi2000). The chemical composition of the L. multiflora EO has been studied extensively. The main components include thymol, p-cymene, thymyl acetate, citral, geranial, geraniol, neral, nerol, limonene, carvacrol and γ-terpinene (Juliani et al., Reference Juliani, Simon, Quansah, Asare, Akromah and Acquaye2008; Bassolé et al., Reference Bassolé, Lamien-Meda, Bayala, Tirogo, Franz and Novak2010; Soro et al., Reference Soro, Grosmaire, Ocho-Anin Atchibri, Munier, Menut and Pelissier2015). The active components of the EO are not persistent over time due to their high volatility (Nguemtchouin et al., Reference Nguemtchouin, Ngassoum, Ngamo, Gaudu and Cretin2010). To improve the durability of the EOs, a formulation using porous materials as solid supports should be developed. Materials suitable for this formulation are clays that are currently used in medicine, cosmetic powders and other insecticides (Zsirka et al., Reference Zsirka, Horváth, Makó, Kurdi and Kristóf2015). Previous studies have shown that clay minerals are efficient adsorbents for various EOs, such as Ocimum basilicum L., Ocimum gratissimum L. (Keita et al., Reference Keita, Vincent, Schmit, Arnason and Bélanger2001), Xylopia aethiopica and O. gratissimum (Goletti, Reference Goletti2012; Noudem et al., Reference Noudem, Mbouga, Kaptso, Khalfaoui and Noumi2017), or oregano oil, thyme oil and basil oil (Giannakas et al., Reference Giannakas, Tsagkalias, Achilias and Ladavos2017). Nevertheless, there is a lack of affinity between clays, which are inorganic mineral compounds, and EOs, which are organic compounds. To overcome this difficulty, the clay surfaces can be modified using alkylammonium surfactants that render them organophilic (Nguemtchouin et al., Reference Nguemtchouin, Ngassoum, Chalier, Kamga, Ngamo and Cretin2013, Reference Nguemtchouin, Ngassoum, Kamga, Deabate, Lagerge and Gastaldi2015).
Various methods for loading EOs onto raw or modified clays have been proposed. In the most widely used batch method, the EO is dissolved in an organic solvent such as acetone (Nguemtchouin et al., Reference Nguemtchouin, Ngassoum, Ngamo, Mapongmetsem, Sieliechi and Malaisse2009, Reference Nguemtchouin, Ngassoum, Ngamo, Gaudu and Cretin2010, Reference Nguemtchouin, Ngassoum, Chalier, Kamga, Ngamo and Cretin2013), hexane (Nguemtchouin et al., Reference Nguemtchouin, Ngassoum, Kamga, Deabate, Lagerge and Gastaldi2015) or heptane (Kinninmonth et al., Reference Kinninmonth, Liauw, Verran, Taylor, Edwards-Jones, Shaw and Webb2013) before mixing it with clay. The possible residues of these solvents in the final products would be a disadvantage of using such modified clays in the food-packaging industry (Giannakas et al., Reference Giannakas, Tsagkalias, Achilias and Ladavos2017). Recently, Giannakas et al. (Reference Giannakas, Tsagkalias, Achilias and Ladavos2017) developed an ‘adsorption/evaporation’ method that does not use toxic solvents. Direct mixing of EOs with clays was not employed. A smaller quartz beaker was placed within an aluminium beaker containing the clay and filled with an appropriate amount of EO. Then, the aluminium beaker was sealed and placed in an oven at 120°C for 24 h, leading to clay/EO hybrids in powder form. These hybrids have greater application potential. However, only the volatile compounds of EOs were adsorbed, thus omitting possible non-volatile active constituents.
In the present study, kaolinite-rich and smectite-rich Ivorian clays were modified using the surfactant trioctyl methylammonium (TOMA) and then reacted with the L. multiflora EO. The adsorption of the EO on the clays was achieved without using organic solvents. Moreover, the applied loading method did not produce clay/EO sludge, as has been reported in other studies, and it also avoided elevated temperature, which would modify the properties of the EO. The main objective of this research was to adsorb the EO compounds of L. multiflora on the two Ivorian clays.
Materials and methods
Essential oil distillation
Lippia multiflora is a plant belonging to the Verbenaceae family and is native to Central and West Africa (Jim et al., Reference Jim, Wudeneh, Mariana and Dan2001). This wild plant is harvested and used by local populations according to their nutritional and therapeutic needs. The L. multiflora plants used as a source of EO came from the Korhogo area in the north of Ivory Coast. Fresh leaves of the plant were harvested in bags and transported to the laboratory, where they were air dried at 28 ± 2°C. Portions of the dried plant material (500 g) were submitted to steam distillation using a Clevenger-type apparatus for 3 h. Anhydrous magnesium sulfate was used to remove residual water (floral water) after decantation. The EOs were stored in a tightly closed dark vial at 4°C for further analyses and tests. The yields were calculated according to the weight of the plant material before distillation (w/w of the dry vegetable material, expressed in percentages).
Raw clays
The first clay is a whitish kaolinite-rich clay referred to here as Y. The second clay, referred to here as K, is a grey smectite-rich clay. These designations (Y and K) correspond to the first letters of the names of the Ivory Coast cities (Yamoussoukro and Katiola) from where these clays originate. The two clays were dispersed under stirring in distilled water, then poured through a 50 μm sieve and dried at 105°C. The <50 μm fractions obtained were indexed Y0 and K0. Y0 and K0 were characterized mineralogically by Gueu et al. (Reference Gueu, Finqueneisel, Zimny, Bartier and Yao2019). Y0 is composed of 68% kaolinite, 16% quartz, 8% illite and 8% feldspar. K0 is composed of 63% smectite, 12% kaolinite, 12% interstratified illite-smectite, 8% quartz, 3% illite and 2% goethite. The cation-exchange capacities (CECs) of the Y0 and K0 clays are 3.41 and 37.55 cmol kg–1, respectively. The chemical composition was 48.90% SiO2, 34.90% Al2O3, 1.93% Fe2O3, 0.70% K2O, 0.91% TiO2 and 0.15% MgO for Y0 and 45% SiO2, 22.50% Al2O3, 13.90% Fe2O3, 0.62% K2O, 0.98%TiO2 and 1.44% MgO for K0.
Clay modification with the TOMA surfactant
The surfactant used was analytical-grade TOMA from Sigma-Aldrich. The clay modification was carried out in batch mode. The surfactant was prepared with floral water obtained during the preparation of the EO. Two concentrations of surfactant were prepared for the two types of clay. In each case, the amount of TOMA in the solution was equivalent to 1.0 or 2.5 times the CEC of the clay. A total of 10 g of clay was added to 100 mL of floral water in the batch reactor and shaken for 1 h to obtain a homogeneous clay dispersion. The surfactant was then added slowly into the clay dispersion. The mixture (clay dispersion + surfactant) was then agitated for 24 h at room temperature, centrifuged at 6000 rpm for 30 min to separate the clay from the supernatant and washed repeatedly with distilled water. The washing and centrifugation steps were repeated until complete removal of the foam formed due to the surfactant. The washing step is essential during preparation, as it removes the excess surfactant and reduces the risk of salting out. The AgNO3 test was used to detect any residual ammonium salts.
The resulting products were dried at 40°C for 24 h and ground in an agate mortar. Four samples of modified clays were thus obtained, and these were named Y1 and Y2.5 for the Yamoussoukro clay and K1 and K2.5 for the Katiola clay.
Preparation of the clay–L. multiflora EO formulation
The formulation was conducted using Equation 1:
 $$\displaystyle{{m_{{\rm EO}}} \over {m_{{\rm clay}}}} = 0.1$$
where m EO = the mass of the EO and m clay = the mass of the clay.
A total of 3 g of the modified clays was placed in a beaker and 0.3 g of EO (equivalent to 2.8 mL of EO) was added dropwise at room temperature. After each drop was added, the clay was stirred manually. The above ratio and this method of preparation were chosen with the aim of producing clay–EO hybrids in powder form to facilitate their use in, for example, seed protection. Preliminary tests showed that greater EO/clay ratios (0.2, 0.3, 0.4) induce a suspension of clay or mud rather than a powder. By contrast, when the quantity of EO added is not sufficient, the formulation obtained lacks the scent of the EO. Based on these tests and the data published by Nguemtchouin et al. (Reference Nguemtchouin, Ngassoum, Ngamo, Mapongmetsem, Sieliechi and Malaisse2009, Reference Nguemtchouin, Ngassoum, Chalier, Kamga, Ngamo and Cretin2013), the chosen ratio of 0.1 is a good compromise for obtaining a scented and powdered final product. The four resultant hybrid samples were named Y1+EO, Y2.5+EO, K1+EO and K2.5+EO. In order to assess the impact of the surfactant on the fixation of EO, Y0 and K0 clays were also used, and these were indexed as Y0+EO and K0+EO.
X-ray diffraction
X-ray diffraction (XRD) traces of all samples were recorded at UMR 7359 GeoRessources (Vandœuvre-lès-Nancy, France) with a D2 Phaser Bruker diffractometer equipped with a LYNXEYE detector, using Cu-Kα radiation, at 30 kV and 10 mA. The XRD analysis of the clays was carried out on oriented clay aggregates collected on glass slides following three preparation processes: (1) air-dried; (2) ethylene glycol-solvated for 12 h; and (3) heated (490°C for 2 h). The XRD traces were obtained over the 2.5–30°2θ range using a scan step of 0.01°2θ with a scanning time per step of 0.6 s. The identification of clay minerals was made according to the position of the (001) series of basal reflections on the XRD traces (Brindley & Brown, Reference Brindley and Brown1980).
Infrared spectroscopy
The samples were analysed using Fourier-transform infrared (FTIR) spectroscopy with the diffuse reflectance (DRIFT) technique. The DRIFT spectra were recorded at UMR 7359 GeoRessources with a 2 cm–1 spectral resolution using a Bruker FTIR spectrometer (EQUINOX IFS 55 instrument) equipped with a large-band mercury cadmium telluride detector cooled at 77 K. The DRIFT spectra were collected using a Praying Mantis™ (Harrick Scientific Products) diffuse reflection accessory. Sample preparation involved the mixing of 50 mg of sample with 280 mg of potassium bromide (KBr; 15 wt.%). Each spectrum represented the average of 200 scans (90 s) after subtraction of the influences of atmospheric water and carbon dioxide. The precise positions of the bands were determined by deconvolution of the infrared spectra using OriginPro 2019b software.
Results and discussion
Raw clay modification with surfactant
XRD analysis. The XRD trace of Y0 (Fig. 1a,b) indicates the presence mainly of kaolinite (7.18 Å) and minor illite (10.01 Å). The disappearance of the kaolinite (001) reflection after heating (Fig. 1c) is due to dehydroxylation (Holtzapffel, Reference Holtzapffel1985). The XRD traces of Y1 and Y2.5 (Fig. 1d–i) are similar to that of Y0. These unaffected basal reflections suggest that the treatments carried out with the TOMA surfactant did not affect the interlayer space of kaolinite, irrespective of its concentration, which is in agreement with previous studies (Goletti, Reference Goletti2012).

Fig. 1. XRD traces of (a–c) unmodified kaolinite-rich clay Y0 and samples modified by surfactant of (d–f) Y1 and (g–i) Y2.5.
The raw clay K0 (Fig. 2a) consists of smectite and kaolinite with minor illite and mixed-layer illite-smectite, as observed previously by Gueu et al. (Reference Gueu, Finqueneisel, Zimny, Bartier and Yao2019). The treatment with TOMA surfactant induces drastic changes in the positions of the basal reflections for the two concentrations. For K1, the XRD trace (Fig. 2d) displays a reflection at 22.28 Å in the air-dried state, which shifts to 26.24 Å after solvation with ethylene glycol (Fig. 2e). For K2.5, the XRD trace (Fig. 2g) shows a reflection at 27.18 Å in the air-dried state, which shifts slightly to 27.97 Å after ethylene glycol solvation (Fig. 2h). After heating, no real difference is observed for K1 and K2.5 compared to natural K0; both exhibited a collapse of the (001) maximum near 9.6–9.7 Å (Fig. 2f,i). The XRD traces of the modified smectite-rich sample display considerable changes compared to the original sample. With TOMA, the (001) basal reflection of smectite at 15.19 Å (Fig. 2a) shifts to 22.28 Å for K1 (Fig. 2d) and to 27.18 Å for K2.5 (Fig. 2g). Moreover, after ethylene glycol solvation, the swelling capacity remained unchanged for the K2.5 sample (Fig. 2h), in contrast to the K1 sample (Fig. 2e), suggesting that almost the entire smectite interlayer space in sample K2.5 is probably occupied by TOMA. Such insertion of the surfactant into the clay interlayer space has been observed in previous studies, which concluded that the interlayer space depends on the amount of surfactant present (Heinz et al., Reference Heinz, Vaia, Krishnamoorti and Farmer2007; Zhu et al., Reference Zhu, Zhu, Xu and Ruan2007).
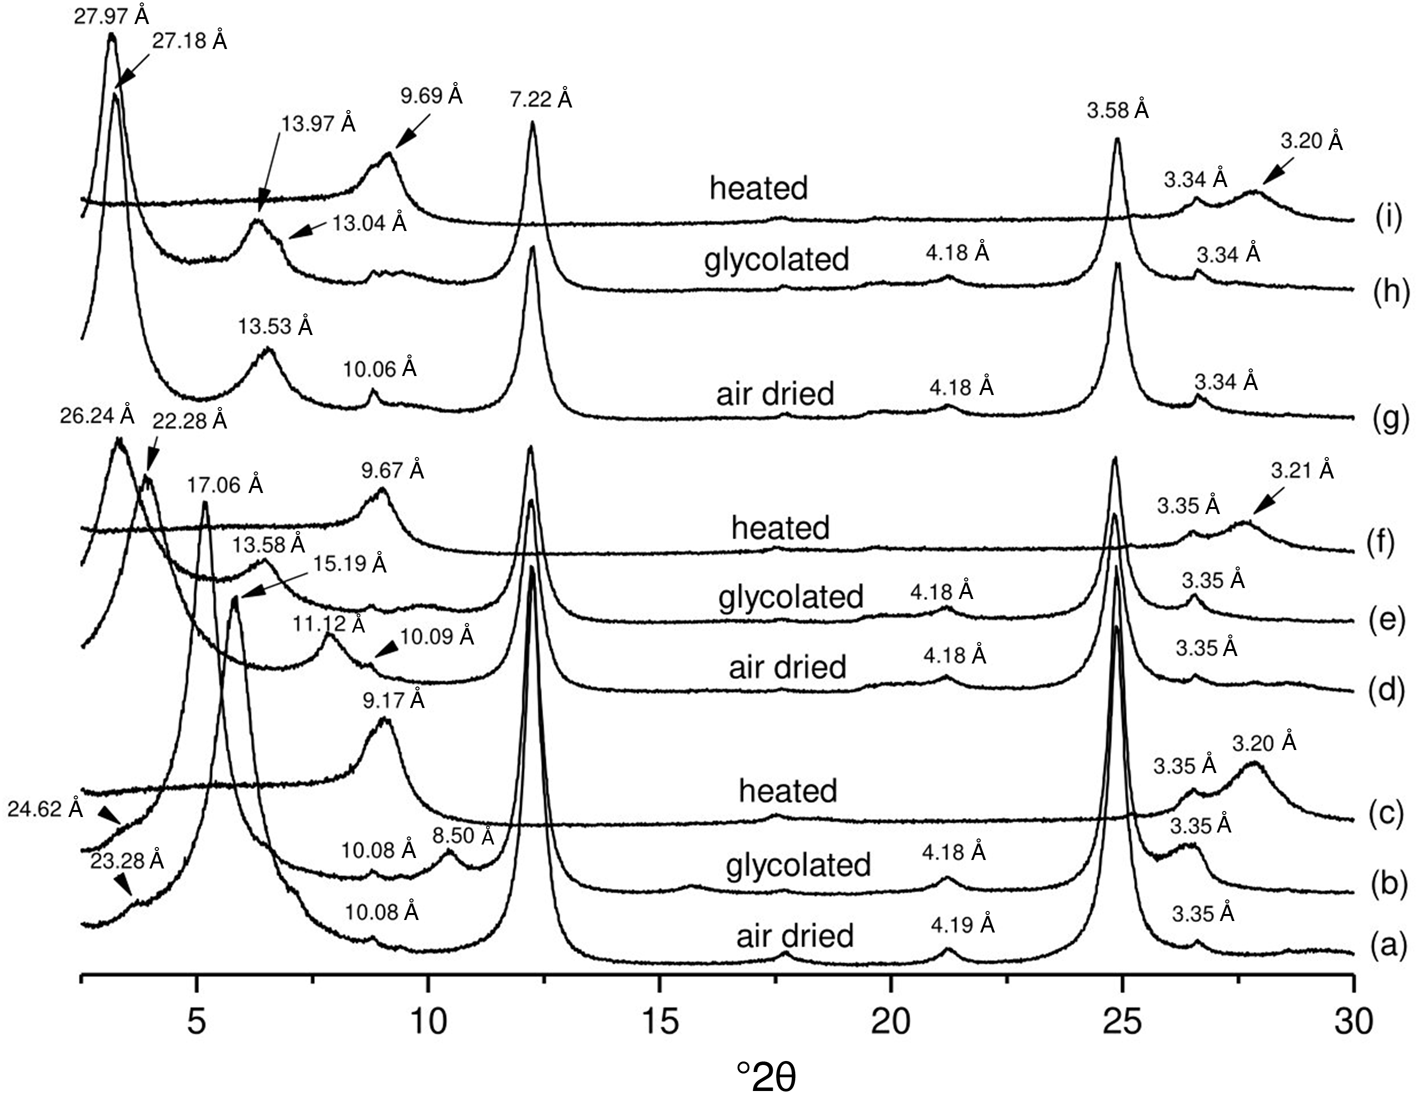
Fig. 2. XRD traces of (a–c) unmodified smectite-rich clay K0 and samples modified by surfactant of (d–f) K1 and (g–i) K2.5.
Infrared analysis. Figure 3 displays the infrared spectra of TOMA, of the raw sample Y0 and of the modified samples Y1 and Y2.5. The spectrum of Y0 (Fig. 3b) shows the predominance of kaolinite, which is in agreement with the XRD data. The spectra of the modified clays (Fig. 4c,d) show the appearance of new bands (2958, 2930, 2925, 2856, 1482, 1467, 1457, 1431 and 1376 cm–1) initially present on the TOMA surfactant (Fig. 4a). The bands at 2958 and 2856 cm–1 are attributed to the asymmetric stretching vibration of CH3 and the symmetric stretching vibration of CH2, respectively. The bands at 2930, 2925 and 2924 cm–1 are assigned to the asymmetric stretching vibration of CH2. The band at 1457 cm−1 is assigned to the quaternary ammonium group due to (CH3)N+ (Mishra et al., Reference Mishra, Rout, Sarangi and Nathsarma2011; Cui et al., Reference Cui, Chen, Yang, Wang, Liu and Zou2013). The bands at 1482, 1467, 1434 and 1431 cm–1 are attributed to both the CH2 and CH3 bending vibrations and the band at 1376 cm–1 is assigned to the CH3 bending vibration of TOMA. The intensities of the bands between 3000 and 2800 cm–1 and between 1500 and 1300 cm–1, characteristic of the surfactant, increase with the concentration of TOMA (Fig. 3). The appearance of new bands on the Y1 and Y2.5 spectra indicates the modification of these samples, which is in accordance with previous studies (Zhu et al., Reference Zhu, Zhu, Xu and Ruan2007).

Fig. 3. Infrared spectra of (a) TOMA surfactant, (b) kaolinite-rich raw sample Y0 and samples modified by surfactant of (c) Y1 and (d) Y2.5.

Fig. 4. Enlarged infrared spectra of (a) TOMA surfactant, (b) kaolinite-rich raw sample Y0 and samples modified by surfactant of (c) Y1 (c) and (d) Y2.5 in the ranges 3000–2750 cm–1 and 1500–1350 cm–1.
Figure 5 compares the spectra of the raw sample K0 with those of the modified samples K1 and K2.5 and shows the TOMA spectrum. The bands at ~3415 cm–1 and at 1634 cm–1 in the K0 spectrum (Fig. 5b) are attributed to the water adsorbed on the surface (Nakhli et al., Reference Nakhli, Mbouga, Bergaoui, Khalfaoui, Cretin and Huguet2018). These two bands are more intense on the spectrum of K0 than on that of Y0, which is in agreement with the fact that K0 contains more smectite than Y0. The two bands clearly decrease on the spectra of the modified clays K1 and K2.5 due to the replacement of water by the TOMA surfactant (Fig. 5c,d). This indicates a new hydrophobic character of the modified clays, which should increase the adsorption capacity of the clays towards hydrophobic terpenic compounds (Nguemtchouin et al., Reference Nguemtchouin, Ngassoum, Kamga, Deabate, Lagerge and Gastaldi2015; Nakhli et al., Reference Nakhli, Mbouga, Bergaoui, Khalfaoui, Cretin and Huguet2018). The appearance of new bands (2955, 2927, 2925, 2856, 2854, 1483, 1465, 1457, 1430 and 1376 cm–1) on the spectra of the modified samples indicates the adsorption of the surfactant on these clays (Fig. 6c,d). At the same concentration of TOMA, the intensities of the bands related to the organic molecular groups (between 3000 and 2800 cm–1 and between 1465 and 1376 cm–1) are greater with K1 and K2.5 (Fig. 5c,d) than with Y1 and Y2.5 (Fig. 3c,d). Hence, the smectite-rich clay has a greater adsorption capacity for TOMA than the kaolinite-rich clay.

Fig. 5. Infrared spectra of (a) TOMA surfactant, (b) smectite-rich raw sample K0 and samples modified by surfactant of (c) K1 and (d) K2.5.

Fig. 6. Enlarged infrared spectra of (a) TOMA surfactant, (b) smectite-rich raw sample K0 and samples modified by surfactant of (c) K1 and (d) K2.5 in the ranges 3000–2750 cm–1 and 1500–1350 cm–1.
Infrared spectroscopy has also been used to provide more information on the configurations of the surfactant molecules adsorbed on clay surface or present in the clay interlayer. It is well established that the positions of the CH2 stretching bands of hydrocarbon chains are very sensitive to changes in the configuration of the chains (Xi et al., Reference Xi, Frost and He2007; Daoudi et al., Reference Daoudi, Boughaleb, El Gaini, Meghea and Bakasse2013). It is only when the chains are highly ordered (i.e. in pure surfactant) that the asymmetric and symmetric stretching vibrations of CH2 appear at 2924 and 2854 cm–1, respectively (Figs 4a & 6a). If there is conformational disorder in the chains, their CH2 asymmetric stretching position shifts. The bandshift towards higher wavenumbers is characteristic of disordered gauche conformations (Xi et al., Reference Xi, Frost and He2007). The position of the asymmetric stretching vibration of CH2 is shifted to higher wavenumbers, at 2930 and 2925 cm–1 for Y1 and Y2.5, respectively, and at 2927 and 2925 cm–1 for K1 and K2.5, respectively, indicating the introduction of a gauche conformation in the alkyl chain (Figs 4 & 6).
Adsorption of EO on raw and modified clays
Infrared analysis. Raw and modified clays have been used as solid supports for the preparation of clay–EO hybrids. From the infrared spectrum of the crude L. multiflora EO (Figs 7g & 8g), various EO compounds may be identified: thymol at 2924, 2857 and 1376 cm−1 (Rajkumar et al., Reference Rajkumar, Selvaraj, Suganya, Velmurugan, Gunasekaran and Kumaresan2018), limonene at 1644 cm−1 (Schulz et al., Reference Schulz, Schrader, Quilitzsch and Steuer2002) and citral at 1676 and 1376 cm−1 (Argyropoulou et al., Reference Argyropoulou, Daferera, Tarantilis, Fasseas and Polissiou2007). New bands at 2965, 2934 and 2875 cm–1 appear in the Y0+EO and K0+EO spectra (Figs 7b & 8b) compared to those of the raw clays (Y0 and K0). These bands are initially present in the EO spectra at 2966, 2924 and 2880 cm−1 (Figs 9g & 10g) and are assigned to asymmetric and symmetric stretching vibrations of aliphatic CH3 groups due to the alkyl residue of the triglycerides present in large quantities in EOs (Carrión-Prieto et al., Reference Carrión-Prieto, Martín-Ramos, Maria, Hernández-Navarro, Garrido-Laurnaga, Eusébio and Martín-Gil2017). Other new bands at 1718, 1465, 1376 and 1373 cm–1 are observed in the Y0+EO and K0+EO infrared spectra (Figs 9b & 10b), indicating the adsorption of L. multiflora EO on these materials. Indeed, the band at 1724 cm–1 in the L. multiflora EO spectrum shifts to lower wavenumbers after adsorption of EO on clay materials (1718 cm–1). The band at 1676 cm–1 is due to the vibration of the C=O of the aldehyde group in the citral molecule (Argyropoulou et al., Reference Argyropoulou, Daferera, Tarantilis, Fasseas and Polissiou2007). After adsorption, this band shifts to lower wavenumbers at 1673 cm–1 in the Y2.5+EO, K1+EO and K2.5+EO infrared spectra (Figs 9f & 10d,f). This band appears only on modified clays, suggesting that modification of the clay samples should precede adsorption of this EO compound. By contrast, the compound identified by the band at 1724 cm–1 is adsorbed on both the raw and the modified clays. In addition, organic modifications greatly improve the affinity of clay minerals for EOs, as the bands at 1724 and 1676 cm–1 (Figs 7 & 8) are more intense in the samples treated previously with the surfactant (Y1+EO, Y2.5+EO, K1+EO and K2.5+EO).

Fig. 7. Infrared spectra of (a) kaolinite-rich raw sample Y0, (b) hybrid Y0+EO, (c) surfactant-modified Y1, (d) hybrid Y1+EO, (e) surfactant-modified Y2.5, (f) hybrid Y2.5+EO and (g) L. multiflora EO.

Fig. 8. Infrared spectra of (a) smectite-rich raw sample K0, (b) hybrid K0+EO, (c) surfactant-modified K1, (d) hybrid K1+EO, (e) surfactant-modified K2.5, (f) hybrid K2.5+EO and (g) L. multiflora EO.

Fig. 9. Enlarged infrared spectra of (a) kaolinite-rich raw sample Y0, (b) hybrid Y0+EO, (c) surfactant-modified Y1, (d) hybrid Y1+EO, (e) surfactant-modified Y2.5, (f) hybrid Y2.5+EO and (g) L. multiflora EO in the ranges 3000–2750 cm–1 and 1800–1360 cm–1.

Fig. 10. Enlarged infrared spectra of (a) smectite-rich raw sample K0, (b) hybrid K0+EO, (c) surfactant-modified K1, (d) hybrid K1+EO, (e) surfactant-modified K2.5, (f) hybrid K2.5+EO and (g) L. multiflora EO in the ranges 3000–2750 cm–1 and 1800–1360 cm–1.
As expected, organoclays exhibit greater adsorption than unmodified clays. Similar observations have previously been reported for clays modified with surfactants (Nguemtchouin et al., Reference Nguemtchouin, Ngassoum, Kamga, Deabate, Lagerge and Gastaldi2015), and these have been related to the hydrophobic character of the adsorbents. By contrast, Kinninmonth et al. (Reference Kinninmonth, Liauw, Verran, Taylor, Edwards-Jones, Shaw and Webb2013) reported that clay minerals with greater hydrophilicity would make the most suitable adsorbent materials for EOs. In the present study, the bands at 2966, 2924, 2857, 1724, 1676, 1465 and 1376 cm–1 are more intense in the spectra of samples from Katiola, further suggesting that the adsorption of the L. multiflora EO is greater on this type of clay. This may be explained by the fact that the samples from Yamoussoukro contain kaolinite, a non-swelling clay mineral, unlike the samples from Katiola, which contain smectite, a swelling clay mineral. The results of the present study are in accord with those of Goletti (Reference Goletti2012) regarding the formulation of a bioinsecticide.
XRD analysis. The XRD traces of Y0+EO, Y1+EO and Y2.5+EO (not shown) present no changes compared to the initial traces of Y0, Y1 and Y2.5, respectively. As mentioned above, the adsorption of EOs on kaolinite-rich samples is interpreted as a surface phenomenon.
Unlike the kaolinite-rich clay, the adsorption of the L. multiflora EO on the smectite-rich clay causes a modification of its structure. The EO is intercalated into the interlayer space, as is indicated by an increase in their basal reflections (Fig. 11). Indeed, the basal reflection of smectite at 15.19 Å for K0 increases to 22.41 Å for K0+EO, and that at 22.28 Å for K1 increases to 25.06 Å for K1+EO. The interlayer space of K2.5 does not increase after the adsorption of EO. As suggested above, it is possible to confirm that the interlayer space of this sample is completely saturated after being modified by the TOMA surfactant. Thus, the adsorption of EO on K2.5+EO occurs on the surface.
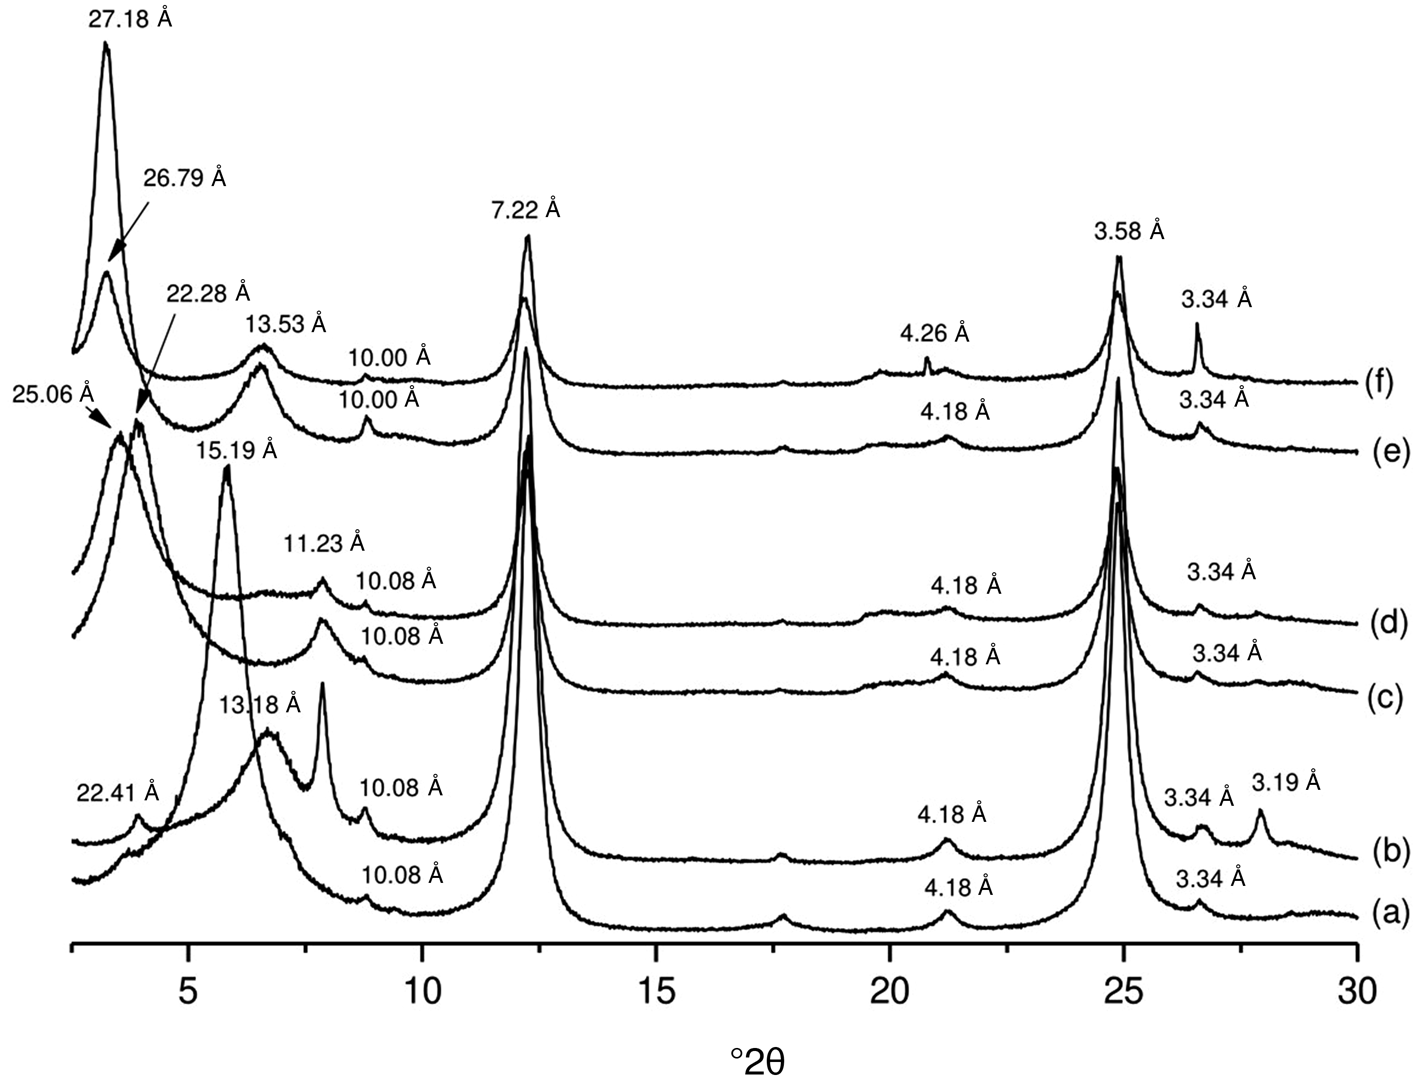
Fig. 11. XRD traces of (a) smectite-rich raw sample K0, (b) hybrid K0+EO, (c) surfactant-modified K1, (d) hybrid K1+EO, (e) surfactant-modified K2.5 and (f) hybrid K2.5+EO.
Summary and conclusions
The main objective of this study was to adsorb L. multiflora EO compounds on two Ivorian clays. The two clays were modified with the surfactant TOMA. Loading of EOs onto raw and modified clays was carried out without using organic solvents and without raising the temperature of the batch. The chemical modifications improve the adsorption of the EO compounds. The interlayer space of the kaolinite-rich clay is not modified by TOMA adsorption, irrespective of its concentration, or by EO adsorption, suggesting that adsorption onto this clay takes place on the external surface. By contrast, the alkylammonium molecules were successfully intercalated in the smectite interlayer space, which expanded up to 12.08 Å depending on the concentration of TOMA. The position of the CH2 asymmetric stretching vibrations for the modified clays (Y1, Y2.5, K1 and K2.5) is higher than that of the pure surfactant, indicating that the surfactant molecules in the organoclay take on disordered conformations compared to those in pure surfactant. The adsorption of EO in this clay may take place on both the external and the internal surfaces. The smectite-rich clay exhibits the greatest levels of adsorption of L. multiflora EO; therefore, it can be considered as a better material for formulating biopesticides compared to kaolinite-rich clay. In this study, TOMA was used as a model. For full-scale tests, it will be necessary to find an ecological surfactant. This study must be furthered by focusing on the quantification of the EO adsorbed and also by evaluating the biological potential of this powdery formulation.
Financial support
This research did not receive any specific grant from funding agencies in the public, commercial or not-for-profit sectors.
Conflict of interest
The authors declare that they have no conflicts of interest.


