


Introduction
Antenatal glucocorticoids are commonly administered to women at risk of preterm birth to reduce the risk of mortality and complications in the offspring.Reference Roberts, Brown, Medley and Dalziel1 However, there is concern that this highly effective therapy may have long-term metabolic consequences, such as obesity, hypertension and insulin resistance.Reference Kemp, Newnham, Challis, Jobe and Stock2, Reference Vogel, Oladapo and Pileggi-Castro3 Studies in rats and sheep exposed to exogenous glucocorticoids during foetal life indicate that pancreatic development and function,Reference Gesina, Blondeau and Milet4–Reference De Blasio, Dodic, Jefferies, Moritz, Wintour and Owens6 as well as hepatic insulin sensitivity,Reference Nyirenda, Lindsay, Kenyon, Burchell and Seckl7–Reference Sloboda, Moss and Li9 may be negatively affected by exogenous glucocorticoid exposure. Studies in humans have reported that preterm-born children, 60%–70% of whom were exposed to antenatal glucocorticoids, had decreased insulin sensitivity and increased plasma insulin concentrations in response to an intravenous glucose tolerance test (ivGTT) compared with term-born appropriate-for-gestational-age children.Reference Hofman, Regan and Jackson10 A population study of >630,000 individuals in Sweden found an approximately 25% increased risk of receiving prescriptions for diabetes in 25–37- year-olds born preterm compared with those born at Term.Reference Crump, Winkleby, Sundquist and Sundquist11 Thirty-year-old offspring from mothers enrolled in the first randomised controlled trial of antenatal glucocorticoids in women at risk of preterm birth and whose mothers received antenatal glucocorticoids had greater plasma insulin concentrations 30 and 120 min after an oral glucose challenge compared with offspring from women who received placebo.Reference Dalziel, Walker and Parag12 Thus, babies who were both born preterm and exposed to antenatal glucocorticoids likely have an increased risk of glucose intolerance in later life. However, as survivors of the earliest trials of antenatal glucocorticoids are not yet old enough to have developed clinical impaired glucose tolerance (IGT), it remains unclear if this is largely an effect of preterm birth or antenatal glucocorticoid exposure.
We previously have reported that ovine glucocorticoid-induced preterm birth reduced β-cell mass and altered pancreatic function in adult offspring compared to term lambs born spontaneously.Reference Bansal, Bloomfield and Connor 13 The aim of this study was to determine if these effects were due to preterm birth or antenatal exogenous glucocorticoid exposure. We hypothesised that preterm birth in sheep induced through blockade of progesterone production,Reference Challis 14 , Reference Jenkin and Thorburn 15 although accompanied by a modest rise in foetal endogenous glucocorticoid concentrations,Reference Silver 16 would result in similar effects on pancreatic β-cell mass and function as preterm birth induced by exogenous glucocorticoids because preterm birth itself, rather than the means of induction, is the predominating factor leading to impaired pancreatic function.
Methods
Experimental paradigm
The University of Auckland Animal Ethics Committee approved all experiments. A cohort of singleton preterm lambs not exposed to exogenous glucocorticoids prior to birth (NG-Prem) was generated by intravenously injecting one dose of 50 mg epostane (2a, 4a, 17-4,5-epoxy-17-hydroxy-4,17-dimethyl-3-ketoandrostane-2-carbonitrile; Sanofi-Synthlabo, Melbourne, Australia) in 2 ml of 100% ethanol (Merck Millipore, Auckland, New Zealand), to ewes on day 136 of pregnancy, resulting in preterm birth on day 137 or 138 (Term = 149 days). Epostane is a competitive inhibitor of 3 β-hydroxysteroid dehydrogenase that prevents conversion of pregnenolone to progesterone.Reference De Matteo, Blasch, Stokes, Davis and Harding 17 This NG-Prem group was compared with lambs that were randomised to being born spontaneously at Term (Term; 148 ± 2 days) or preterm (day 137 gestation) following labour induced with two intramuscular injections of 0.25 mg·kg−1 dexamethasone sodium phosphate (Dexa 0.2, Southern Veterinary Supplies, Hamilton, New Zealand) 12 h apart, commencing on day 135 with preterm lambs born on day 137 as described previously.Reference Bansal, Bloomfield and Connor 13 The distribution of animals in each group is shown in Supplemental Fig. 1. The NG-Prem group was generated subsequent to the G-Prem and Term groups and was, therefore, not a contemporaneous cohort. However, NG-Prem animals were from the same flock as G-Prem and Term, and all procedures in the NG-Prem lambs were performed as for the G-Prem group, including insertion of arterial and venous catheters into the tarsal vessels of the lambs 1–2 days after birth, and saline infusion for 12 days after birth.Reference Bansal, Bloomfield and Connor 13 The data from G-Prem and Term groups have been published previously.Reference Bansal, Bloomfield and Connor 13 All experimental techniques for GTTs, hyperglycaemic clamps (HGCs), euthanasia, tissue collection, immunohistochemistry, protein extraction, hormone and enzyme analysis and quantitative polymerase chain reaction (PCR) that are used in this study have been described previously.Reference Bansal, Bloomfield and Connor 13 For analyses that were conducted previously in G-Prem and Term, randomly selected samples from these groups were included in the assays to confirm consistency between assays. Hepatic gene and protein expression and pancreatic GLP1 and glucokinase (GCK) activity assessment were conducted at the same time in all three groups.
Intravenous glucose tolerance test and hyperglycaemic clamps
A GTT and a hyperglycaemic clamp were performed post-weaning at 4 months (male (M)/female (F): Term, 8M/4F; G-Prem, 6M/9F; NG-Prem, 5M/7F) and post-puberty at 10 months (Term, 8M/4F; G-Prem, 6M/9F; NG-Prem, 5M/6F) after birth (adjusted for prematurity). Briefly, ivGTT involved collection of two 3 ml baseline blood samples after an overnight fast, followed by an intravenous infusion of 0.5 g·kg−1 of a 50% dextrose solution (Baxter, Auckland, New Zealand) over 30 s and then collection of 3 ml blood samples at 2, 5, 10, 15, 20, 30, 40, 50, 60, 75, 90, 105, 120 and 180 min.Reference Bansal, Bloomfield and Connor 13 Plasma was collected by spinning the blood samples at 3000 rpm for 10 min at 4°C. Plasma glucose concentration was measured by enzymatic colorimetric assay with a coefficient of variation ≤10% (Roche Diagnostics, Mannheim, Germany) on a Roche/Hitachi 902 Automatic Analyser (Hitachi High-Technologies Corporation, Tokyo, Japan).Reference Bansal, Bloomfield and Connor 13
The HGCs were performed 3–4 days after the ivGTT using the same catheters as described previouslyReference Todd, Oliver, Jaquiery, Bloomfield and Harding 18 with minor modifications including a 100 mg·kg−1 bolus of intravenous arginine after 135 min of steady-state hyperglycaemia. Blood glucose concentration (BGC) was measured as an immediate result was required to allow adjustment of the glucose infusion rate to maintain steady-state hyperglycaemia (YSI 2300, Yellow Springs Instruments, Dayton, OH, USA).
Pancreatic and liver tissue collection
Four weeks post-term, at the same post-conceptional age, a randomly selected sub-group of sheep (Term, 3M/3F; G-Prem, 2M/4F; NG-Prem, 3M/3F) was killed with an overdose of pentobarbitone (0.25 ml·kg−1). At 12 months chronological age, remaining animals (Term, 9M/4F; G-Prem, 6M/9F; NG-Prem, 5M/7F) were killed by stunning with a captive bolt pistol followed by rapid exsanguination. Prior to post-mortem at 4 weeks post-term, lambs received two intravenous injections 24 h apart of 100 mg·kg−1 bromodeoxyuridine (BrdU; Roche Diagnostics New Zealand Ltd.), a synthetic analogue of thymidine that is incorporated into proliferating cells. The cost of BrdU in adult animals at 12 months of age would have been prohibitive; therefore, an alternative method for determining proliferation was used (see below). At post-mortem, the pancreas was rapidly dissected, weighed and cut in half along the head–tail axis such that each half contained representation of all parts of the pancreas. Liver tissue and half of pancreas were immediately frozen on dry ice and stored at −80°C for molecular biology analysis; the other half of pancreas was placed in 4% paraformaldehyde (Scharlau, Barcelona, Spain) for immunohistochemical analysis. The carcass was weighed after removal of all body organs.
Immunohistochemistry
Fixed pancreata containing head, body and tail from n = 6 animals in each group were sectioned with 5 µm thickness. Every 20th section, 100 µm apart, was selected for immunostaining (six sections per animal). Immunofluorescent staining was performed using: insulin and glucagon/somatostatin to determine β-cell and α/δ cell area and number, insulin and BrdU (4 weeks post-term) or Ki67 (12 months) to determine β-cell proliferation and insulin and active-caspase 3 to determine β-cell apoptosis. 4′,6-Diamidino-2-phenylindole (DAPI) was used as a nuclear stain. Randomly selected samples from G-Prem and Term groups were included in the analyses to ensure reproducibility between the current animals and previously reported data.
Ten to twelve randomly selected fields of view (FOV; 0.11 mm2) from each section were photographed at 400× magnification on a fluorescence Olympus Inverted IX7I microscope (Olympus New Zealand Ltd., Auckland, New Zealand) using imaging software (DP Controller 1.1.1.65, Olympus).Reference Bansal, Bloomfield and Connor 13 The photographs were analysed by automated image analysis (Metamorph image-analysis software, v 6.2.6, Molecular Devices, Sunnyvale, CA, USA).Reference Dragunow 19 The Metamorph script counted blue as DAPI-stained nuclei; red stain surrounding the nuclei as insulin-positive β cells and green stain surrounding the nuclei as either glucagon/somatostatin-positive α/δ cells, active-caspase 3-positive apoptotic cells, or BrdU/Ki67-positive proliferating cells.
Hormone and enzyme analysis
Plasma ovine insulin concentrations were measured by specific radioimmunoassay established and validated for maternal and foetal sheep plasma as described previously.Reference Davis, Gluckman, Hart and Henderson 20 The minimal detectable concentration was 0.03 ng·ml−1, and the inter-and intra-assay coefficients of variations (CVs) were 11.1% and 11.0%, respectively, consistent with those of the Term and G-Prem assays.Reference Bansal, Bloomfield and Connor 13 Insulin radioimmunoassays for NG-Prem group included the same quality control samples used for G-Prem and Term groups. Also, randomly selected samples from G-Prem and Term groups were included in the analyses to ensure reproducibility between the current animals and previously reported data.
The active forms of glucagon-like peptide 1 [GLP1 (7–36 amide) and GLP1 (7–37)] in all three groups were quantified in 100 μl of diluted total pancreatic protein lysates by using GLP1 (Active) ELISA kit (Cat# EGLP-35K, Abacus ALS, Auckland, New Zealand), and glucokinase enzyme activity in the total protein lysates was determined using a combination of UPLC and mass spectrometry. The intra- and inter-assay CVs were 5% and 7%, respectively.
Western blotting
Total protein was extracted from 50 mg of liver samples following the same procedure as used for pancreatic samples.Reference Bansal, Bloomfield and Connor 13 The expression of target proteins (Glut2, Pepck, G6Pase, Pparα) was determined by western blotting in 10 μg of protein using pre-cast NuPAGE® 4%–12% Bis-Tris Gels (Invitrogen, New Zealand) and iBlot™ Dry Blotting System (Invitrogen, Auckland, New Zealand). Membranes were incubated in 5% non-fat dry milk blocking buffer for 2 h at room temperature to block non-specific binding, followed by an overnight incubation at 25 rpm at 4°C in the following primary antibodies diluted in 5% bovine serum albumin (BSA) solution: rabbit polyclonal anti-Glucose transporter 2, 1:200 (Abcam Cat# ab54460); rabbit polyclonal anti-PEPCK, 1:750 (Abcam Cat# ab28455); rabbit polyclonal anti-Glucose 6 phosphatase, 1:750 (Abcam Cat# ab83690); rabbit polyclonal anti-PPARα, 1:1500 (Abcam Cat# ab8934) and mouse monoclonal anti-beta actin AC15, 1:100,000 (Abcam Cat# ab6276). This was followed by the anti-rabbit (goat anti-rabbit IgG-peroxidase conjugate; Sigma Cat# A-0545) or anti-mouse (sheep anti-mouse IgG-peroxidase conjugate; Sigma Cat# A-6782) secondary antibody incubation for 1 h at 40 rpm at room temperature diluted in 5% non-fat milk as follows: anti-rabbit (Glut2, 1:15,000; PEPCK and G6Pase, 1:50,000; PPARα, 1:10,000) and anti-mouse (beta actin; 1:10,000). Finally, the membranes were incubated for 5 min in 1 ml of enhanced chemiluminesence detection substrate (SuperSignal® West Dura Extended Duration Substrate kit, ThermoScientific, New Zealand) with enhancer and substrate ratio 1:1.
The immuno-reactive proteins were then visualised by exposing the membrane to auto-radiographic/blue X-ray films (Cx ORTHO HT-G NIF 18*24 cm, Cass Medical Ltd., Auckland, New Zealand) for different time periods. Subsequently, the radiographic films were developed and fixed by feeding the films in the X-ray film processor (CP 1000, AGFA-Healthcare NV, Belgium). The radiographic films were visualised and scanned on a GS800 Calibrated densitometer (Bio-Rad, Hercules, CA, USA) using the Quantity One Software (Bio-Rad). The optical density of the bands was determined by using the Image J software. The density of bands on the film relates to the enhanced chemiluminescent signal intensity and thus reflects expression of the protein.
Molecular analysis
Total RNA was extracted from 50 mg of ground frozen pancreatic and liver tissue samples using TRIZOL® Reagent (Invitrogen, New Zealand), quantified using the Nanodrop, and RNA integrity of the samples was assessed by running a 1% w/v agarose gel. cDNA was synthesized with 2.5 µg of RNA using the SuperScript® VILO™ cDNA Synthesis Kit (Invitrogen, Auckland, New Zealand), and real-time PCR was performed using TaqMan Gene expression assay in the ABI Prism 7900HT Sequence Detector (Applied Biosystems, Foster City, CA, USA). For pancreatic samples, randomly selected samples from G-Prem and Term groups were included in the assays to ensure reproducibility. Hepatic analyses on all samples from the three groups were conducted at the same time. Ovine or porcine sequences were used for designing primers and probe where available (Supplemental Table 1; also refer to Supplemental Table 1 ofReference Bansal, Bloomfield and Connor 13 for pancreatic primers and housekeeping genes).
Statistical analysis
For gene expression, data were analysed as fold change in mRNA expression levels of target gene normalised to a panel of housekeeping genes in the treatment group relative to its normalised expression in the comparator group using Pfaffl’s relative ratio.Reference Pfaffl 21 The target gene expression was normalised with the BestKeeper index of 3–4 housekeeping genes selected from a panel of potential housekeeping genes (rpl19, 18S, beta actin, cyclophillin A and gapdh).Reference Pfaffl, Tichopad, Prgomet and Neuvians 22 Data are expressed as fold change relative to the comparison group, normalised by the BestKeeper index and with 99% confidence intervals to account for multiple comparisons.
β-Cell mass and analysis of hyperglycaemic clamp data including assessment of area under the curve (AUC), first phase insulin response (FIR), steady-state insulin secretion (SIR), insulin sensitivity (SI) and disposition index (DI) were calculated as described previously.Reference Bansal, Bloomfield and Connor 13 Growth velocity was calculated using the formula: [log(WN/W1)*1000]/(DN−D1), where W = body weight, D = date of assessment, N = nth time point and 1 = starting time point.Reference Patel, Engstrom, Meier and Kimura 23 Data are presented as mean (standard error of mean, SEM), mean (95% confidence interval (CI) or median interquartile range (IQR) as appropriate. A p value of <0.05 (<0.01 for molecular data) was taken as statistically significant.
GLP1 ELISA, glucokinase enzyme activity, western blotting and immunohistochemistry data were analysed by two-way analysis of variance (ANOVA) with group and sex taken as interaction terms and sample ID as a random effect. GTT and HGC clamp data were analysed by one-way ANOVA. A multiple comparison Tukey’s post hoc test was conducted to determine statistical differences amongst groups. GTT and HGC data from studies performed at 4 and 10 months of age were compared using a paired t-test. Non-parametric data were log transformed to approximate a normal distribution if possible; else data were analysed by Wilcoxon test. Multiple regression analysis was performed with perinatal interventions (preterm birth and steroid exposure) and sex as co-variants. A p value <0.05 was considered statistically significant.
Results
Survival
Twenty-three ewes were given epostane to induce preterm delivery, 21 of which birthed successfully. Two ewes did not deliver preterm and were euthanized. Although not statistically different, neonatal mortality was higher in NG-Prem compared to G-Prem and Term (Table 1). Two of the NG-Prem lambs died from respiratory distress and one from infection despite antibiotic treatment; mortality in the Term and G-Prem groups has been reported previously.Reference Alsweiler, Harding and Bloomfield 24
Table 1. Baseline characteristics for Term, glucocorticoid-induced preterm (G-Prem) and non-glucocorticoid-induced preterm (NG-Prem) lambs

Values are mean (SEM), median (IQR) or n (%). p values are from an ANOVA, or Wilcoxon test.
*NG-Prem is significantly different from G-Prem on Tukey's post hoc test (p < 0.05).
† NG-Prem is significantly different from Term on Tukey’s post hoc test (p < 0.05).
Growth velocity
NG-Prem and G-Prem lambs had similar body weight at birth, which was less than Term lambs (Fig. 1 and Table 1). From birth to term-corrected age (day 149 of gestation), NG-Prem grew faster than G-Prem (mean [SEM], birth to term: NG-Prem = 55.1 [2.8], G-Prem = 41.5 [3.4] g·kg−1·d−1, p = 0.01). NG-Prem had similar growth velocity as G-Prem from term to 4 weeks post-term, from 4 weeks post-term to 4 months of age and from 4 to 10 months of age (mean [SEM], term to 4 weeks post-term: NG-Prem = 24.3 [1.0], G-Prem = 24.3 [2.4] g·kg−1·d−1, p = 1.00; 4 weeks post-term to 4 months: NG-Prem = 10.2 [0.7], G-Prem = 8.2 [0.9] g·kg−1·d−1, p = 0.19; 4 to 10 months: NG-Prem = 2.3 [0.2], G-Prem = 2.1 [0.2] g·kg−1·d−1, p = 0.81). NG-Prem had slower growth velocity than Term between term to 4 weeks post-term (Term = 34.5 [2.1] g·kg−1·d−1, p = 0.01), similar rate from 4 weeks post-term to 4 months of age (Term = 9.2 [0.8] g·kg−1·d−1, p = 0.61) and faster growth between 4 and 10 months (Term = 1.4 [0.2] g·kg−1·d−1, p = 0.01), and consequently, were heavier than Term at 10 months of age (Fig. 1). There were no significant differences in growth velocity between male and female lambs.

Fig. 1. Body weight from birth to 10 months of age in Term (n = 7M/4F), G-Prem (n = 3M/6F) and NG-Prem (n = 5M/7F) sheep. (a) Body weight curve from birth to 10 months of age. (b) Body weight at birth, (c) body weight at day 149 (Term), (d) body weight at 4 weeks post-term, (e) body weight at 4 months of age and (f) body weight at 10 months of age. Data are mean with SEM. *p < 0.05 for NG-Prem vs. G-Prem and †p < 0.05 for NG-Prem vs. Term.
Baseline glucose concentrations
The baselineG values from the GTT and HGC are different because plasma glucose concentrations were measured for the GTT, whereas BGCs were measured for the HGC. There is approximately 10%–15% difference between blood and plasma glucose concentrations in humans, depending upon the haematocrit.Reference Holtkamp, Verhoef and Leijnse25 At 4 and 10 months of age, baseline plasma/BGCs (baselineG) from the GTT and HGC in NG-Prem lambs were higher than G-Prem (Fig. 2; Tables 2 and 3) and similar to Term. There was no change in baselineG from 4 to 10 months of age on paired analysis.

Fig. 2. Glucose tolerance test curves. (a) GTT plasma glucose concentration, (b) plasma insulin concentration and (c) insulin: glucose ratio values at 4 months (left) and 10 months (right) of age in Term (▴; 4 months: n = 8M/4F, 10 month: n = 8M/4F), G-Prem (♦; 4 months: n = 6M/6F, 10 months: n = 6M/8F) and NG-Prem (•; 4 months: n = 5M/7F; 10 months: n = 5M/6F) sheep. p values refer to the group effect on an ANOVA on areas under the curve. Data are mean with SEM.
Table 2. Glucose tolerance test data at 4 and 10 months of age in term (Term; 4 months: 8M/4F; 10 months: 8M/4F), glucocorticoid-induced preterm (G-Prem; 4 months: 6M/6F; 10 months: 6M/8F) and non-glucocorticoid induced preterm (NG-Prem; 4 months: 5M/7F; 10 months: 5M/6F) sheep

G, plasma glucose concentration; I, plasma insulin concentration; AUC, area under the curve.
Data were analysed with one-way ANOVA between groups followed by Tukey’s post hoc test on normally distributed data after using appropriate transformation where necessary. Values are mean with SEM of raw data.
Note: Values for 4 months BaselineI and 10 months PeakG were not normally distributed even after transformation, therefore, are presented as median (IQR) and were analysed with a Wilcoxon test.
* NG-Prem is significantly different from G-Prem (p < 0.05).
† NG-Prem is significantly different from Term (p < 0.05).
Table 3. Hyperglycaemic clamp (HGC) data at 4 and 10 months of age in term (Term; 4 months: 6M/4F; 10 months: 8M/4F), glucocorticoid-induced preterm (G-Prem; 4 months: 6M/8F; 10 months: 6M/9F) and non-glucocorticoid induced preterm (NG-Prem; 4 months: 5M/7F; 10 months: 5M/6F) sheep

G, blood glucose concentration; FBGC, blood glucose concentration 5 min post dextrose bolus; FI, plasma insulin concentration 5 min post dextrose bolus; AUC, area under the curve; FIR, first phase insulin response during the 0–20 min of the HGC; SIR, steady-state insulin response during 75–135 min of the HGC; SI, insulin sensitivity; AC, arginine challenge; DI, disposition index.
Data were analysed by one-way ANOVA between groups followed by Tukey’s post hoc test on normally distributed data after using appropriate transformation where necessary. Values are mean with SEM of raw data.
Note: Values for baselineG were not normally distributed even after transformation, therefore, are presented as median (IQR) and analysed with a Wilcoxon test.
*NG-Prem is significantly different from G-Prem (p < 0.05).
† NG-Prem is significantly different from Term (p < 0.05).
Insulin secretion and sensitivity
At 4, but not 10, months of age, insulin AUCI and insulin to glucose AUC ratio (AUCI:G) from the GTT in NG-Prem were similar to G-Prem and less than Term (Fig. 2; Table 2). In the HGC at both 4 and 10 months, 5 min after the dextrose bolus the BGC and insulin-glucose ratio in NG-Prem were similar to G-Prem as were the steady-state insulin secretion and insulin sensitivity. Compared with Term, in NG-Prem, BGC was increased, insulin-glucose ratio decreased, steady-state insulin secretion was decreased and insulin sensitivity increased (Fig. 3; Table 3).

Fig. 3. Hyperglycaemic clamp (HGC) blood glucose and plasma insulin concentrations. Blood glucose (open symbols) and plasma insulin concentrations (closed symbols) during an hyperglycaemic clamp and arginine challenge at 4 months (a) and 10 months (b) of age in Term (▵,▴; 4 months: n = 6M/4F, 10 months: n = 8M/4F), G-Prem (⋄,♦; 4 months: n = 6M/8F, 10 months: n = 6M/9F) and NG-Prem (○,•; 4 months: n = 5M/7F; 10 months: n = 5M/6F) sheep. Dotted line shows BGC of 10 mmol/l. Arrow indicates time of arginine administration. p values are the group effect on an ANOVA on areas under the curve for first phase insulin response during 0–20 min of the HGC, steady-state insulin response during 75–135 min of the HGC and insulin response on an arginine challenge. Data are mean with SEM.
On paired analysis, NG-Prem had a significant reduction in SI from 4 to 10 months of age similar to G-Prem (mean [SEM], NG-Prem = 18.7 [2.5] vs. 9.5 [1.5], p < 0.01; G-Prem 20.4 [2.3] vs. 11.8 [1.5] µmol·ml−1·kg−1·min−1·ng−1 p < 0.05); this was not seen in Term (12.1 [2.8] vs. 10.4 [1.5] µmol·ml−1·kg−1·min−1·ng−1, p = 0.44).
Beta-cell mass at pre-weaning age and in adulthood
Representative photomicrographs of pancreatic immunofluorescent histochemistry at 4 weeks post-term and 12 months of age are shown in Figs. 4 and 5, respectively. At 4 weeks post-term and at 12 months of age, in NG-Prem lambs β-cell mass, β-cell mass adjusted for body weight and β-cell number per field of view were ~30%–50% (p < 0.05) lower than in G-Prem and ~60%–80% lower than Term lambs (p < 0.01) (Table 4).

Fig. 4. Representative photomicrographs of triple immunofluorescent staining of the pancreas of non-glucocorticoid-induced preterm lambs at 4 weeks post-term. Red staining = insulin, green staining = glucagon and somatostatin (Gcg-Som), or active caspase 3, or BrdU, blue staining = 4′,6-diamidino-2-phenylindole (DAPI)-stained nuclei.

Fig. 5. Representative photomicrographs of triple immunofluorescent staining of the pancreas of non-glucocorticoid-induced preterm sheep at 12 months of age. Red staining = insulin, green staining = glucagon and somatostatin (Gcg-Som), or active caspase 3, or Ki67, blue staining = 4′,6-diamidino-2-phenylindole (DAPI)-stained nuclei.
Table 4. β cell parameters at 4 weeks post-term and 12 months of age in term (Term; 4 weeks: 3M/2F; 12 months: 3M/3F), glucocorticoid-induced preterm (G-Prem; 4 weeks: 2M/3F; 12 months: 3M/3F) and non-glucocorticoid induced preterm (NG-Prem; 4 weeks: 3M/3F; 12 months: 3M/3F) sheep

Data were analysed by two-way ANOVA random effect model (with group and sex taken as interaction terms and sample ID as a random effect) followed by a Tukey’s post hoc test on normally distributed data after using appropriate transformation where necessary.
Values are mean with SEM of raw data.
* NG-Prem is significantly different from G-Prem (p < 0.05).
† NG-Prem is significantly different from Term (p < 0.05).
At 4 weeks post-term, NG-Prem lambs had 20%–90% (p < 0.05) increased β-cell apoptosis and ~60% (p < 0.05) reduced β-cell proliferation compared with G-Prem and Term lambs (Table 4). Consequently, NG-Prem lambs had 7–13 fold (p < 0.05) higher apoptosis: proliferation ratio than in G-Prem and Term lambs (Table 4). At 12 months of age, NG-Prem had similar β-cell apoptosis and proliferation than G-Prem, but 60%–70% increased β-cell apoptosis, ~50% reduced β-cell proliferation, and thus 4–7 fold higher β-cell apoptosis: proliferation ratio than Term sheep (p < 0.05) (Table 4).
mRNA expression of key pancreatic genes
At 4 weeks post-term, mRNA expression in NG-Prem of pdx1, glut2, glucokinase and insulin was similar to G-Prem, and expression of igf1 was decreased by 25% but that of igf2 increased by 14% compared with G-Prem (Table 5). Expression of pdx1, igf1, glut2 and glucokinase was 20%–150% higher in NG-Prem and that of insulin 44% lower than in Term (Table 5). At 12 months of age, mRNA expression of pdx1, igf1, igf2, glucokinase and insulin in NG-Prem was 21%–71% lower than in G-Prem, and mRNA expression of igf2, glucokinase and insulin was 42%–80% lower than in Term (Table 5).
Table 5. Pancreatic and hepatic mRNA expression levels at 4 weeks post-term and 12 months of age in glucocorticoid-induced preterm (G-Prem; 4 weeks: 2M/4F, 12 months: 5M/7F), non-glucocorticoid induced preterm (NG-Prem; 4 weeks: 3M/3F, 12 months: 5M/7F) and term controls (Term; 4 weeks: 3M/3F; 12 months: 9M/4F).

pdxl, pancreatic duodenum homeobox 1; igf 1/2, insulin like growth factor 1/2; glut2, glucose transporter type 2; gck, glucokinase; pepck, phosphoenolpyruvate carboxykinase; srebp1, sterol regulatory element binding protein 1; pparα, peroxisome proliferator activated receptor alpha.
Data are normalised with rpl19, 18S, cyclophillin A and gapdh and shown as fold change with 99% confidence intervals (given in parenthesis). If confidence intervals do not include 1, then mRNA expression levels are statistically different from the comparator group set at 1.
mRNA and protein expression of key hepatic genes
At 4 weeks post-term, hepatic mRNA expression of pparα and glut2 in NG-Prem was 7%–24% lower than in G-Prem, and the expression of glut2, pparα, srebp1 was 21%–60% lower than in Term (Table 5). mRNA expression of pepck mRNA expression was similar amongst all three groups (Table 5). Protein expression of Pparα, Pepck, GLUT2 and G6Pase in NG-Prem was similar to G-Prem, but Glut2 protein expression was significantly reduced compared to Term (Fig. 6). At 12 months of age, hepatic mRNA expression of glut2 was ~150% higher than in both G-Prem and Term and that of pepck was 26% higher in NG-Prem than in Term (Table 5). mRNA expression levels of pparα in NG-Prem were 26% lower than in G-Prem; mRNA levels of srebp1 were not different (Table 5). These modest differences in mRNA expression did not lead to differences in protein expression levels amongst groups (Fig. 6). The protein expression of G6Pase at both 4 weeks and 12 months was similar amongst groups (Fig. 6).
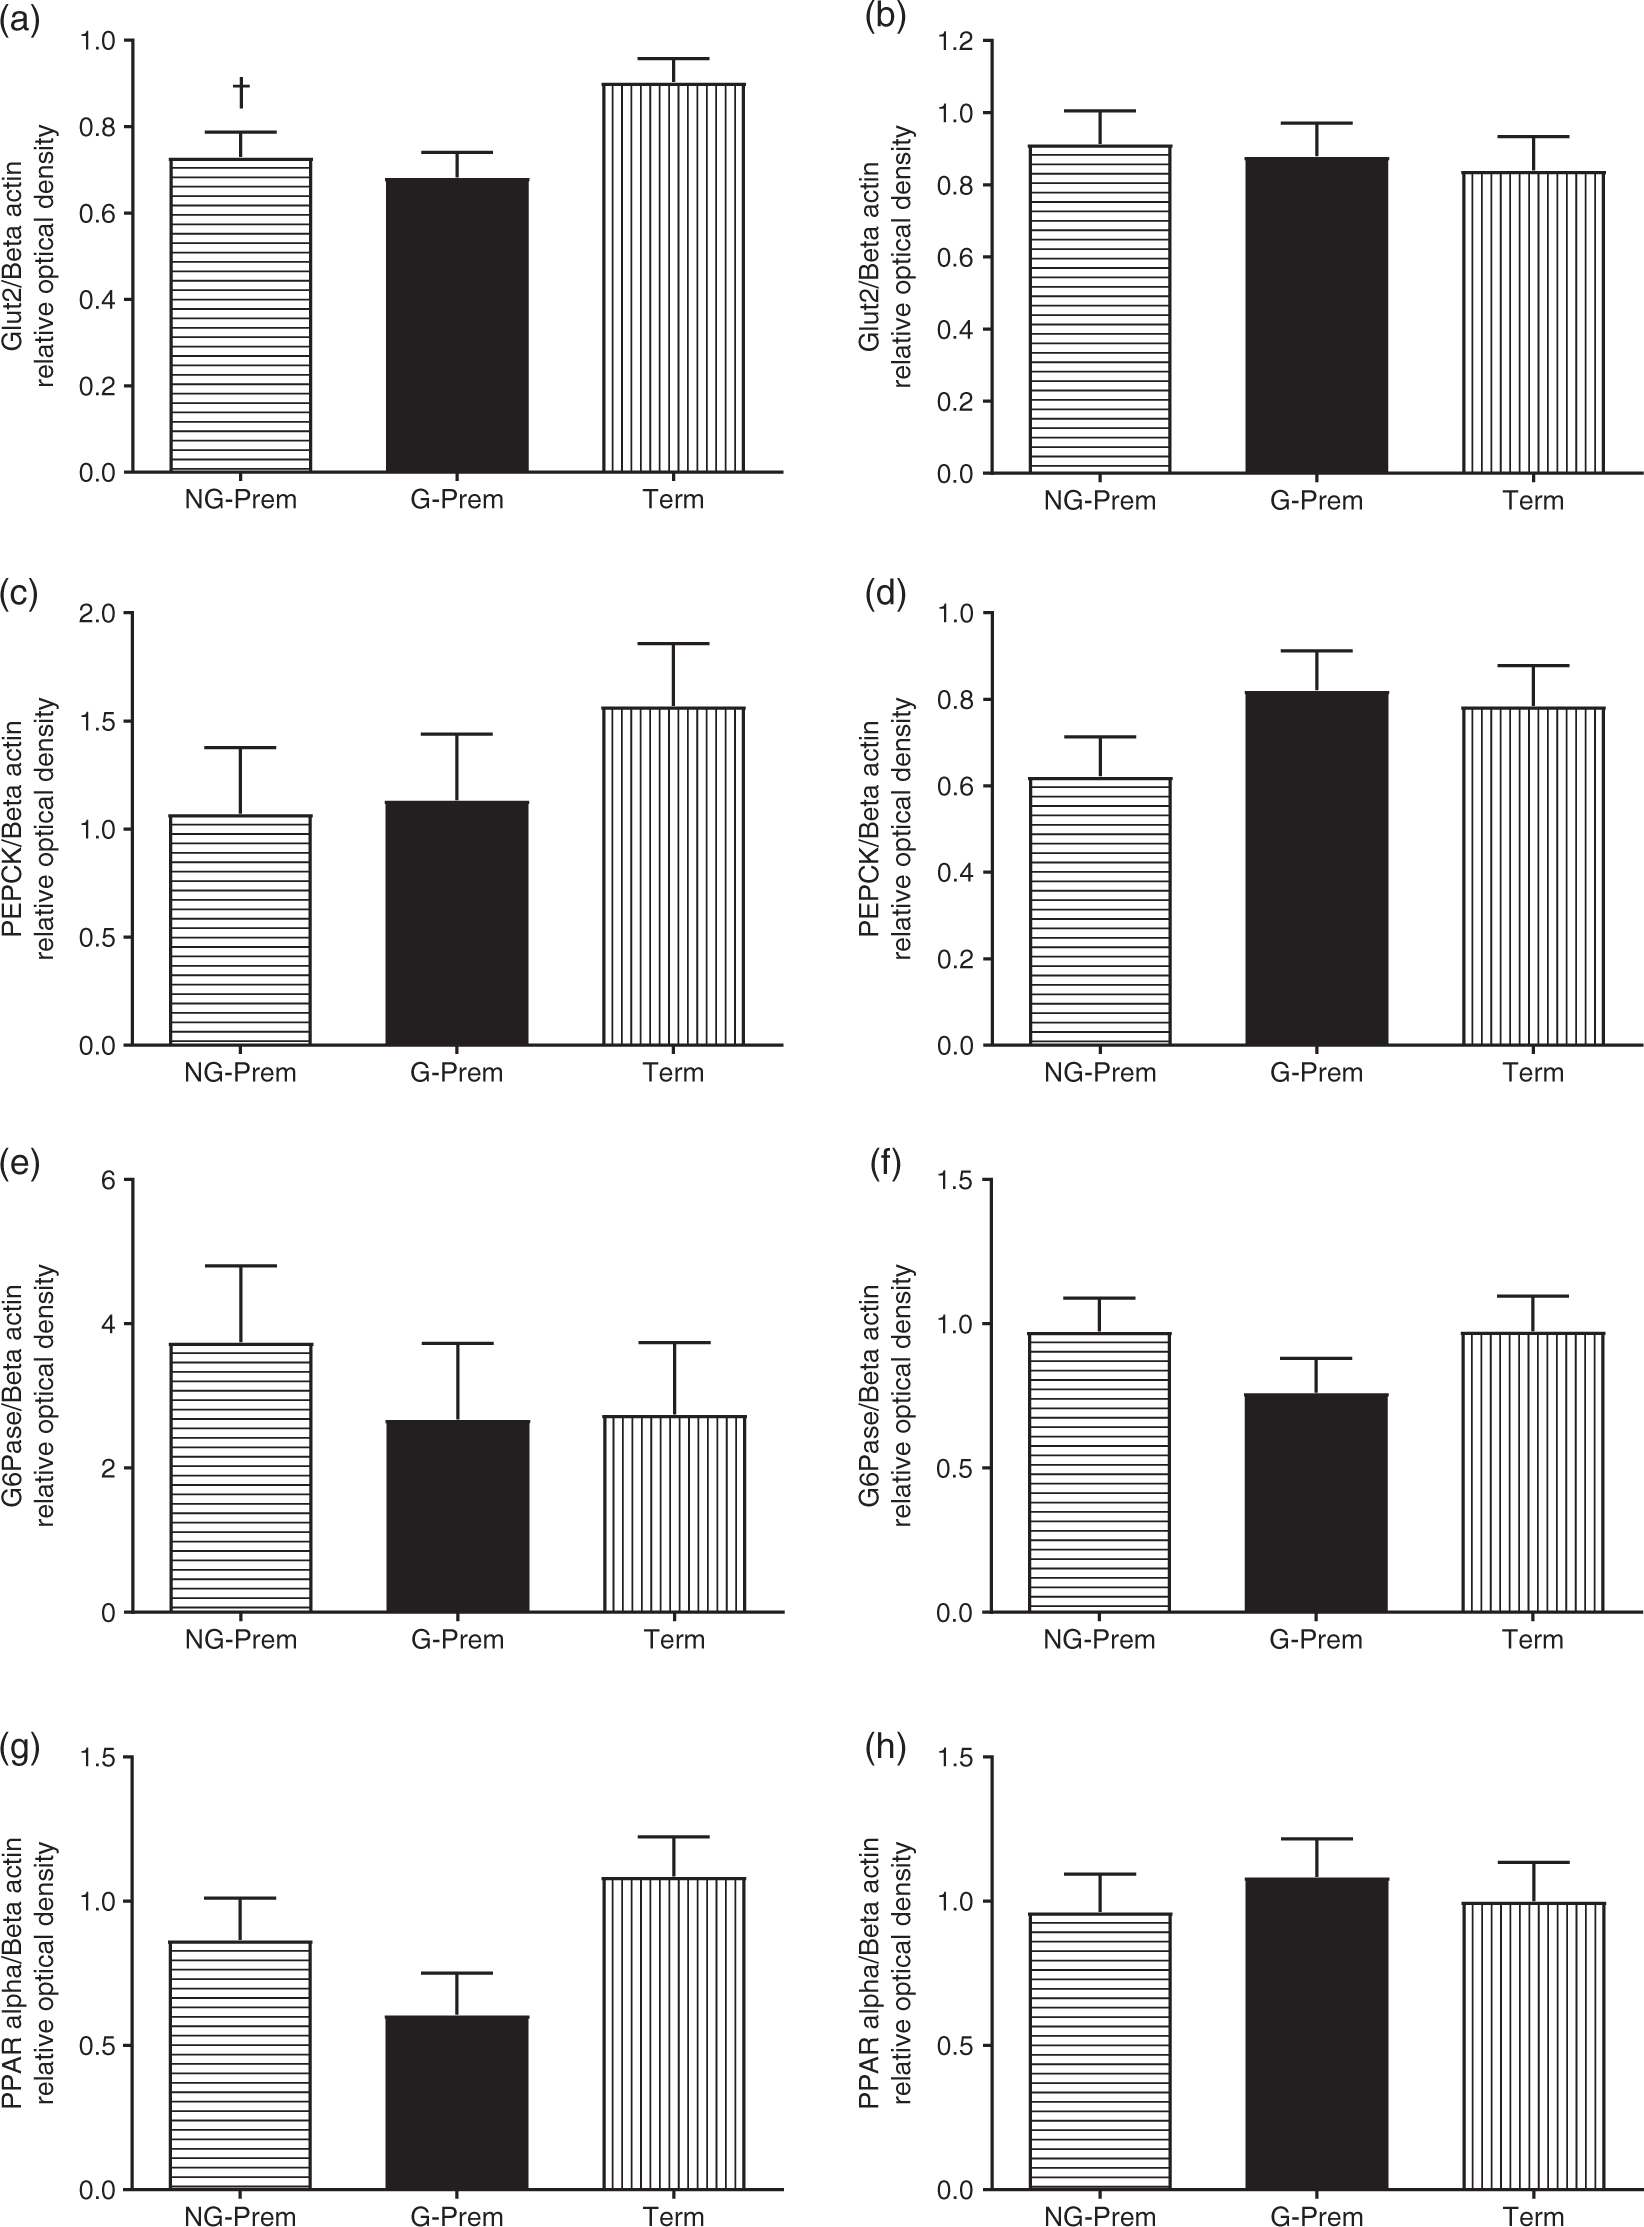
Fig. 6. Hepatic protein expression of Glut2 (a), G6Pase (b), Pepck (c), Pparα (d) at 4 weeks post-term (left column) and 12 months of age (right column) in term (Term; 4 weeks: 3M/3F; 12 months: 9M/4F), glucocorticoid-induced preterm (G-Prem; 4 weeks: 2M/4F, 12 months: 5M/7F) and non-glucocorticoid-induced preterm (NG-Prem; 4 weeks: 3M/3F, 12 months: 5M/7F) sheep. Data are mean with SEM. †p < 0.05 for NG-Prem vs. Term.
Pancreatic glucokinase activity and pancreatic GLP1
At 4 weeks post-term, there was no difference in glucokinase enzyme activity and pancreatic GLP1 concentrations amongst groups (Supplemental Fig. 2).
Discussion
The aim of this study was to determine whether, in sheep, preterm birth induced through blockade of progesterone production would have similar effects on pancreatic development to the previously described effects of preterm birth induced with exogenous glucocorticoids. Contrary to our hypothesis, preterm birth induced with epostane resulted in a further reduction in β-cell mass and elevated baseline glucose concentrations compared with preterm birth induced with exogenous glucocorticoids (Table 6). This suggests that the changes we reported previously are likely due to preterm birth itself and that antenatal exogenous glucocorticoids (AEG), rather than further impairing pancreatic development, may mitigate the effects of preterm birth.
Table 6. Summary of the effects of preterm induced with epostane (NG-Prem) vs. exogenous glucocorticoids (G-Prem) compared with birth at term (Term) on pancreas and liver in sheep

igf 1/2, insulin like growth factor 1/2; glut2, glucose transporter type 2; pparα, peroxisome proliferator activated receptor alpha.
Note: n.s. not significant (p > 0.05); arrows represent directionality of change with p < 0.05.
There is conflicting evidence between animal and human studies regarding the effects of antenatal exogenous glucocorticoid exposure on the long-term health of the offspring.Reference Kemp, Newnham, Challis, Jobe and Stock 2 Several experimental animal studies have reported correlations between antenatal glucocorticoid administration and increased risk of blood pressure,Reference Dodic, Wintour, Whitworth and Coghlan26 hypertensionReference Edwards, Coulter, Symonds and McMillen 27 and impaired glucose tolerance in adult offspring.Reference Clark 28 , Reference Seckl 29 However, systematic reviews from human clinical data demonstrate that exposure to a single course of antenatal glucocorticoids to mothers in preterm labour improves lung maturation and reduces respiratory distress in the offspring as well as resulting in fewer neonatal deaths and neurologic morbidities such as cerebroventricular haemorrhage.Reference Brownfoot, Gagliardi, Bain, Middleton and Crowther 30 , Reference Roberts and Dalziel 31 Antenatal glucocorticoids given to women at risk of preterm birth did not result in any differences in cognitive function,Reference Dalziel, Lim and Lambert 32 systolic blood pressureReference Dalziel, Walker and Parag 12 or prevalence of diabetesReference Dalziel, Walker and Parag 12 in 30 -year-old offspring compared with offspring of women who received a placebo. Nevertheless, there was a suggestion of increased insulin resistance in the exposed group, indicated by a greater insulin concentration in response to a GTT.Reference Dalziel, Walker and Parag 12 There is also emerging evidence that repeat courses of antenatal glucocorticoids are beneficial rather than harmful for the offspring, with no adverse effects reported up to mid-childhood on cognition, behaviour, body size, lung function, blood pressure, metabolic risk factors including glucose tolerance and insulin sensitivity or bone development.Reference McKinlay, Cutfield, Battin, Dalziel, Crowther and Harding 33 , Reference Crowther, Anderson and McKinlay 34
Our findings suggest that, in sheep, exposure to AEG provides some protection from the reduced β-cell mass caused by preterm birth seen in the animals induced with epostane. This beneficial effect was associated with decreased baseline glucose concentrations both at weaning and in early adulthood compared with animals induced with epostane. In order to maintain glucose homeostasis, it is important that any reduction in insulin sensitivity is compensated by an increase in insulin secretion. Both NG-Prem and G-Prem groups had a significant reduction in insulin sensitivity from 4 to 10 months of age, while term-born animals did not. In the NG-Prem group, the reduction in insulin sensitivity was accompanied by accelerated growth velocity from 4 to 10 months of age than Term and higher body weight than G-Prem and Term at 10 months of age. In the NG-Prem group, this was further accompanied by a greater reduction in the compensatory capacity to increase insulin secretion compared with the G-Prem group, as evident by a greater reduction in β-cell mass at 4 weeks post-term and at 12 months of age. Together, these findings suggest that the NG-Prem group might be at a greater risk of impaired glucose tolerance with ageing than G-Prem group.
The mechanism of reduced β-cell mass following preterm birth in sheep is not known. It is possible that the insulin-like growth factors may play a role as both igf1 and igf2 play an essential role in β-cell regeneration and development.Reference Agudo, Ayuso and Jimenez 35 , Reference Smith, Rosen, Villa-Komaroff, Weir and Bonner-Weir 36 In young adult sheep that were growth restricted before birth, pancreatic mRNA expression of the igfs was positively correlated with β-cell mass.Reference Gatford, Mohammad and Harland 37 A recent study also demonstrated that increased igf1 expression promotes β-cell proliferation and regeneration.Reference Mallol, Casana and Jimenez 38 In our study, although both preterm groups had higher igf1 mRNA expression and lower β-cell mass at 4 weeks post-term compared with Term, by 12 months of age, igf2 mRNA expression was lower, apoptosis:proliferation ratio was higher and β-cell mass was lower compared with Term. Also, NG-Prem had lower igf1 mRNA, higher β-cell apoptosis-proliferation ratio and lower β-cell mass compared to G-Prem at 4 weeks post-term. By 12 months of age, NG-Prem had lowest igf2 mRNA expression levels compared to G-Prem and Term, highest β-cell apoptosis-proliferation ratio and the lowest β-cell mass. Thus, igfs might be potential mediators influencing β-cell development in preterm sheep.
In contrast to these pancreatic findings, there were few significant effects of preterm birth on insulin-responsive hepatic glucose and fatty acid metabolic pathways until young adulthood. This is consistent with the physiological findings of no change in insulin sensitivity at post-pubertal age in these animals. It is possible that hepatic changes may appear at later ages, as reported in a systematic review of preterm-born adults.Reference Tinnion, Gillone, Cheetham and Embleton 39 A relatively limited candidate gene approach was taken for the investigation of hepatic changes, determined largely by logistic and fiscal factors. Thus, it may be that a broader approach, for example, using microarray or transcriptomics technology may have identified other metabolic pathways in the liver that were affected by preterm birth. Alternatively, it is possible that the liver is more resilient and is able to maintain normal function despite preterm birth and that other insulin-sensitive tissues, such as muscle and adipose tissue, could influence insulin sensitivity as the animals age. This is worthy of further investigation.
It is important to note that the NG-Prem group is not reflective of a spontaneously preterm-born cohort. Epostane, the non-glucocorticoid compound used in this study, is a competitive inhibitor of 3 β-hydroxysteroid dehydrogenase which prevents the conversion of pregnenolone to progesterone. We were not able to control for potential effects of epostane itself, and any chemical method of inducing preterm birth has potential for other effects. Birth by Caesarean section would be an alternative, but this interferes with mother–offspring bonding, suckling and establishment of the microbiome, significantly decreases foetal cortisol concentrations and impairs pulmonary function in the offspring,Reference Mears, McAuliffe, Grimes and Morrison 40 , Reference Faxelius, Hägnevik, Lagercrantz, Lundell and Irestedt 41 all of which also could have potential effects on offspring development. We cannot exclude the possibility that the foetuses induced with epostane had changes in endogenous glucocorticoids that could have had an impact on our findings. The administration of epostane appears to alter the normal surge in endogenous glucocorticoids in a species-specific manner. For example, epostane did not significantly alter maternal cortisol concentrations in pregnant rhesus monkeys or human pregnancies, but reduced maternal cortisol concentrations in pregnant rats.Reference Creange, Anzalone, Potts and Schane 42 , Reference Pattison, Webster, Phipps, Anderson and Gillmer 43 In sheep of similar gestational age to those in this study, antenatal maternal epostane administration has been shown to result in an initial drop in both maternal and foetal cortisol concentrations; however, by 27–30 h after administration, foetal cortisol concentrations had recovered and a prepartum rise similar to that which occurs with spontaneous labour was seen.Reference Silver 16 These data suggest that, although we did not measure maternal or foetal cortisol concentrations, in the NG-Prem group, effects of endogenous cortisol are likely to have been similar to that seen in spontaneous labour. In contrast, dexamethasone results in significantly elevated glucocorticoid potency in the fetus, and this could be responsible for the effects seen. For example, advanced maturation of the pancreas could conceivably protect the β-cell from effects of preterm birth, and the known growth-inhibiting effects of glucocorticoids may explain the faster growth seen in the first week after birth in the NG-Prem group compared with the G-Prem group.
It remains to be determined whether the effects reported in this study were due to preterm birth itself, change in endogenous cortisol levels, a direct action of epostane or to interference with pregnenolone to progesterone conversion and its consequent effect on development; therefore, the findings reported here need to be interpreted with caution.
An additional significant limitation is the fact that the NG-Prem group was not contemporaneous with the previous G-Prem and Term groups. While all efforts were made to keep the care of the animals, and investigational and analysis methods the same, it is possible that uncontrolled variables, such as different lambing seasons, may have affected the results. The observations reported in the current study would have been more impactful if the three groups were raised contemporaneously. In its current form, these findings should be regarded as hypothesis generating, and further research that follows the ARRIVE guidelinesReference Muhlhausler, Bloomfield and Gillman 44 is needed to determine the effect of exogenous glucocorticoids on pancreatic and hepatic development.
In conclusion, our findings show that preterm birth induced with epostane and without exogenous glucocorticoids accelerates growth velocity, increases body weight and increases baseline glucose concentration until post-puberty, significantly reduces β-cell mass and alters pancreatic gene expression until young adulthood in sheep, but has relatively few effects in the liver. These findings suggest that the use of AEG in mothers at risk of preterm birth may help protect the offspring from adverse effects of preterm birth on glucose–insulin axis function.
Supplementary material
To view supplementary material for this article, please visit https://doi.org/10.1017/S2040174419000916
Acknowledgements
The authors wish to thank Maggie Honeyfield-Ross and Travis Gunn for their assistance in caring for the sheep, Eric Thorstensen, Chris Keven and Satya Amirapu for their assistance with the laboratory work and Alana Cavadino and Greg Gamble for biostatistics input.
Financial Support
This study was supported by grants from the Health Research Council of New Zealand, Auckland Medical Research Foundation, Gravida: National Centre for Growth and Development, Lottery Health, University of Auckland Doctoral Scholarship and the Royal Australasian College of Physicians.
Conflicts of Interest
The authors have nothing to disclose.
Ethical standards
The University of Auckland Animals Ethics Committee approved all experiments.


