


1. Introduction
Coal-fired power plants contribute significantly to greenhouse gases and local air pollution (World Bank, 1997; Lopez et al., Reference Lopez, Zuk, Garibay, Tzintzun, Iniestra and Fernandez2005; International Energy Agency, 2012; Sueyoshi and Goto, Reference Sueyoshi and Goto2015). Although carbon dioxide from different locations contributes to greenhouse gases uniformly, the adverse effect of local pollutants on human health (e.g., Chay and Greenstone, Reference Chay and Greenstone2003; Neidell, Reference Neidell2004; Currie and Neidell, Reference Currie and Neidell2005; Coneus and Spiess, Reference Coneus and Spiess2012; Chen et al., Reference Chen, Ebenstein, Greenstone and Li2013; Luechinger, Reference Luechinger2014; Tanaka, Reference Tanaka2015; Ebenstein et al., Reference Ebenstein, Fan, Greenstone, He and Zhou2017) and economic activities (e.g., Ho and Nielsen, Reference Ho and Nielsen2007) depends highly on the spatial distribution of emission sources (Zhou et al., Reference Zhou, Levy, Evans and Hammitt2006; Greco et al., Reference Greco, Wilson, Spengler and Levy2007). This implies that, holding total emissions unchanged, changing the spatial distribution of coal-fired power plants could reduce the health damages caused by air pollution. That is, it is possible to reduce the harm from power plants’ emissions without harming the growth of an economy if a method can be identified to shift the location of power plants. In light of the fact that China accounts for half of the world's coal consumption (BP, 2016) and uses half of that coal to generate electricity (International Energy Agency, 2014), this paper investigates the spatial distribution of coal-fired power plants in China and identifies the factors driving the distribution.
A large literature, both theoretical and empirical, studies the factors that potentially affect an industry's location. This literature can be divided into three main categories: the factor abundance hypothesis, new economic geography, and the pollution haven hypothesis. (1) The factor abundance hypothesis, pioneered by the Heckscher-Ohlin (HO) and Heckscher-Ohlin-Vanek (HOV) models, generally finds the importance of factor endowment in determining a country's production and export structure as well as an industry's location (Bowen et al., Reference Bowen, Leamer and Sveikauskas1987; Davis et al., Reference Davis, Weinstein, Bradford and Shimpo1997; Romalis, Reference Romalis2004; Gerlagh and Mathys, Reference Gerlagh and Mathys2011; Michielsen, Reference Michielsen2013). (2) New economic geography studies how economies of scale, transaction costs, and other geographical factors affect the spatial agglomeration of economic activities (Fujita, Reference Fujita1988; Krugman, Reference Krugman1991; Wen, Reference Wen2004). Some empirical studies combine the factor endowment hypothesis with new economic geography to investigate the determinants of firm location in practice (Ellison and Glaeser, Reference Ellison and Glaeser1999; Midelfart-Knarvik et al., Reference Midelfart-Knarvik, Overman, Redding and Venables2000; Crafts and Mulatu, Reference Crafts and Mulatu2005; Gutberlet, Reference Gutberlet2012). (3) The pollution haven hypothesis emphasizes the effect of environmental regulation, among other factors, on industries’ location choices. A large empirical literature tests the existence of the hypothesis (e.g., Jaffe et al., Reference Jaffe, Peterson, Portney and Stavins1995; Becker and Henderson, Reference Becker and Henderson2000; List and McHone, Reference List and McHone2000; Greenstone, Reference Greenstone2002; Jeppesen et al., Reference Jeppesen, List and Folmer2002; Kanbur and Zhang, Reference Kanbur and Zhang2005; Taylor, Reference Taylor2005). Although the findings are mixed, the baseline is that stringent environmental regulation does play a role in the location choices of highly polluting industries.
Most of the literature mentioned above, however, focuses on developed countries. Little attention is paid to developing countries and in particular to the site decisions of coal-fired power plants. In China, electricity generated by coal is above 70 per cent of the total electricity generation (China Energy Year Book, 2013). Because of the massive use of coal for electricity generation, many cities in China are experiencing severe air pollution and policy makers are faced with the difficult task of mitigating air pollution while supporting economic growth (World Bank, 1997). However, the harm from the pollution varies across regions with different environmental capacity and population density (Ho and Nielsen, Reference Ho and Nielsen2007). Therefore, it is important to look into the spatial distribution of coal-fired power plants in China and the driving factors behind the distribution.
The location choices of coal-fired power plants in China could differ from those in developed countries, which are market economies. In China, the electricity prices received by power firms are set by the central government and vary across provinces, and the utilization hours of power plants are allocated by the provincial government. This means that a power plant in China chooses price and potential utilization hours through location choice, instead of through production behavior, as in a market economy. Therefore, this paper also contributes to the literature by investigating how an industry's spatial distribution is affected by output prices and production quotas that are set by the government, in contrast to results based on market economies.
In addition, coal-fired power competes with other types of energy generation, especially with hydro and wind energy in recent years in China. Understanding the location choice of coal-fired power plants may shed light on the renewable energy layout and curtailment problems. In China, wind and solar capacities have increased dramatically in recent years, due to government subsidization. Provinces where both renewable and coal-fired power capacities have increased dramatically run into the problem of curtailing wind and solar and the decrease in utilization hours for coal-powered plants. To solve this problem, we need to understand the location choices for all types of electricity generation. This paper studies the location choice of coal-fired power plants as a start.
We first build a dataset of provincial capacity of coal-fired power plants from 1998 to 2011. We then merge the dataset with location-specific characteristics, such as coal reserves, GDP per capita, population, grid coverage, transportation capacity, electricity price, utilization hour quota, environmental regulation, and other power generation. With the provincial panel data, we look into the spatial distribution of power plants and empirically analyze the factors that drive this distribution. We also consider the effects of interprovincial trade of coal and electricity.
We find that coal-fired power plants generally concentrate in the areas with large electricity markets. We also find that some provinces with abundant coal reserves had capacity leaps in recent years; the reason could be the development of the electricity grid. Furthermore, we find that a power plant reacts to utilization hours, but not to electricity prices. These findings imply that one way to shift coal-fired plants to areas with abundant coal resources but less population could be to encourage the construction of a trans-province electricity grid and the establishment of a trans-province electricity market. Furthermore, when considering competition from energy markets and coal markets, coal power plants are less likely to be located in areas with a lot of hydro power or in areas surrounded by neighbors with high coal or electricity demand. In addition, we do not find a significant effect of environmental regulation on coal power firms’ location choice.
The remainder of the paper is organized as follows. Section 2 introduces the evolution of air quality in China and the framework of location decisions for coal-fired power plants. Section 3 looks into the evolution of power plants’ spatial distribution and graphically investigates potential factors behind the distribution. Section 4 uses econometric models to formally investigate the correlation between the factors and the installed power capacity. Section 5 concludes.
2. Background
2.1 Air pollution and power plants in China
Power generation in China relies heavily on coal consumption, which has become one of the major sources of air pollution in China. From the evolution of the spatial distribution of coal-fired power plants and air pollution, we observe that the areas with high capacity of coal power plants are also the areas with low air quality.
Looking into the spatial distribution of coal-fired plants in 1998 and 2011 shown in figure 1, we find that coal-fired plants were concentrated in the coastal areas in 1998. The capacity in Guangdong was more than 15 gigawatts (GW), followed by Shandong and Jiangsu, each with capacity over 10 GW. By contrast, the capacity in most central and northwestern provinces was less than 5 GW. Capacity grew significantly during the period from 2008 to 2011 for all provinces, except for Tibet and Qinghai. In 2011, coal-fired power plants were still concentrated in coastal areas, where the average capacity was above 40 GW. Large growth in capacity was also seen in some inland regions such as Inner Mongolia, Shanxi and Henan, which are all abundant in coal. Their capacities in 2011 were more than 40 GW, the same magnitude as coastal areas in the same year.
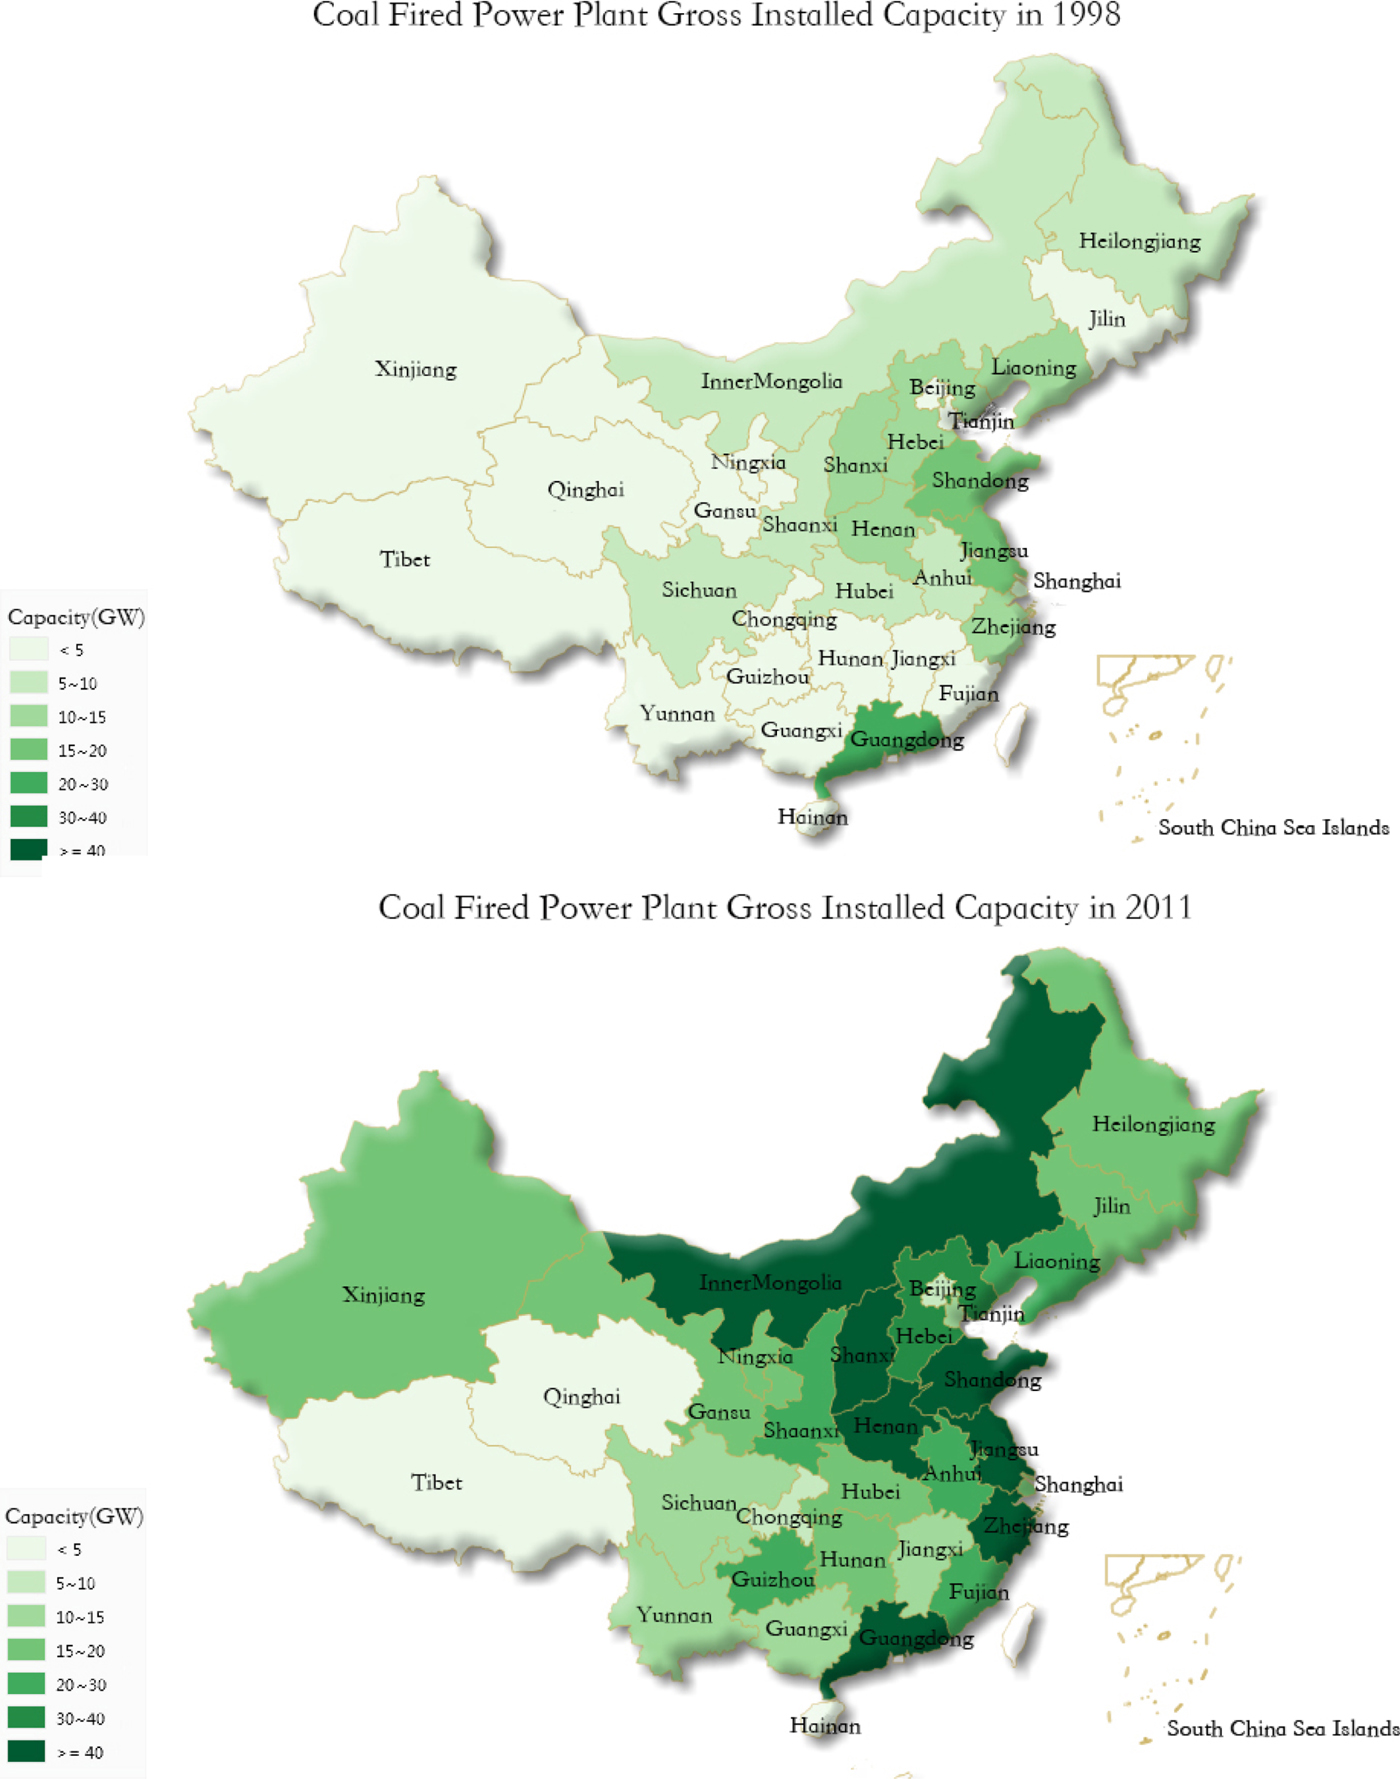
Figure 1. Gross installed capacity of coal-fired plants at province level in 1998 and 2011.
PM2.5 and SO2 are among the major emissions from coal combustion. NOx emitted from coal combustion also contributes to the formation of secondary particulate matter. Looking into the average concentration of PM2.5 and SO2 of each province in 2000 and 2010 (see the four panels in figure A1 in the online appendix), we find that the PM2.5 concentration substantially increased over the ten years, with an increase from 42 ug/m3 in 2000 to 65 ug/m3 in 2010 on average. Most of the areas which experienced large growth in power capacity also suffered from deteriorating air quality. For example, the coastal areas, including Shanghai, Jiangsu and Zhejiang, all experienced large increases in PM2.5 concentration during this period, an average increase of 65 per cent over 2000; the Jing-Jin-Ji region (including Beijing, Tianjin and Hebei) has the highest PM2.5 concentration level, higher than 100 ug/m3 in 2010 on average, which is almost 10 times the WHO air quality standard of 10 ug/m3. A similar pattern can be found for SO2 as well; the Jing-Jin-Ji region and the coastal area had the highest concentration of SO2 in 2000 and the largest increase in SO2 in the period 2000–2010.
The most obvious exception is Inner Mongolia, which experienced a large increase in coal power capacity, while air pollution at the province level remained low. The possible explanations include that, given the large area of this province, the intensity of power capacity is low; given the relatively low level of its economic development, the environmental capacity in Inner Mongolia is large. This suggests that shifting coal power capacity to those areas may be a way to reduce the harm of air pollution. But what policies or measures can attract coal power plants to those areas? In this paper, we analyze the location choice of coal power plants and the driving factors behind the location choice.
2.2 Location choice of coal-fired power plants
In 2002, China adopted a power industry reform with the purpose of encouraging the construction of power plants to alleviate the shortage of power supply. Before the reform, power generation, dispatch, transmission and sales were integrated. They were planned by the central government and executed by the Ministry of State Electric Power Industry before 1998 and the State Power Corporation between 1998 and 2003. The 2002 reform separated power generation from power dispatch, transmission and sales. The State Power Corporation was divided into the State Grid Corporation and the Southern Grid Corporation and generation firms were formed. Since then, the location choices of plants have been made by the generation firms. Meanwhile the government set electricity prices, which vary across provinces and are adjusted by the government annually. The government also allocates utilization hours across plants every year.Footnote 1 Therefore, resource endowment, market factors, and political factors all could have played a role in shaping the spatial distribution of power plants in China.
A location choice can affect a power plant's expected profit by affecting production costs. Transportation cost is one of the main costs. According to a report by the China Logistics Information Center, in 2011, about 60 per cent of coal consumed in China was transported by rail, and, in some provinces, the transportation cost for coal amounted to about 40 per cent of the retail price of coal. To save transportation costs, a firm may choose to build a plant close to coal resources. Besides transportation costs, transmission costs also could be high in some cases. In areas where grid coverage is low, connecting a large-capacity power generator to a grid usually involves extension or upgrade of the grid, which could be very costly in time and money. To be connected to the grid, a firm needs to apply to the power grid company, which owns the grid in this area. Then, the firm either waits for the power line to be built by the grid company or builds the line by itself, in which case the grid company provides design diagrams, approves the construction before acceptance, and purchases back the line. The first case involves a large time cost. In the second case, a firm may need a loan and therefore may face a liquidity constraint or a large amount of interest before the purchase back; even without a loan, there is forgone interest as an opportunity cost. To avoid such costs, a firm may want to build a plant where the grid coverage is more extensive. In sum, as proposed by the factor abundance hypothesis and new economic geography, a firm builds a plant in an area with abundant coal to save on transportation costs or in an area close to market to save on transmission costs. The firm must make tradeoffs if the two areas do not coincide, which is the case in China (see the two panels in figure A2 in the online appendix).
A location choice can also affect a power plant's profit by affecting electricity price and quantity of production, i.e., utilization hours. In China, electricity prices are set by the government, under rules that have been evolving. Before 2004, the operation period price policy set the electricity price for each power plant, with the aim of securing a certain investment return rate. Therefore, plants with different construction costs had different prices. After 2004, a benchmark price policy replaced the operation period price policy and set electricity prices based on the average construction cost of all plants in the same province. Since then, the electricity prices received by plants have varied at the province level, rather than the plant level. The utilization hours are allocated by the provincial government, involving the following steps: the power plant files an application, the local grid company adjusts hours based on safety and dispatch capability, and the local government approves the hours. Before 2006, the allocation rule essentially was to divide hours equally across plants. In 2007, the State Council issued the ‘Announcement of Energy Saving Generation Dispatch’ to give generation priority to those plants that are more efficient and less polluting. In general, in a province with a higher quota of hours and fewer firms, each firm is likely to get more hours, compared to a province with a lower quota or more firms.
Competition from other types of electricity generation affects the utilization hours that a coal-fired power plant can get, and therefore affects a power plant's location choice. In China, coal and hydro are the two major resources for electricity generation. Before 2011, their installed capacities accounted for about 75 per cent and 22 per cent of the total capacity, respectively. Wind and solar capacities have increased dramatically in recent years, but they accounted for only 4.35 and 0.20 per cent, respectively, of the total installed capacity in 2011 (data source: Compilation of Statistical Materials of Electric Power Industry). Therefore, the competition for utilization hours is largely between coal-fired power and hydro power in the period studied in this paper. Due to this competition in provinces rich in hydro power resources (e.g., Sichuan province), coal-fired power capacity tends be smaller, holding other factors constant.
Environmental regulation can have an impact on a coal-fired plant's location choice as well, since pollution abatement has costs. To reduce abatement costs, a firm generally tends to choose areas where the environmental regulations are less stringent. In China, the environmental regulations on coal-fired power plants are the same across provinces, but the enforcement of the regulations varies (Dasgupta et al., Reference Dasgupta, Laplante, Mamingi and Wang2001; Zhang et al., Reference Zhang, Zhang and Zhang2010). In the areas with poor enforcement, polluting firms face a smaller chance of being caught. That is, in those areas, they pollute at a lower expected cost. However, the areas with poor enforcement tend to have lower institutional quality, which could lead to other costs, such as bribery being ‘a must’ to get things done. Therefore, it is ambiguous whether a firm prefers an area with less corruption or an area with less stringent environmental enforcement.
Finally, neighboring provinces’ coal resources and market size may also affect a coal plant's location choice. A firm may prefer a province whose neighboring provinces have abundant coal, because it means the firm has access to more coal reserves through trade. However, these provinces also face direct competition from their neighbors. Whether neighbors’ coal reserves discourage or attract firms depends on which effect dominates. The same logic applies to the size of the electricity market as well.
In sum, the factors that potentially impact the spatial distribution of coal-fired power capacity in China include coal endowments, market size factors, electricity prices, the utilization hour quota, other energy generation, environmental regulation and its enforcement, and neighboring provinces’ coal reserves and power demand.
3. Data and graphic analysis
In this section, we first look into the spatial distributions of coal-fired power capacity over the years and then investigate the driving factors discussed above. We collect province-level data from various sources, starting in the 1990s and continuing through 2011. We describe the data in detail below and summarize them in table 1.
Table 1. Summary statistics

Notes: Data sources: (1) Compilation of Statistical Materials of Electric Power Industry. (2) China Statistical Yearbook, (3) China Statistical Yearbook on Environment. (4) China Energy Statistical Yearbook. (5) Calculated. Number of observations: 30 provinces (including municipalities directly under the central government and autonomous regions) are included. Lacking data, Hong Kong, Macao, Taiwan, and Tibet are excluded; years from 1998 through 2011 are covered, except that data before 2003 are not available for coal resources, investment on power grid, water, and variables calculated from them. (6) The Market Index of China. (7) Calculated from variables above.
3.1 Spatial distribution of power capacity
Data on coal-fired power capacity are collected from the Compilation of Statistical Materials of the Electric Power Industry (1998–2011), which includes coal-fired power plants with capacity above 6000 kilowatts (KW).
Figure 2 illustrates the capacity trajectory of each province since 1998. Four features are observed. First, the capacity in all provinces at least doubled from 1998 to 2011, although the increase in capacity varies across provinces. Second, all provinces had slow growth in power capacity before the power industry reform in 2002. Third, with the reform, the more-developed provinces experienced a greater increase in capacity. The unbalanced development in capacity further widened the gap between the leaders in both economic development and power capacity and the other provinces. Last, Inner Mongolia, which was less economically developed but has abundant coal, experienced the most dramatic increase in installed capacity, from 7.7 GW in 1998 to 59.6 GW in 2011, and became the third largest province in capacity in 2011, slightly less than Jiangsu and Shandong. These features, observed in figure 2, imply that the power demand due to economic growth may have consistently driven the increase in power capacity, while some other factors, such as coal endowments, may also have played a role.
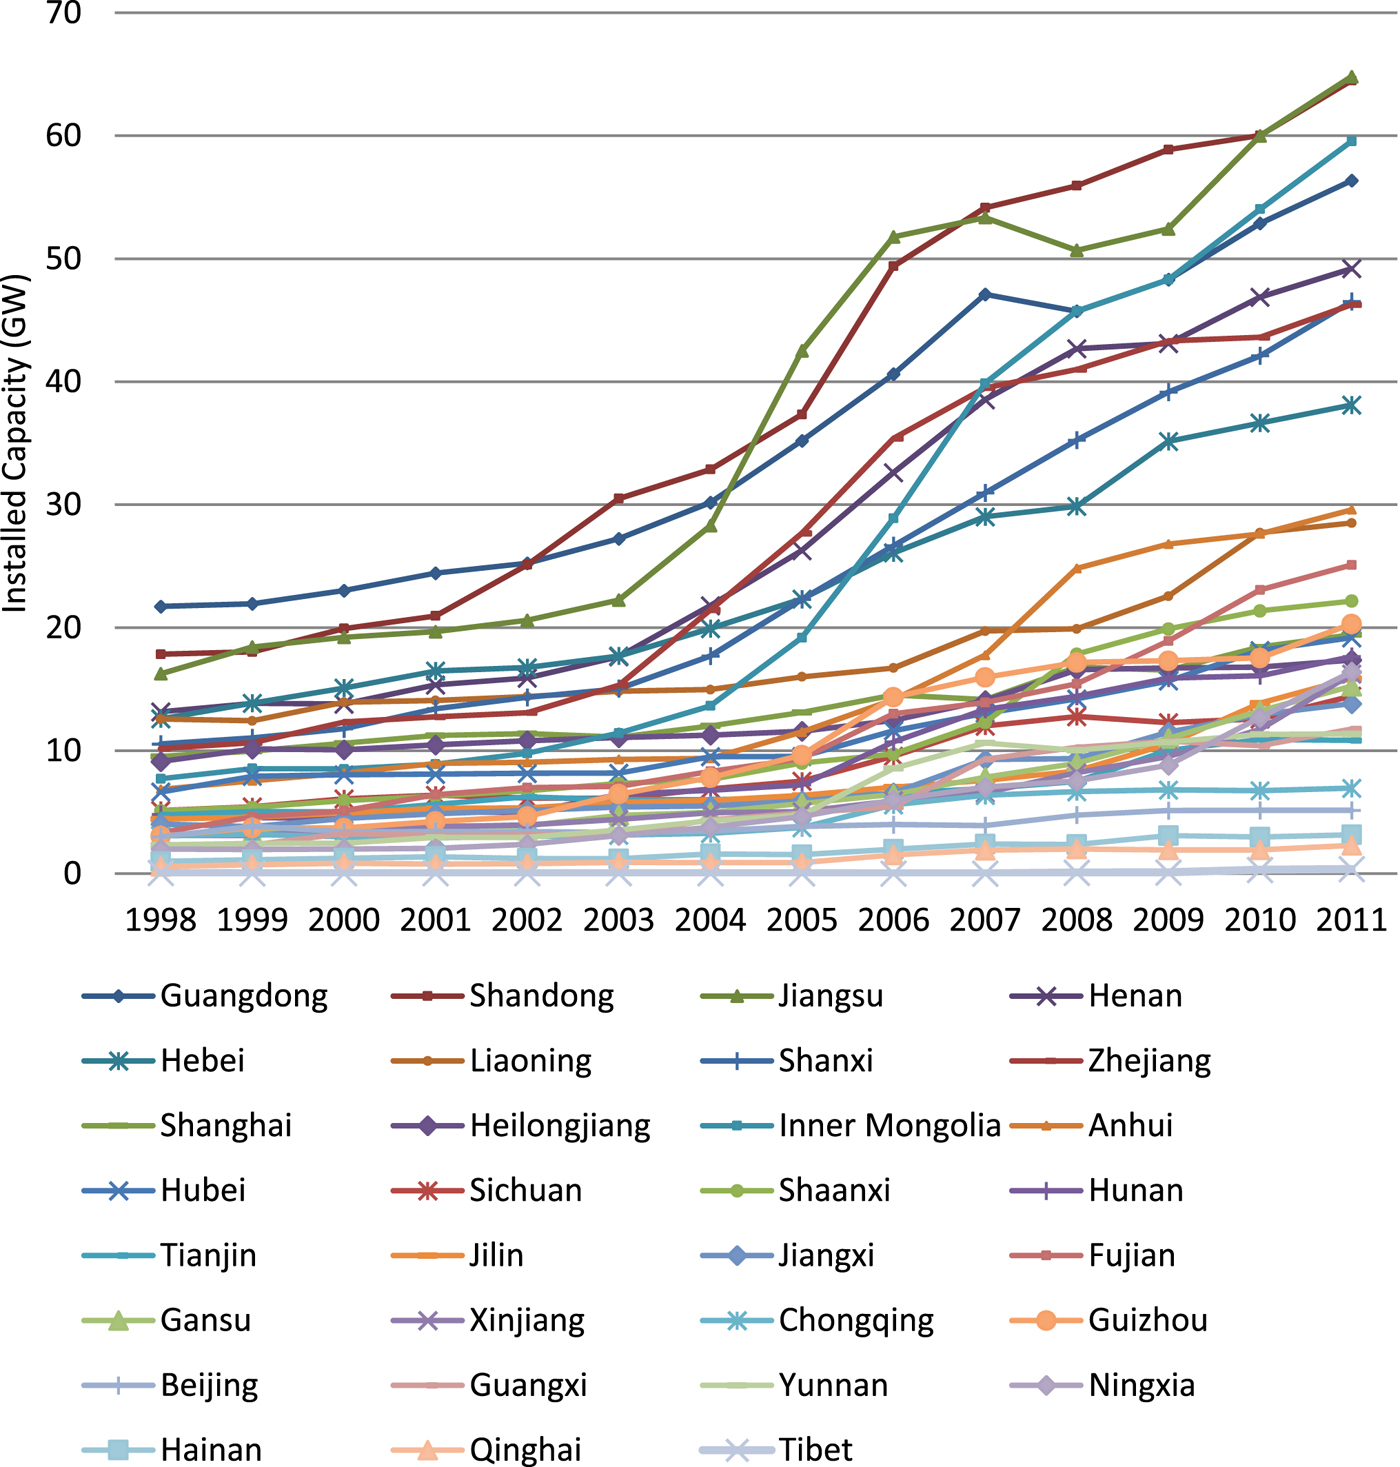
Figure 2. Provincial trajectories of power capacity from 1998 through 2011.
3.2 Factor endowment
3.2.1 Coal
We proxy a province's factor endowment by its coal reserve. Data on coal reserves are collected from the China Statistical Yearbook from 2003 through 2011. Before 2003, only national coal reserve data are available.
Figure 3 compares the provincial coal reserves and the gross capacity of coal-fired plants in 2011. The provinces are ordered based on the quantity of coal reserves. Inner Mongolia and Shanxi are the top two in coal reserves, while they are also among the top in power capacity in 2011. However, the positive correlation of coal reserves and power capacity is not clear for other provinces. For example, coal reserves in Zhejiang, Guangdong, and Shanghai are low, but power capacity is high. Notice that these provinces have a high level of economic development, and therefore a high demand for power. This suggests that, besides coal endowment, proximity to markets may be another driving force for the development of coal-fired plants. We will investigate market factors in the next subsection.

Figure 3. Coal-fired power capacity and coal reserves at province level in 2011.
To further investigate the correlation between coal reserves and installed capacity, using data in all years (2003–2011), we depict the scatter points and fitted lines of coal reserves and coal-fired power capacity (see panel A in figure A3 in the online appendix). We find that the slope of the annual fitted lines increases over the years. The slope is 0.048 in 2003 and not statistically significant, while it is as large as 0.41 in 2011 and statistically significant at the 5 per cent significance level. The reason could be that the provinces with abundant coal, such as Shaanxi, Inner Mongolia and Shanxi, had more dramatic increases in power capacity in recent years.
3.2.2 Electricity grid
We have seen from figure 2 that power capacity in the provinces with abundant coal leaped in recent years. One simultaneous phenomenon is the extension of the power grid in those areas. To investigate the correlation between grid and capacity, we use investment in the power grid to proxy the development of the grid. Investment data are from the China Statistical Yearbook from 2003 through 2011. The statistical standards are inconsistent before and after 2003. Therefore, the investment data before 2003 are not used in this study. Investment is defined as the total investments in a year for maintaining or building the power grid and replacing grid-related equipment. To measure the grid coverage in a province in a certain year, we accumulate all the investments in the current year and the previous years. That is, for each year, we use cumulative investment to proxy the grid coverage, and annual investment to proxy the grid development year.
We depict the scatter points of grid coverage and power capacity (see panel B in figure A3). As we discussed above, we expect a larger effect of grid development in the areas with abundant coal but low grid coverage. In the plot, we therefore distinguish the three provinces with the largest coal reserves, which are Shanxi, Inner Mongolia and Shaanxi. The slope of the fitted line for the three provinces is much steeper than that for the other provinces, which confirms the hypothesis.
3.3 Economic geographical factors
3.3.1 Market size
In determining the location of industries, the presence of transaction costs (e.g., high transmission costs induced by the low coverage of the electricity grid) means that the demand side matters and that geographical factors come into play. In this section, we focus on the geographical distribution of demand and use the size of the electricity market to proxy it.
There are different ways to measure the size of the electricity market. Electricity consumption is a direct measurement; GDP per capita reflects the overall level of economic development, which demands energy; population reflects the size of the potential market. We collect electricity consumption data from the China Energy Statistical Yearbook, and obtain GDP and population data from the China Statistical Yearbook. The data show that there are strong correlations between capacity and electricity consumption (correlation coefficient = 0.92), capacity and population (correlation = 0.56), and capacity and GDP per capita (correlation = 0.85). The latter two correlations are weaker, because GDP per capita and population size work together to determine the electricity demand.
3.3.2 Coal transportation cost
A positive correlation between capacity and market size means that capacity concentrates in the areas with larger markets, which are areas far from coal. Therefore, coal transportation cost comes into play.
We use rail coverage to proxy coal transportation cost, because provinces with extensive rail coverage are expected to have lower transportation costs. We collect yearly rail mileage data at the province level from the China Statistical Yearbook. The data show that, as expected, capacity and railway mileage is positively correlated (correlation coefficient = 0.37).
3.4 Electricity price and utilization hours
3.4.1 Electricity price
Electricity price data are collected from the website of the National Development and Reform Commission, which adjusts the benchmark price. As shown by the data, the electricity price varies across provinces, with the highest (over 500 yuan per thousand kilowatt hours) in Guangdong in 2011, and the lowest (below 250 yuan) in Gansu in all years. Despite the large variation across provinces, the price trajectories in all provinces have the same pattern. The price increases gradually every year, with the largest increases in 2008 and 2011. The only exception is Inner Mongolia, where the price dropped in 2007.
Putting together the electricity price data and the capacity data, we see that power capacity is positively correlated with benchmark price (correlation coefficient = 0.37), indicating that areas with higher prices have more power capacity. However, we cannot yet conclude that capacity reacts to price, because areas with higher prices are also the areas with larger demand (the correlation between price and GDP per capita is 0.34). We therefore adopt a regression method in the next section to distinguish the roles of price and demand.
3.4.2 Utilization hours
Data on firm-level utilization hours are collected from the Compilation of Statistical Material of the Electric Power Industry from 1995 through 2011, in which 1996, 1999, and 2001 are missing. All coal-fired power plants with installed capacity of more than 6 MW are included. We use the median of firm-level utilization hours to proxy the expected production quota. We choose median rather than mean to alleviate the influence of outliers. The data show that average and median utilization hours are different, but the difference remains stable. Utilization hours go up and down over the years and vary dramatically across provinces. The standard deviation ranges from 742 in 1998 to 1303 in 1995. Most provinces remain above 4000 h for all the years, while Guangxi remains below 3,000 h for most of the years.
To avoid the problem of reverse causality, in which increases in capacity lead to lower average utilization, we use utilization hours in the last year (or the year before the last year if last year's data are missing) The data show that power capacity and the lagged utilization hours are slightly correlated (0.07). Whether this correlation indicates that capacity reacts to utilization hours will be investigated by regressions in the next section.
3.5 Environmental regulation, energy generation competing with coal, and interprovincial trade of coal and electricity
In China, environmental regulation of firms is the same across provinces, as long as these firms are in the same industry. However, the enforcement of the regulations can be very different. It depends on the institutional quality of the local and provincial governments, which we measure by the index of institutional quality and legal environment from the report on the process of marketization in China by Fan et al., (Reference Fan, Wang and Zhu2011). The greater the index is, the higher the institutional quality is (more information about the index is available in appendix B of the online appendix). We use this index to proxy the enforcement of the regulations. If the pollution haven hypothesis holds, we expect to see fewer firms in the provinces with a higher index. However, the index also reflects the corruption level of the governments. We expect firms to prefer both looser enforcement of regulations (lower index value) and a lower corruption level (higher index value). Therefore, the predicted coefficient of the index is ambiguous. It depends on which of the two opposite effects dominates. As we will see below, the two effects tend to cancel out.
To measure the competition from hydro power, we collect data on the hydro resources of each province, from the China Statistical Yearbooks. The data show that coal-fired power capacity and hydro resources are negatively correlated, implying that areas with more hydro tend to have less coal-fired power capacity. We are also aware that in China, areas with more hydro are usually the areas that are less developed or have less coal, such as Sichuan, Yunnan, Guizhou, Guangxi, etc. Therefore, we employ a multiple linear regression in the next section to disentangle the effects of market demand, coal resource and hydro resource.
To show the effect of trade, we define a variable of neighbors’ coal reserve to proxy potential coal trade, and a variable of market size of provinces sharing the same area grid to proxy potential power trade. We use neighbor's coal reserve, instead of traded coal quantity of each province pair, because coal trade is a result of, not a cause of, a coal power firm's location choice. For power trade, there are five area grids in China and most interprovincial trade of electricity is within the area grid. So, we use the sum of GDPs of all provinces in the same area grid minus the GDP of the province of interest, to measure the potential market size of neighboring provinces. The data show that coal power capacity is positively correlated with neighbors’ coal reserves and with market size of provinces on the same grid.
4. Econometric analysis
In the previous section, we investigated the correlation between capacity and each of the potential driving factors. In this section, we employ a multiple linear regression to disentangle the contributions of the factors in shaping the spatial distribution of power capacity. In all regressions, we include year fixed effects to account for the effects of common shocks that are not captured by the control variables. We do not include province fixed effects, because we rely on the provincial variations to identify the effects of factors that vary across provinces but do not change much across years for the same province (e.g., coal reserves). That is, we choose ‘between estimator’ over ‘within estimator’ (more detailed information about the choice between ‘between estimator’ and ‘within estimator’ is available in online appendix C and online appendix table A1). Regression results are shown in table 2 for endowment and market factors, table 3 for electricity price, and table 4 for utilization hours.
Table 2. Effects of coal endowment and market factors on installed capacity of coal-fired power plants

Notes: Mixed OLS. All specifications have year dummies. Standard errors are clustered at the province level. *, **, *** represent 10%, 5%, and 1% significance level, respectively.
Table 3. Effects of electricity price on installed capacity of coal fired power plants

Notes: Mixed OLS. All specifications have year dummies and constants. Additional control variables include all the explanatory variables in table 2, column (6). Standard errors are clustered at the provincial level. * represents the 10% significance level. The complete table with all the estimated coefficients listed is available in online appendix table A2.
Table 4. Effects of utilization hours on installed capacity of coal fired power plants

Notes: Mixed OLS. All specifications have year dummies and constants. Additional control variables include all the explanatory variables in table 2, column (6). Standard errors are clustered at the provincial level. *** represents the 1% significance level. The complete table with all the estimated coefficients listed is available in online appendix table A3.
4.1 Factor endowment
We start with a regression with coal reserves as the only covariate, besides year fixed effects. As shown in table 2, column 1, the estimated coefficient is 0.18 and statistically significant; a one standard deviation increase in coal reserve (21.69 billion tons) leads to a 29 per cent standard deviation increase in capacity (0.18×21.69/13.428=0.29). However, the R square shows that only 19 per cent of the variation in capacity can be explained by the variation in coal reserve and time.
As we discussed in the last section, we expect an increase in power capacity when the electricity grid becomes more developed, especially in the areas with abundant coal but low grid coverage. We use cumulative investment in the grid to proxy grid coverage, and current investment to proxy grid development. We therefore expect a positive coefficient of both current investment and cumulative investment, and a negative coefficient of their interaction term. The regression results are the same as expected, as shown in table 2, column 2. The R-squared is 0.584, much larger than that of the first regression. This suggests that the development of the electricity grid is critical to the development of power plants.
4.2 Economic geographical factors
We add in power consumption, as a proxy of market size, in table 2, column 3. As expected, the coefficient of power consumption is positive and statistically significant. However, power consumption is the equilibrium quantity of the market, decided by factors from both the demand side (namely the potential market size) and the supply side (namely the capacity of all power plants) simultaneously. We therefore use GDP per capita and population size, instead, to measure the potential market size in the following regressions.
As shown in table 2, column 4, the coefficients of both GDP per capita and population are positive and statistically significant at the one per cent significance level. R-squared is 0.58. These results indicate that market size is an important factor that drives the location choice for coal-fired plants.
Locating close to markets, however, may result in higher coal transportation costs because areas with abundant coal are usually far away from areas with a large market. Greater rail coverage may decrease coal transportation costs, and this lower cost attracts firms. We therefore expect greater capacity in provinces with greater rail coverage. In column 5 of table 2, we add in rail coverage and indeed get a positive and statistically significant estimate of the coefficient of rail coverage.
In column 6 of table 2, we include all the variables that represent factor endowment, market size, and possible constraints (electricity grid and rail coverage) to reflect their comprehensive effects. Compared to column 3, the effects of coal reserves and cumulative investment in the power grid remain statistically significant, although their magnitudes decrease. A possible reason is that annual investment in the power grid is highly correlated with GDP per capita. As for market size, the effect of per capita GDP, the effect of population size, and the effect of rail coverage also remain statistically significant, although their magnitudes decrease. The R-squared in this regression is much higher than in the regressions in columns 2 and 5, which separately consider endowment factors and market factors. These results indicate that both factor resources and market size are important factors in location choices for coal-fired power plants; their effects, however, are constrained by other factors such as electricity grid coverage and rail coverage.
4.3 Electricity price
In table 3, we investigate the effect of electricity price on the spatial distribution of coal-fired plants. First, we regress power capacity on electricity price only – current price in column 1, last year's price in column 2, and average price over time in column 3. We have 240 price observations (30 provinces in eight years from 2004 through 2011), but only 210 price lag observations, because the first year's lag price data are missing. To make the regression results of the three price covariates comparable, we also drop the first year data for the regression of current price and that of average price over time. We find that the estimated coefficients of price variables are similar. This is expected, because as shown by the price data, the provincial prices have similar trajectories. So, we are comfortable in picking any of them and we use average price over time for the rest of the analysis. In column 4 of table 3, we put back the first year to make use of the full dataset, and the results remain stable. The coefficient is 0.077 and significant at the 10 per cent significance level. This indicates that the provinces with higher electricity prices do have larger coal-fired plant capacity.
Without controlling other variables, however, we can only interpret this result as a correlation. No matter whether a firm reacts to price or not, a positive correlation will be seen if the government sets the price higher in the provinces where the market is larger or the coal is abundant. We therefore add in endowment variables and market size factors in column 5 (table 3). We find that the estimated coefficient of price becomes much smaller and not significant. This suggests that the firms do not actually react to the exogenous and stable electricity prices; they build plants where there is a large market or abundant coal.
4.4 Production quota
In table 4, we investigate how expected utilization hours affect a firm's location choice. We use median utilization hours over all plants in the same province in the last three years to proxy the expected utilization hours. We use lagged hours to avoid the reverse causality that a leap in capacity leads to lower average utilization hours, holding demand constant. We use three lags because it usually takes 18 to 30 months (roughly one to three years) for a coal-fired power plant to complete the construction and start production.
In column 1 of table 4, we regress capacity on lagged hours only, and we find that the coefficients are small and not statistically significant. One thousand more utilization hours (more than one standard deviation more hours) only lead to one gigawatt more installed capacity (less than ten per cent standard deviation more capacity).
Utilization hours are also correlated with demand and possibly other factors, so we add into the regression all the factors we discussed earlier. We are aware that adding all variables will lose sample size. To eliminate the impact of sample size, we restrict the regression in column 2 to the same sample as column 3, which includes all the variables. Column 2 shows that sample size has little impact on the estimated coefficients of hours. Column 3 shows that utilization hours do have some impact on firms’ location choices – the coefficient of hours in the two years before the last year is statistically significant. However, the magnitude is not economically significant – one standard deviation more utilization hours leads to only 14 per cent of a standard deviation more capacity installation.
4.5 Environmental regulation, hydro generation, and interprovincial trade
In table 5, columns 1 through 3, we investigate how environmental regulation affects the location choice of coal-fired power plants. In column 1, we replicate the main regression, which is the same as the one in table 4, column 3. In column 2 of table 5, we add the variable of the index of institutional quality, discussed above. We find that the coefficient is 0.007. This shows that a one standard deviation increase in the index (3.45) is associated with 0.024 GW increase in coal-fired power capacity (calculated as 0.007 × 3.45), which is about a 0.1 per cent increase. This estimate is neither economically nor statistically significant. It suggests that the corruption effect and pollution haven effect offset each other. In addition, we notice that the coefficients of other variables change. For example, the variable of GDP per capita decreases by half and becomes insignificant. This is due to the change of sample size, resulting from the missing data of the index of institutional quality variable. In column 3, we run the same regression as in column 1, using the same sample as in column 2. The results from columns 2 and 3 are similar. This confirms that it is the sample selection that leads to the change of coefficients and significance.
Table 5. Effects of environmental regulation, hydro generation, and interprovincial trade

Notes: Mixed OLS. All specifications have year dummies. Standard errors are clustered at province level. *, **, *** represent 10%, 5%, and 1% significance level, respectively.
In table 5, column 4, we investigate how hydro power competes with coal power. The coefficient of surface water is negative and statistically significant. This means that there are fewer coal power firms in areas with a larger amount of surface water. It implies competition between hydro and coal-fired power generation. After adding the hydro variable, the regression results remain stable, except that the coefficient of GDP per capita decreases by half and is not statistically significant. The possible explanation is that hydro and GDP per capita are negatively correlated (correlation coefficient = 0.31). In China, water resources are concentrated in the southwest, such as Sichuan and Yunnan provinces, while the GDP per capita is relatively low in those areas.
In table 5, columns 5 and 6, we investigate how the interprovincial trade of coal and electricity affects the location choice of a coal-fired power firm. The regression coefficients of the neighboring provinces’ coal resources and grid demand are both negatively and statistically significant. This indicates that the competition effect dominates; coal-fired power firms are less likely to choose provinces whose neighbors are better off in terms of coal reserve and market size.
5. Conclusion
In this paper, we investigate the spatial distribution of coal-fired power plants in China and the potential driving factors, which include coal endowment, market size factors, electricity prices, utilization hours, environmental regulation, and competition from other power generation. We also consider the effects of neighboring provinces’ coal endowment and market size on the location choices of the coal power plants.
We find that, in China, coal-fired power plants are located in the areas where the demand is greater, especially in the earlier years of our sample. Although these areas are far from where the coal is, a developed railway system in China ensures that coal transportation cost is lower than the cost of electricity grid expansion. With the development of the electricity grid in areas with abundant coal, power plants started to locate in coal-rich areas, thus saving transportation costs, now that power transmission costs are dramatically lowered by the grid expansion. We also find that, when choosing location, firms do not react to electricity prices, which are set by the government, are stable over the years, and vary across provinces. However, firms do react to production quota, i.e., allowable utilization hours. Furthermore, we find that coal-fired power plants tend to avoid competition from other power generation by investing in areas with less hydro, and that they are likely to be deterred by neighboring provinces’ coal endowment and power demand. In addition, we do not find that plants react to different levels of stringency in enforcement of environment regulations; the possible reason is that stringent environment regulation is accompanied by high institutional quality.
These findings have important policy implications for reducing the harm caused by power generation without harming the economy. Air pollution has larger adverse effects in the areas with large markets, because in those areas population density is high and the scale of economic activities is large. By contrast, the areas with abundant coal are usually less developed areas, with lower population density. This implies that one way to reduce the harm of air pollution is to shift power plants from where the market is to where the coal is. By identifying the factors driving the choice for location of coal-fired plants, this paper suggests that such a shift could be induced by lowering the transmission costs for plants built in the areas abundant in coal and increasing their utilization hours. The measures to achieve this goal may include encouraging the construction of a trans-province electricity grid and the establishment of a trans-province electricity market.
Finally, there are some caveats on the environmental implications of the policies mentioned above. First, the emissions from coal-fired power generation vary across plants, mainly because of variation in emission control technologies (He et al., Reference He, Yan, Lei and Wang2015) and the enforcement of regulations. Thus, to reduce the harm to human health from coal burning by shifting power plants, it is important to implement the same standard for emission control technologies and require the same enforcement of regulations throughout the country. Second, although shifting polluting sources to less populated areas would reduce the total exposed population and therefore reduce the overall harm to human health, from the perspective of a province the increase in capacity means both economic growth and increase in pollutants; the provinces into which the capacity shifts would be faced with the tradeoff between economic growth and pollution. Therefore, in future work, it will be important to study the distributional effect of such capacity shifts and to find the policies needed to enhance economic growth and at the same time alleviate the harm from pollution.
Supplementary material
The supplementary material for this article can be found at https://doi.org/10.1017/S1355770X18000098
Acknowledgements
This work is supported by the Beijing Natural Science Foundation (9174037) and National Natural Science Foundation of China (71703163).


