


INTRODUCTION
Parasite ecologists strive to detect patterns in parasite communities that are repeatable in space and time, in order to understand the processes that structure parasite communities and because of the implications for the dynamics of host-parasite interactions (Poulin, Reference Poulin2007; Behnke, Reference Behnke2008; Kennedy, Reference Kennedy2009). By and large, macroparasite communities across the same host species are spatially and temporally variable, with little repeatability of patterns (Poulin and Valtonen, Reference Poulin and Valtonen2002; Krasnov et al. Reference Krasnov, Shenbrot, Mouillot, Khokhlova and Poulin2005; Behnke et al. Reference Behnke, Bajer, Harris, Newington, Pidgeon, Rowlands, Sheriff, Kuliś-Malkowska, Sinski, Gilbert and Barnard2008; Thieltges et al. Reference Thieltges, Fredensborg and Poulin2009). However, these two aspects of parasite community variation are often studied in isolation. There is a need for studies that examine the generality of any patterns by looking at temporal and spatial variation in parasite community composition simultaneously (González and Poulin, Reference González and Poulin2005). When both space and time are incorporated into field studies (e.g. Vidal-Martínez and Poulin, Reference Vidal-Martínez and Poulin2003; Norton et al. Reference Norton, Lewis and Rollinson2004; Behnke et al. Reference Behnke, Bajer, Harris, Newington, Pidgeon, Rowlands, Sheriff, Kuliś-Malkowska, Sinski, Gilbert and Barnard2008; Faltýnková et al. Reference Faltýnková, Valtonen and Karvonen2008), usually only a small number of host populations are considered, spread over relatively large spatial scales. On the one hand, a focus on large spatial scales is understandable and important, given that local parasite communities are assembled from a regional species pool, and regional processes are therefore likely to have a strong impact on local parasite communities composition (Kennedy and Bush, Reference Kennedy and Bush1994; Guégan et al. Reference Guégan, Morand, Poulin, Thomas, Renaud and Guégan2005). On the other hand, a focus on large-scale patterns is regrettable, since in some host study species, local, small-scale factors appear to be more important in determining parasite community composition (Poulin, Reference Poulin2007; Kennedy, Reference Kennedy2009).
In addition to investigating the extent of spatiotemporal variation in parasite communities, it is necessary to examine correlates of this variation, if we are to understand its underlying causation. Host-related factors, such as diet, geographical range, body size and host density have been shown to contribute to variation in parasite communities among host species (Gregory, Reference Gregory1990; Bell and Burt, Reference Bell and Burt1991; Guégan and Kennedy, Reference Guégan and Kennedy1993; Arneberg et al. Reference Arneberg, Skorping, Grenfell and Read1998a; Nunn et al. Reference Nunn, Altizer, Jones and Sechrest2003). Likewise, habitat characteristics can explain interspecific variation in parasite communities (Krasnov et al. Reference Krasnov, Shenbrot, Medvedev, Vatschenok and Khokhlova1997; Brouat et al. Reference Brouat, Kane, Diouf, Bâ, Sall-Dramé and Duplantier2007; Randhawa and Poulin, Reference Randhawa and Poulin2010). However, studies examining the link between habitat characteristics and parasite community variation at the level of populations within host species are less common (but see e.g. Goater et al. Reference Goater, Baldwin and Scrimgeour2005; Cardon et al. Reference Cardon, Loot, Grenouillet and Blanchet2011). Habitat characteristics can affect macroparasite populations directly, by influencing the survival of free-living parasite stages, and/or indirectly, by influencing survival of (intermediate) hosts (Sousa and Grosholz, Reference Sousa, Grosholz, Bell, McCoy and Mushinsky1991; Pietrock and Marcogliese, Reference Pietrock and Marcogliese2003). If a strong association exists between habitat characteristics and parasite population dynamics and/or parasite community composition, then it provides support for the idea that local processes are important determinants of parasite communities.
Here, 12 replicate populations of three-spined stickleback, Gasterosteus aculeatus L., from North Uist, Scotland, were sampled in 2 consecutive years to address the following questions: (1) is there variation in macroparasite communities among populations, (2) is this variation consistent across years and (3) can spatial variation in macroparasite community composition be explained by differences in geomorphological and/or physicochemical habitat characteristics? The three-spined stickleback is a useful model species for assessing spatiotemporal variation in parasite communities, and associations with habitat characteristics for several reasons. It is distributed throughout much of the northern hemisphere and occupies a diverse range of habitats, from freshwater streams and lakes to brackish and marine water bodies (Wootton, Reference Wootton1976). Population density in these habitats is typically high, making it easy to obtain large sample sizes. Furthermore, the stickleback parasite fauna has been well documented (Wootton, Reference Wootton1976; Barber, Reference Barber, Östlund-Nilsson, Mayer and Huntingford2007). The study system, North Uist, comprises an extensive network of geographically isolated freshwater lochs, the majority of which harbour sticklebacks. In addition, lochs on North Uist are characterized by substantial environmental variation, most notably a cline in pH that runs from the west side to the east side of the island (Giles, Reference Giles1983). The North Uist system is therefore ideally suited to the objectives of this study.
MATERIALS AND METHODS
Fish populations, sampling and parasite identification
Twelve geographically isolated freshwater lochs from North Uist, Scotland, were selected for stickleback sampling, and were chosen to represent a range of habitats across the island (Table 1). The lochs cover a small geographical area; the furthest 2 lochs are 17·4 km apart. Stickleback populations were sampled over a 2-week period at the same time during the breeding season (April–May) in 2 consecutive years, 2007 and 2008. Fish were caught using minnow traps (Gee traps, Dynamic Aqua, Vancouver), which were set overnight and lifted the following day. Typically, 20 or 30 traps were set along 100–400 m of shoreline depending on the loch (representing approximately 20–25% of shoreline) in both relatively deep and shallow water. Distributing traps across a range of habitats within lochs allowed us to take into account possible within-loch spatial variation in parasite communities. A sample of 20 fish was selected haphazardly from the total number caught, although occasionally fewer than 20 fish were caught (Table 1). Since most of the stickleback populations sampled in this study are annual (MacColl, unpublished observations), the fish are approximately the same age (0+).
Table 1. The twelve freshwater lochs from North Uist sampled in the study with their geographical location, number of fish dissected for parasites per loch for both sampling years, the mean fish standard length of both years (±standard error of the mean), loch surface area (S.A.), pH, calcium ion (Ca2+) concentration, Chlorophyll A (Chlor. A) concentration and dissolved organic carbon (DOC) content

Fish were transferred to polystyrene boxes filled with lake water and provided with an air source. Within 48 h of capture fish were killed, by an overdose of MS222 (400 mg L−1), and dissected. Standard length was measured to the nearest 0·1 mm and the sex was determined. The external surface, gills and all organs were carefully scanned for macroparasites using a dissection microscope. The caudal, anal and dorsal fins were examined for ectoparasites and the number recorded to give a measure of abundance. Presence of ectoparasites on the gills and other parts of the body was recorded in order to estimate prevalence, but the abundance at these locations was not determined. The rest of the body surface was checked for parasites under the skin. The opercular cavity and the gills on the left side were examined. Only the left eye was dissected. Intestines were stored in 70% ethanol and dissected in July–August 2007, and October–November 2008 for both years, respectively. A total of 455 fish was dissected. Most parasites were identified to species level, using a key for parasites of freshwater fish (Bykhovskaya-Pavlovskaya et al. Reference Bykhovskaya-Pavlovskaya, Gusev, Dubinina, Izyumova, Smirnova, Sokolovskaya, Shtein, Shul'man and Epshtein1964) and more current and specialist literature where necessary (Andersen and Gibson, Reference Andersen and Gibson1989; Gibson et al. Reference Gibson, Jones and Bray2002).
Habitat characteristics
One geomorphological variable (loch surface area) and 4 physicochemical variables (pH, calcium concentration (Ca2+ conc.), chlorophyll A concentration (Chlor A conc.), dissolved organic carbon (DOC)) were measured. Chlorophyll A concentration is a measure of phytoplankton productivity specifically, and aquatic productivity generally, whereas DOC measures organic loading of a water body.
There are good reasons why we might expect these 5 habitat characteristics to influence stickleback parasite communities on North Uist. The size of water bodies (Kennedy, Reference Kennedy1978; Hartvigsen and Halvorsen, Reference Hartvigsen and Halvorsen1994), pH (Marcogliese and Cone, Reference Marcogliese and Cone1996; Goater et al. Reference Goater, Baldwin and Scrimgeour2005; Hernandez et al. Reference Hernandez, Bunnell and Sukhdeo2007) and DOC (King et al. Reference King, McLaughlin, Gendron, Pauli, Giroux, Rondeau, Boily, Juneau and Marcogliese2007) have previously been shown to affect parasite species richness, and prevalence and abundance of individual parasite species in aquatic environments. Loch surface area is important from an epidemiological perspective: larger water bodies potentially contain larger host populations, which may increase transmission of parasites (Ebert et al. Reference Ebert, Hottinger and Pajunen2001). Calcium concentration, although strongly correlated with pH, has been shown to be associated with the presence of Diplostomum sp. (Curtis and Rau, Reference Curtis and Rau1980), as lakes with low calcium concentrations cannot support the snail intermediate hosts. Furthermore, calcium concentration is known to be a dominant axis of variation among North Uist lochs (Giles, Reference Giles1983). As a result, it may affect the distribution of trematodes that use snails as a first intermediate host, and was thus analysed separately from pH. There are good reasons to expect a positive association between aquatic productivity and parasite species richness and abundance (Esch, Reference Esch1971; Poulin et al. Reference Poulin, Mouillot and George-Nascimento2003), which may also be mediated indirectly via the abundance of intermediate host species (Goater et al. Reference Goater, Baldwin and Scrimgeour2005). Lastly, DOC is known to mediate the density of invertebrates in freshwater systems (Wetzel, Reference Wetzel2001). Since crustaceans such as copepods act as first intermediate hosts for a number of stickleback cestode species, DOC may have knock-on effects on the abundance of these parasite species.
pH values were measured using a calibrated pH meter (Multi 340i, Semat International) and are averages of 1–4 readings (depending on the loch) taken between April 2006 and May 2009. Calcium concentrations were obtained from water samples, collected in April–May 2007, via inductively coupled plasma mass spectrometry (ICP-MS). The value is the average of 5 runs. Calcium concentrations were available for 11 lochs only. Chlorophyll A concentration and DOC values were obtained from water samples collected in April–May 2008 by spectrophotometry and total organic carbon analyser respectively. Data for these 2 measures were available for 8 lochs only. Loch surface area was determined from a 1:25 000 topographic map (Ordnance Survey sheet) in Adobe Photoshop (Adobe Systems, Mountain View, CA, USA).
Statistical analysis
To identify common parasite species quantitatively, we followed the approach of MacColl (Reference MacColl2009). If a parasite species was present in over 10% of hosts across both years and all populations, it was considered for individual statistical analysis (see below). Prevalence and abundance are defined after Bush et al. (Reference Bush, Lafferty, Lotz and Shostak1997), and refer to the percentage of hosts infected with a certain parasite species and the number of individuals of a particular parasite species on/in a host individual, respectively.
Species accumulation curves
Estimates of parasite species richness are strongly influenced by the number of host individuals sampled (Walther et al. Reference Walther, Cotgreave, Price, Gregory and Clayton1995; Guégan and Kennedy, Reference Guégan and Kennedy1996). To determine whether the sample sizes in our study were large enough to provide a representative estimate of parasite species richness for each loch, we plotted parasite species accumulation curves (for description, see Dove and Cribb, Reference Dove and Cribb2006). Species accumulation curves were created for each loch using abundance data on the macroparasite species recorded (Table 3). Data from both sampling years were pooled, giving a total sample size of approximately 40 fish per loch. Species accumulation curves give the mean estimate of 100 curves based on adding the samples in a random order. For each loch, we calculated the number of species found in a random sample of 20 fish (our sample size) as a percentage of the total parasite species richness for that loch.
Table 2. Prevalence (%) of nine macroparasite species in three-spined sticklebacks from twelve freshwater lochs in North Uist, Scotland, sampled in April–May during two consecutive years, 2007 and 2008

Table 3. Mean abundance of nine macroparasite species in three-spined sticklebacks from twelve freshwater lochs in North Uist, Scotland, sampled in April–May during two consecutive years, 2007 and 2008

Parasite community measures
Two measures of parasite community composition at the host population level (component community) were calculated: Simpson's diversity index (1-D), which is a diversity index that takes into account the relative abundance of each species in the index (Magurran, Reference Magurran2003) and the percentage of fish infected with at least 1 parasite species. In addition, mean parasite species richness and mean total parasite abundance were determined for each population as measures of parasite community composition at the level of individual hosts (infracommunity). The relationship between measures for both years was determined using Pearson correlation. For mean total parasite abundance, the correlation was weighted by the inverse of the geometric mean of the standard deviation of both years, i.e. 1/[sqrt(SD2007*SD2008)], to account for within-population differences in parasite dispersion.
Canonical variates analysis
To get an overall impression of the differences in parasite community composition between years and populations, canonical variates analysis (CVA) was conducted on parasite abundance data. CVA is a common multivariate technique that is used to determine the relationship between groups of variables in a data set. Each individual fish can be mapped in a multidimensional space where the axes represent combinations of parasite species that are best at discriminating within/between populations. To minimize the effect of rare species, only species present in at least 5 lochs across both years were included in the analysis. Abundance data for the remaining parasite species were ln(x + 1) transformed and standardized by subtracting the mean (transformed) abundance and dividing by the standard deviation of (transformed) abundance for that parasite species across all individuals sampled. For each year per population, a mean CV score was calculated for the first (CV1) and second canonical variate (CV2), and these were represented graphically in a biplot. Loadings of each parasite species indicate their contribution to the scores on a particular axis.
Generalised linear models of parasite abundance, prevalence and species richness
In addition, parasite abundance, prevalence and species richness data were analysed statistically using univariate generalised linear models (GLMs). Parasite species richness was modelled with Poisson errors and a logarithm link function, whereas total parasite abundance and abundance of individual parasite species were modelled with negative binomial errors and a logarithm link function. Prevalence of individual parasite species was analysed using GLMs with a binomial error structure and a logit link function; the response variable took values of ‘1’ or ‘0’ if fish were infected or uninfected, respectively. Full models were the same for all response variables and included population, year and sex as fixed effects, fish standard length as a covariate and the year × population, length × sex and length × population interaction effects. The year × population term assessed whether there was a change in the relative abundance, parasite prevalence or species richness of different populations across years; if this was the case, the interaction term was expected to be significant. Length × sex and length × population were fitted to examine whether the effect of length on parasite measures was consistent between sexes and across populations. Significance of effects was determined by sequentially dropping each term from the full model and recording the change in deviance compared to the χ2 distribution with the corresponding number of degrees of freedom, until a minimum adequate model was specified. If main effects were marginal to interaction effects, the significance of the main effect was assessed by dropping both the main and interaction effects. All statistical analyses were performed in GenStat (release 12, VSN International Ltd, Hemel Hempstead, UK).
Associations between habitat characteristics and parasite community measures
To establish whether differences in habitat characteristics could explain spatial variation in parasite distribution, the 5 habitat characteristics described above were regressed against 11 measures of parasite community composition at the host population level. Parasite data were averaged over both sampling years. For each regression, the parasite community measure was the response variable and the habitat characteristic was the explanatory variable. To account for multiple comparisons, adjusted P-values were calculated using the method of Benjamini and Hochberg (Reference Benjamini and Hochberg1995). This technique controls the false discovery rate and is less conservative than other multiple comparison methods.
Distance decay in parasite community similarity
To exclude ‘isolation by distance’ as an alternative explanation to ‘isolation by environment’ for spatial differences in parasites communities, we performed a ‘distance decay in similarity’ analysis (sensu Poulin, Reference Poulin2003). This method tests the relationship between the similarity of parasite communities and the geographical distance between them. For each pairwise combination of lochs (66 in total) we calculated the Jaccard index of similarity, a measure of the proportion of shared parasite species out of the total between 2 localities, using presence/absence data, and the shortest geographical distance between lochs, using Google Earth. Since sampling occurred during 2 years, an average was taken for the Jaccard index. Jaccard similarity values were ln(x + 1) transformed and were regressed against geographical distance (km). To account for non-independence of similarity measures (each population is used in multiple pairwise comparisons), the significance of the regression was assessed using a randomization approach, following Poulin (Reference Poulin2003). The regression probability was calculated using the program RT 2.1 (Manly, Reference Manly1997), and was based on 10 000 permutations.
RESULTS
Parasite communities
Nine macroparasite species were recorded (Tables 2 and 3). Encysted trematode metacercariae found in the humour of the eye were not identified, but probably belonged to the species Apatemon gracilis (Blair, Reference Blair1976), since metacercariae of this species are usually found in the eyes of fish from the Gasterostidae family (Bell and Sommerville, Reference Bell and Sommerville2002). Here, these metacercariae are referred to as Apatemon sp. Likewise, encysted Diphyllobothrium worms could not be identified to species level and are referred to as Diphyllobothrium sp. Diplostomid trematodes found in the humour and retina of the eye are probably Diplostomum gasterostei. Preliminary genetic analyses on diplostomids from other North Uist sticklebacks indicate that they belong to only one species (A. Rahn, personal communication). However, to avoid any ambiguities in identification, these trematodes are referred to as ‘diplostomula’ (see MacColl and Chapman, Reference MacColl and Chapman2010).
Five parasite species were present in over 10% of all fish in the sample and accounted for much of the variation in parasite community composition: the trematodes ‘diplostomula’ and Apatemon sp., the monogenean Gyrodactylus arcuatus, and the cestodes Schistocephalus solidus and Proteocephalus filicollis. Abundance and prevalence data of these parasite species were analysed with separate statistical models. Parasite species accumulation curves revealed that a sample size of 40 fish per population (over both years) was sufficient to capture most of the parasite species diversity in that population: at this sample size, most curves have reached or are reaching an asymptote (Supplementary Fig. 1, online version only). Moreover, a sample of 20 fish detected at least 80% of the species present in a given population for most populations in this study (Supplementary Table 1, online version only), indicating that 20 is an adequate sample size for estimating parasite species richness.
Spatiotemporal variation in parasite communities
General patterns
Parasite communities ranged from those comprising only two species, with over 80% of uninfected individuals in the population (Daimh) to those in which a large proportion (70%) of the population was infected with at least 3 parasite species (Mhic Gille Bhride). Parasite diversity (1-D) varied considerably among populations but estimates for populations were correlated across years (Fig. 1a; r = 0·72, P = 0·008). Likewise, the percentage of fish infected with at least 1 parasite species was spatially variable but the relative differences among populations changed little between years (Fig. 1b; r = 0·87, P < 0·001).

Fig. 1. Plot of the relationship between parasite community measures at the host population level in 2007 and 2008: (a) parasite diversity (1-D): r = 0·72, P = 0·008; (b) percentage of fish infected with at least 1 parasite species: r = 0·87, P < 0·001; (c) mean parasite species richness: r = 0·96, P < 0·001, (d) mean total parasite abundance: r = 0·90, P < 0·001.
Canonical variates analysis
Thersitina gasterostei was excluded from the analysis, as this species was present in 2 lochs only. Fig. 2 shows the biplot of the CVA results. Canonical variate 1 (CV1) and canonical variate 2 (CV2) accounted for 39·3% and 30·9% of the variation in parasite abundance, respectively. CV1 was associated with high abundance of diplostomula, Apatemon sp., and Diphyllobothrium sp., whereas CV2 was determined largely by a high abundance of Proteocephalus filicollis and Gyrodactylus arcuatus. In general, CV values were more similar within populations than between populations, and as a result years within populations grouped together more closely than populations (Fig. 2).
Parasite species richness and total parasite abundance
Parasite species richness varied significantly among populations and differed between years (Table 4). Species richness was higher in 2008 than in 2007, but population explained substantially more variation in parasite species richness than year (Table 4). Moreover, the relative differences in parasite species richness among populations changed little between years, as indicated by the non-significant year × population interaction and the strong positive correlation between parasite species richness in both years (Fig. 1c; r = 0·96, P < 0·001). Length was positively correlated with parasite species richness across populations (Table 4). Neither sex nor sex × length explained significant variation in parasite species richness (Table 4). Total parasite abundance also varied significantly among populations, between years and as a result of fish length (Table 4). Like parasite species richness, population, rather than year, was the most important determinant of total parasite abundance. Total parasite abundance was higher in 2008 and was positively correlated with fish length across populations. The effect of length on parasite abundance differed significantly across males and females although there was no main effect of sex. The marginally significant year × population term indicated that the relative differences in parasite abundance changed slightly between years (Table 4). Nevertheless, the correlation between mean total parasite abundance in both years remained tight (Fig. 1d, weighted correlation: r = 0·90, P < 0·001).
Table 4. Results from generalised linear models of parasite species richness, total parasite abundance and abundance and prevalence of diplostomula, Gyrodactylus arcuatus, Apatemon sp., Schistocephalus solidus and Proteocephalus filicollis

Prevalence and abundance of individual parasite species
The GLMs of prevalence and abundance data of individual parasite species revealed common patterns. Population explained a significant proportion of variation in all data sets (Table 4). Year had a significant effect on the abundance of G. arcuatus, diplostomula, Apatemon sp. and S. solidus as well as on the prevalence of G. arcuatus, diplostomula and S. solidus, although to different extents (Table 4). Values of these individual parasite species measures, apart from S. solidus abundance, were higher in 2008 than in 2007. With the exception of G. arcuatus prevalence, population rather than year accounted for the largest proportion of variation in abundance and prevalence of individual parasite species. Abundance of G. arcuatus, diplostomula, S. solidus and P. filicollis, and prevalence of G. arcuatus, diplostomula and Apatemon sp. also varied significantly as a result of fish length. Excluding P. filicollis and S. solidus, parasite abundance was positively correlated with fish length. Likewise, prevalence of individual parasite species was higher in larger fish (Table 4). However, the length × population interaction was significant for diplostomula abundance, G. arcuatus prevalence and Apatemon sp. prevalence, indicating that this relationship was not identical across all populations. Sex failed to explain variation in abundance and prevalence of any parasite species, but the length × sex term was significant for S. solidus abundance (Table 4).
The significance of the year × population interaction term varied among parasite species (Table 4). The relative differences among populations in diplostomula abundance and prevalence, P. filicollis abundance and prevalence and Apatemon sp. prevalence changed little between years (Figs 2 and 3). Relative differences in G. arcuatus abundance and prevalence among populations were not as repeatable across years. However, this result was highly dependent on 2 populations, Buaile and Scadavay. Buaile had a high abundance of G. arcuatus in 2007 whereas the parasite was absent from the sample in 2008 (Table 3). Conversely, G. arcuatus was absent from Scadavay in 2007 but was found in 55% of fish examined in 2008 (Table 2). The year × population interaction was also marginally significant for S. solidus abundance and prevalence, and for Apatemon sp. abundance (Table 4). For S. solidus, this may be attributed to a single population, Mhic A'Roin. In 2007, S. solidus was found in the majority of fish from this population, while it was only recorded from 1 fish only in 2008.

Fig. 2. Biplot of mean canonical variate (CV) scores for each year per population, on the first two CV axes. Open circles are the 2007 score; closed circles are the 2008 score. When a line joins the two circles it indicates that they belong to the same population. The superimposed biplot shows the loading vectors of the 8 parasite species included in the CVA, represented by black arrows. Loading vectors were multiplied by 2 for clarity.
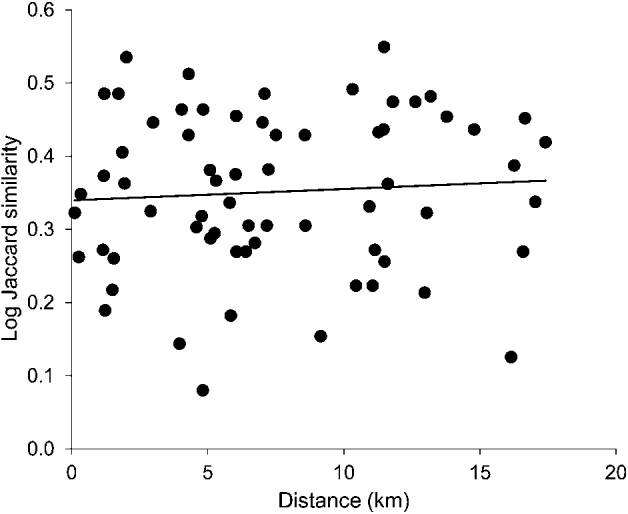
Fig. 3. Plot of the relationship between similarity in parasite communities between two lochs and the geographical distance between them (total number of pairwise comparisons = 66). Similarity values were calculated from presence/absence data using the Jaccard index, and show the average across both sampling years. Jaccard index values were ln(x + 1) transformed. The correlation was non-significant (r2 = 0·0048, n=66, P = 0·581).
Habitat characteristics and distance decay in similarity
None of the 5 habitat characteristics explained variation in any of the 11 measures of parasite community composition, once multiple comparisons were corrected for. Table 5 shows the matrix of r2 values. Similarity in parasite community composition increased slightly with increasing distance between 2 lochs, but the effect was non-significant (r2 = 0·0048, n=66, P = 0·581; Fig. 3).
Table 5. Matrix of r2 values from linear regressions of five habitat characteristic measures against eleven measures of parasite community composition

DISCUSSION
A comparative analysis of macroparasite communities in 12 three-spined stickleback populations was carried out to investigate the extent of spatial variation in parasite communities, its stability over time, and associations with environmental variables. We found substantial variation among populations in all measures of parasite community composition. Populations ranged from those in which a large proportion of fish was completely uninfected, to those in which most fish harboured a diverse parasite community. However, compared with other stickleback systems (e.g. Kalbe et al. Reference Kalbe, Wegner and Reusch2002; MacColl, Reference MacColl2009), North Uist sticklebacks have a relatively depauperate macroparasite fauna. Even in the most species-rich loch, fish with more than 4 parasite species were rarely encountered. The only parasite species found regularly were monogeneans (Gyrodactylus arcuatus), trematodes (diplostomula and Apatemon sp.) and cestodes (e.g. Schistocephalus solidus and Proteocephalus filicollis), and together, these 5 species contributed most of the variation in parasite community composition.
There was also a difference between years for most measures of parasite community composition, with higher values in 2008 than in 2007. Importantly, the effect of year on parasite communities was consistent across populations, such that the relative differences in parasite community composition among populations changed little over time. This pattern was observed both at the level of the parasite community (parasite species richness, total parasite abundance) and at the level of individual parasite species (abundance and prevalence), although the strength of the pattern was dependent on the parasite community measure. So far, few studies of freshwater fish parasites have found repeatability in parasite community richness or composition in time and/or space (Kennedy, Reference Kennedy2009; but see Carney and Dick, Reference Carney and Dick2000). However, in this study we found short-term stability in the spatial variation in macroparasite communities among our stickleback populations, rather than temporal stability in parasite communities per se. This pattern was revealed only because a moderately large number of host populations were sampled over successive time-periods.
In addition to the effects of population and year of sampling on parasite community composition, fish length explained variation in parasite species richness, total parasite abundance, and abundance and prevalence of certain parasite species. Generally, length was positively correlated with parasite community measures and this relationship was similar across populations. This pattern is often observed in natural host populations (Poulin, Reference Poulin2000), and there are 2 main explanations for its existence. First, larger hosts may harbour more parasites because they provide a larger surface area, and hence more niche space, for parasites (Arneberg et al. Reference Arneberg, Skorping and Read1998b). Second, larger hosts are usually older, and may harbour more parasites simply because parasites have accumulated over their lifetime (Pacala and Dobson, Reference Pacala and Dobson1988; Hayward et al. Reference Hayward, Wilson, Pilkington, Pemberton and Kruuk2009). Most of the stickleback populations sampled in this study are annual, but some may be multi-annual (MacColl, unpublished data), raising the possibility that differences among populations are due to larger fish accruing more parasites over time. However, since the majority of populations are annual, it limits the possibility of epidemiological ‘carry-over’ within individuals from one year to the next. Additionally, the statistical models showed a highly significant effect of population on all measures of parasite community composition, in spite of ‘correcting’ for differences in fish length (by fitting it as a covariate in the models).
It has recently been suggested that homogeneity of stickleback parasite communities is likely to occur over short distances only (Poulin et al. Reference Poulin, Blanar, Thieltges and Marcogliese2011). Here, we clearly demonstrate that heterogeneity in parasite communities can be pronounced even at small spatial scales: the furthest two lochs in our study system were separated by only 17 km. Considering that 7 out of the 9 macroparasites recorded in this study have a complex life cycle with a piscivorous bird as the definitive host, we might have expected dispersal mediated by the bird host to homogenize the distribution of parasites. And yet, prevalence and abundance of these parasite species varied considerably among populations. This suggests that local processes govern the population dynamics of individual parasite species, and parasite community composition more generally. The fact that between-population variation in parasite communities was greater than within-population (i.e. between-year) variation provides further support for the idea that local factors are important in structuring parasite communities of North Uist sticklebacks (Poulin, Reference Poulin2007; Thieltges et al. Reference Thieltges, Fredensborg and Poulin2009). Nevertheless, regional processes could still contribute to parasite community composition, for instance, by determining the likelihood of colonization of a parasite species in a locality (Guégan et al. Reference Guégan, Morand, Poulin, Thomas, Renaud and Guégan2005). An analysis of regional variation in stickleback parasite communities (Poulin et al. Reference Poulin, Blanar, Thieltges and Marcogliese2011) certainly suggests that is the case at larger spatial scales.
Habitat characteristics are good candidates for local factors that influence parasite community composition (Poulin, Reference Poulin2007). Here, we examined associations between 5 habitat characteristics and 11 measures of parasite community composition. We failed to detect significant correlations between any combination of habitat characteristic and parasite community measure once multiple comparisons were corrected for, in spite of substantial spatial variation in both types of measure. Moreover, the level of variation on North Uist was comparable to previous studies that found associations between physicochemical variables and parasite community measures (e.g. Goater et al. Reference Goater, Baldwin and Scrimgeour2005; Hernandez et al. Reference Hernandez, Bunnell and Sukhdeo2007). It was surprising that calcium concentration did not explain spatial differences in diplostomula or Apatemon sp. abundance or prevalence, considering that it has previously been shown that this measure is associated with Diplostomum sp. distribution (Curtis and Rau, Reference Curtis and Rau1980), and calcium concentration likely determines the suitability of a lake for the intermediate snail host. Perhaps other features of the habitat, such as the density of the snail population (Voutilainen et al. Reference Voutilainen, van Ooik, Puurtinen, Kortet and Taskinen2009) or abundance/density of birds (Hechinger and Lafferty, Reference Hechinger and Lafferty2005; Byers et al. Reference Byers, Blakeslee, Linder, Cooper and Maguire2008) may be more important in shaping spatial variation in trematode prevalence and abundance. The same explanation applies to the other parasite community measures: they may be strongly correlated with environmental variables that have yet to be measured. Alternatively, host-related factors could generate differences in parasite communities among populations. For example, feeding preference and diet composition could have a large impact on the prevalence and abundance of trophically transmitted parasites such as cestodes. Evolved differences in resource use are known to exist among stickleback populations (Schluter, Reference Schluter1995) and could hinder or promote the spatial distribution of these parasites (MacColl, Reference MacColl2009).
A difficulty of testing for correlations between habitat characteristics and parasite communities across isolated host populations is that localities that are closer to one another geographically are more likely to share the same environmental features (Krasnov et al. Reference Krasnov, Shenbrot, Mouillot, Khokhlova and Poulin2005; Poulin et al. Reference Poulin, Blanar, Thieltges and Marcogliese2011). Thus, it is possible that differences among host populations are due to differences in geographical distance per se rather than to differences in environment. However, we could also rule out ‘isolation by distance’ as an explanation for spatial variation in parasite communities: the similarity in parasite communities between two lochs was not influenced by the geographical distance between them. These data suggest that parasite communities in each stickleback population are idiosyncratic, with variation being explained by neither geographical proximity nor the abiotic environment. Instead, parasite communities may be linked to particular biotic properties of individual lochs, such as the presence of particular intermediate or final hosts, although this idea has yet to be tested.
Temporal stability of spatial variation in parasite communities, such as that observed in this study, could have important consequences for the evolution of host populations. Specifically, if host populations experience consistent differences in parasite communities over time, individuals in these populations may experience different degrees of natural selection mediated by parasites. Ultimately, such geographical variation in parasite-mediated selection could lead to population divergence in host traits that are closely associated with host-parasite interactions, such as defence traits (Thompson, Reference Thompson2005). A specific prediction of this scenario is that adaptation to local parasite communities generally, and abundance and prevalence of individual parasite species specifically, will drive investment in parasite resistance. Although the link between natural infection and parasite resistance has been demonstrated in several different systems (Corby-Harris and Promislow, Reference Corby-Harris and Promislow2008; Hasu et al. Reference Hasu, Benesh and Valtonen2009), generally it remains a little-explored topic in host-parasite biology. We have previously demonstrated that there is substantial divergence in resistance to Gyrodactylus among North Uist stickleback populations, and that experimental levels of resistance can to some extent be linked to natural infection levels (de Roij et al. Reference de Roij, Harris and MacColl2011).
The stability of spatial variation in host parasite communities documented in this study suggests that stickleback populations on North Uist experience consistent differences in parasite-mediated selection. However, we must emphasize that we have considered spatial variation in stickleback parasite communities over a short time frame only; these data do not allow us to draw conclusions about longer-term parasite population dynamics and community composition. Longitudinal data sets of fish macroparasite communities are scarce, but the few longitudinal studies of individual parasite species that do exist suggest that parasite population dynamics that appear to be stable in the short term are unstable or variable over longer periods of time (Kennedy et al. Reference Kennedy, Shears and Shears2001; Heins et al. Reference Heins, Birden and Baker2010). Therefore, to assess the repeatability of our findings in the long term, the same populations will need to be sampled in subsequent years.
ACKNOWLEDGEMENTS
We are grateful to Sonia Chapman and Sarah Forbes for help with the collection of parasitological and environmental data, and to Ann Lowe for logistical support. We thank Scott Young for analysing the calcium concentration of water samples and Suzanne McGowan for analysing the chlorophyll A concentration and DOC contents of water samples. We also thank North Uist estates and the Scottish Executive for access to land. This paper is dedicated to Dr John A. MacLeod for his support, and enthusiasm and interest in the project.
FINANCIAL SUPPORT
This work was funded by a Ph.D. Studentship awarded by The University of Nottingham to J.d R. and a Natural Environment Research Council fellowship (NE/C517525/1) and University of Nottingham Fellowship Enhancement Award to A.D.C.M. The comments of five anonymous reviewers substantially improved the manuscript.


