


Introduction
The northern regions of the Arctic states typically have much higher ratios of males to females compared to the national averages. Both historical and contemporary explanations can be given for these higher male sex ratios. The historical explanation is that because of the economic structure of these regions in the early period of their development, the jobs most in demand were those that attracted and were mostly filled by men. Construction, mining, forestry and transport were the major sectors, all of which required more male labour because of the physical demands of work in these sectors. For instance, in the first US population census in which Alaska was included in 1900, there were 260 men for every 100 women (Alaska Department of Labor and Workforce Development, 2013). This pattern of higher male migration took place across all Arctic regions where there was extensive resource development. The contemporary reason for higher and increasing male sex ratios is that in recent decades, there has been a pattern of significantly higher female outmigration from the Arctic (Hamilton & Seyfrit, Reference Hamilton and Seyfrit1994). Women in the Arctic tend to obtain more education and thus compete in different labour markets where jobs are often found in the larger settlements in the Arctic or outside of the Arctic. An exception to this recent trend of increasing male sex ratios in Arctic regions is the Russian North, where during the two decades after the breakup of the Soviet Union and economic transition towards a market economy, the ratio of men to women has declined significantly. The main research and policy question addressed are the causes of the large declines in the male sex ratio in the regions of the Russian North during the first two decades of the post-Soviet period.
This trend of declining male sex ratios in the Russian North must be examined within several contexts. Globally, there are slightly more men than women, 101.6 males per 100 females (United Nations, Department of Economic and Social Affairs, Population Division, 2013). At birth, there are around 105 males per 100 females but with higher male mortality, the male sex ratio declines. Higher income, more developed countries tend to have lower male sex ratios because they are further along the demographic and epidemiological transition and lifestyle causes of death predominate, which impact males more than females. Russia, along with several other Slavic and the Baltic states, has the lowest male sex ratios in the world, with 88 males per 100 females or less (United Nations, Department of Economic and Social Affairs, Population Division, 2013). Russia has long had among the lowest male sex ratios among all countries because of the persistently large gap between males and females in life expectancy. The absolute excess of females in Russia is by far the largest in the world. As far back as the first Soviet census in 1926, the deficit of males was already apparent when there were 90.4 males per 100 females (Goskomstat Rossii, 1998). Russian men suffered the brunt of World War II and the male sex ratio fell to 74.7 males per 100 females in 1946, just after the end of the war. The ratio steadily increased to a peak of 88.4 males per 100 females in 1994 before declining again when the male–female gap in life expectancy increased during the post-Soviet period. In 2017, Russian women outlived men by the widest amount of any country in the world, about 10 years, down from a peak gap of nearly 14 years during the worst years of the transition period (Rosstat, 2018).
Among Arctic regions, there is a tendency for more males than females except for the regions of the Russian Arctic (Heleniak, Reference Heleniak and Wegren2015b). Greenland has the highest male sex ratio of all Arctic regions, with 112 males per 100 females, followed by Alaska with 109. The regions of the Russian Arctic have the lowest male sex ratios of all Arctic regions (Fig. 1).
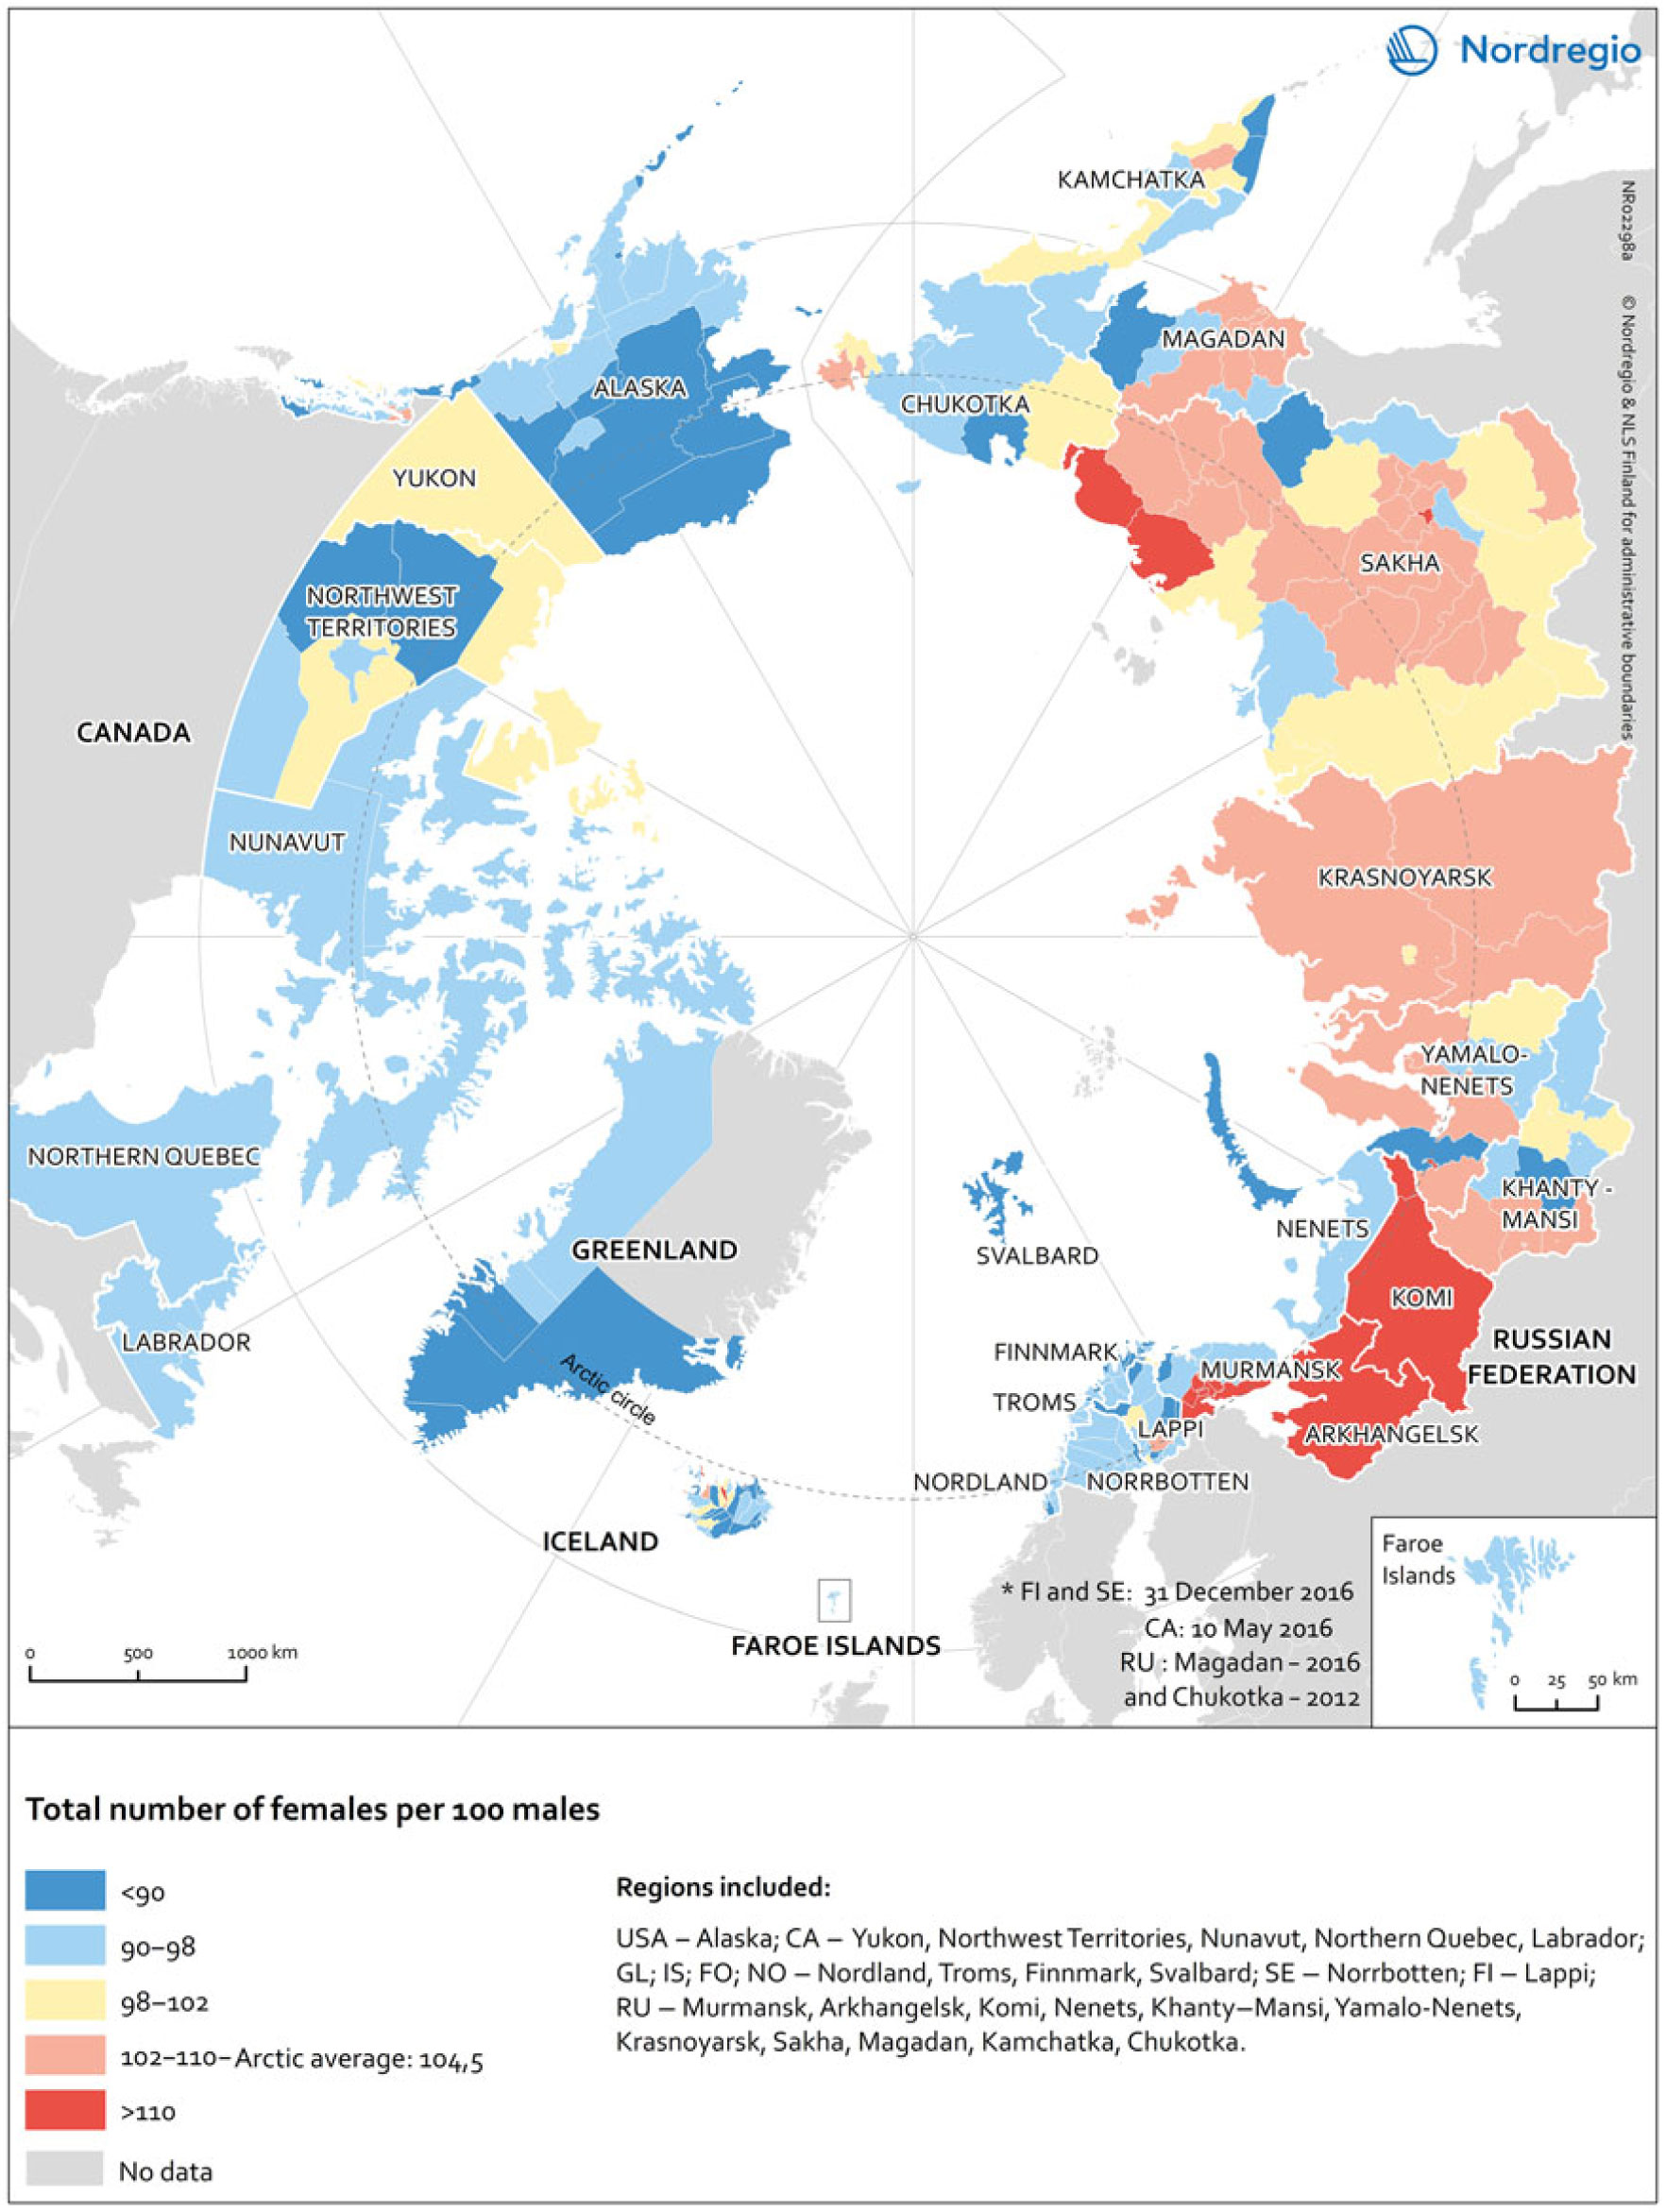
Fig. 1. Gender balance by region in the Arctic, 2017*. Data source: Nation Statistical Institute & Alaska: Department of Labour and Workforce Development.
The figure shows the number of females per 100 males for the total population across the Arctic at the subregional level in 2017. The yellow tone shows subregions with a balance between females and males (female ratio between 98 and 102). The blue tones indicate a predominance of males (female ratio below 98) and the red tones indicate a predominance of females (female ratio above 102). The Arctic average is 104.5, indicating a slight predominance of female population. However, large differences are observed across subregions. In the Russian Federation, the subregions in the regions of Komi, Arkhangelsk and Murmansk had a female ratio exceeding 110 females per 100 males. Other Arctic subregions in Alaska (USA), Canada, Greenland and the Nordic countries had a predominance of male population.
Among Arctic regions, enormous differences can be seen in life expectancy ranging from a high of 82 years (for both sexes combined) in the Faroe Islands to 58 years in Chukotka, a difference of 24 years (Heleniak, Reference Heleniak, Larsen and Fondahl2015a). There is an inverse correlation between the female advantage in life expectancy and overall life expectancy in Arctic regions. This makes sense because if roughly half of a region’s population has a low life expectancy, this would lower the overall level. Likewise, the regions of the Russian North tend to have the largest female advantages in life expectancy and the lowest overall levels of life expectancy among the regions of Russia.
The following sections of the introduction provide a definition of the Russian North and an overview of the various transitions that took place in Russia and in the Russian North during the post-Soviet period, to provide context for examining the sex-specific population changes that took place in the Russian North. The following section discusses the data and methods to be used in the analysis. This is followed by analysis of population change, life expectancy and death by cause by sex in Russia and the Russian North.
Definition of the Russian North
Russia classifies regions as Arctic or Northern based on social, economic, geographical and climatic criteria. The classification of regions as belonging to the Far North (Krayney Sever) was initially developed during the Soviet period for the purpose of designating some regions for priority development and for workers in those regions to receive wage increments and other benefits. The classification of such regions has changed over time; but at the time of the 2010 census, 15 regions, which are entirely or partially classified as belonging to the Far North, hereafter referred to as the Russian North (Rosstat, 2015). The Russian North differs from the Arctic zone of the Russia, the latter being narrower (Rosstat, 2014).
Because the definition of the North cuts across the oblast-level boundaries and most demographic and other data are presented only at this level, for the purpose of this analysis of changing sex composition, a modified set of northern regions are defined whose territories fall partially or entirely in the definition of the Far North. The 15 regions are, from west to east, Karelian Republic, Komi Republic, Arkhangel’sk Oblast, Nenets Autonomous Okrug, Murmansk Oblast, Khanty-Mansiy Autonomous Okrug, Yamal-Nenets Autonomous Okrug, Taymyr Autonomous Okrug, Evenki Autonomous Okrug, Sakha Republic, Chukotka Autonomous Okrug, Kamchatka Oblast, Koryak Autonomous Okrug, Magadan Oblast and Sakhalin Oblast. (Recently, the Taymyr Autonomous Okrug and Evenki Autonomous Okrug were merged with the Krasnoyarsk Kray, and the Koryak Autonomous Okrug was merged with the Kamchatka Oblast. These all are now classified as municipal rayons. Data for them are now included in the parent units to which they were merged and are often not shown separately.)
Russia has a rather complex (and changing) administrative geography. Some regions are purely administrative territorial units while others are homelands of different ethnic groups. The term “oblast” refers to units that serve a solely administrative function. Republics are homelands of larger ethnic groups and in the Russian North include Karelia, Komi and Sakha. A special category particular to the Russian North are the “Small-numbered peoples of the North, Siberia, and the Far East” (Malochislennye narody Severa, Sibiri i Dal’nego Vostoka). In the 1989 censuses, 26 groups were included in this definition. The Khanty-Mansiy, Yamal-Nenets, Taymyr, Evenki, Chukotka and Koryak autonomous okrugs are homelands of “Small-numbered peoples of the North.”
The percentage that each group makes up of its homeland varies. With the development of oil and gas fields and the migration of Russians and others, “Small-numbered peoples” made up only 1.4% of the population in Khanty-Mansiy and 6.0% in Yamal-Nenets in 1989 (Goskomstat SSSR, 1991). They made up larger shares in the Nenets (12%), Taymyr (16%), Evenki (14%), Chukotka (10%) and Koryak autonomous okrugs (25%). In 1989, in the homelands of the larger Arctic ethnic groups, Karelians were 10% of Karelia, Komis were 23% of the Komi Republic and Yakuts were 33% of Yakutia. Some of these ethnic groups, especially the small-numbered groups, are at a different stage in the demographic transition than Russians. The demographic transition is the evolution that most societies and countries go through as they modernise and move from having high birth and death rates to lower birth and death rates (Weeks, Reference Weeks2008). Associated with the demographic transition are simultaneous age, migration, household and epidemiological transitions. The indigenous Arctic groups in Russia are similar to other Arctic indigenous groups in having higher fertility rates, a younger age profile and generally higher mortality rates and worse overall health compared to the general population (Young & Bjerregaard, Reference Young and Bjerregaard2008). The Arctic indigenous groups are generally behind the overall population in the demographic transition. There is a paucity of data showing the health outcomes by ethnic group, but some inferences can be made by examining data for the regions of the Russian North where they are concentrated.
Overview of social, economic and demographic change in Russia during the post-Soviet period
In the early 1990s, Russia and the other states of the former Soviet Union (FSU) underwent what is often referred to as a “triple transition.” The first transition was political, the breakup of the Soviet Union into 15 successor states. This resulted in new patterns of migration among the states. New patterns of foreign trade replaced what had previously been internal trade within one state with tightly controlled foreign borders. The difficulty in establishing these new trade ties contributed to a larger-than-expected economic downturn across the FSU. The second was the transition away from central planning and state ownership of most economic assets to a market economy. Russia, and the other FSU states, had underdeveloped service sectors and overdeveloped industrial sectors under Soviet times. During the 1990s, the service sectors grew proportionally the fastest with large contractions in manufacturing. The effects of this restructuring were differential across regions with large cities able to take advantage of the growth in the service sectors, and resource-rich regions able to benefit from extraction sectors that had become more profitable. Many northern settlements were classic one-company towns responsible for all social and public expenditures that were closed in the 1990s. From a peak in 1989, gross domestic product (GDP) per capita declined nearly by half in 1998 and didn’t return to its pre-transition level again until 2003. There was a large contraction in employment as nearly 10 million jobs were shed in the Russian economy during the 1990s. The third transition was the liberalisation of society, which included freedom of movement and the right to emigrate. Previously, citizens of the Soviet Union needed a resident permit called a propiska to be able to change residence within the country (Heleniak, Reference Heleniak2012). All of these transitions had significant impacts on demographic trends in both Russia and the North.
For Russia, life expectancy plunged for males from 64.9 years in 1987 to 57.5 in 1994, a decline of 7.4 years, which is almost unprecedented for a country not involved in war or famine (Rosstat, 2018). The decline in females was less, 3.4 years, from 74.6 to 71.1 years over the same period. As a result, the female advantage in life expectancy increased from 9.6 years in 1987 to nearly 14 years in 1994. Life expectancy levels would then fluctuate but generally rise, reaching 67.5 for men and 77.6 for women in 2017 (Rosstat, 2018).
Simultaneously, during the turbulent period of the 1990s, the fertility rate declined from a high of 2.194 children per woman in 1987 to a low of 1.157 in 1999 before increasing to 1.762 in 2016. Deviations in the total fertility rate from replacement level of 2.1 children per woman have a large influence on population growth. Continued levels of fertility above 2.1 children per woman explain why the population continues to grow in many less developed countries and levels below this explain why the population in most European countries continue to decline. In Russia, because of this combination of declining fertility and mortality, combined with an already aging population, the number of deaths began to exceed the number of births in 1992 (which was only coincidently the first year of Russia’s independence). Deaths would exceed births by nearly a million a year in the late 1990s and early 2000s. Natural decrease (or negative natural increase) would continue until 2013, causing the population of Russia to decline despite the sizable immigration flows of the post-Soviet period from the other FSU states. The population of Russia peaked in 1993 at 148.6 million and declined by nearly 6 million to a nadir of 142.7 million in 2009 before beginning to increase (Rosstat, 2018). The recent stabilisation and actual increase in the total population is due to a combination of an increase in the number of births, decrease in the number of deaths and continued immigration.
The mortality situation in Russia has received considerable attention for good reason (Heleniak, Reference Heleniak, Larsen and Fondahl2015a). Mortality levels and patterns of death and disease in Russia are far out of line for a country at its level of development. Russia is a literal “point off the curve” in combining relatively low child mortality levels with very high adult mortality levels (Murray & Bobadilla, Reference Murray, Bobadilla, Bobadilla, Costello and Mitchell1997). It is the exceptionally high working-age mortality where Russia differs, with mortality three to five times in males and twice in females among countries with similar income levels (United Nations in Russia, 2008). Studies have shown that the key factor driving increases in mortality during the transition period in Russia is acute psychosocial stress, which was brought about when individuals are called upon to adjust to new situations for which they have few coping mechanisms (Cornia & Paniccia, Reference Cornia and Paniccia2000). This is evidenced in the pattern of causes of death: increases in deaths due to cardiovascular diseases, suicides and accidents and ulcers and cirrhosis of the liver. The transition period in Russia and the other transition countries was marked by unemployment, rapid labour turnover, job insecurity, family instability, distress migration and increased social stratification. Less educated and more socially marginalised groups tended to have much higher mortality levels, as there was widening of the life expectancy gap during the 1990s between those with high and low levels of education. Most studies demonstrated that absolute deprivation, the collapse of the healthcare system and environmental pollution were not major contributing factors (Becker & Bloom, Reference Becker and Bloom1998).
Transition of the Russian North
In addition to the social and economic changes that impacted the population of Russia generally, the residents of the northern regions underwent a specific set of changes as a result of changes in development practices and policies. The manner in which the centrally planned economy of the Soviet Union went about developing the resources of its Northern and Arctic periphery regions was quite different from that of other Arctic countries. This resulted in a much larger overall population and bigger cities than in comparable Arctic regions elsewhere (Heleniak, Reference Heleniak and Orttung2017). The development and securing of a necessary labour force in the North proceeded in several overlapping stages (Heleniak, Reference Heleniak2009). The first was through the use of forced labour that was a part of the Glavnoye Upravleniye Ispravitelno-trudovykh Lagerey (GULAG, Chief Administration for Corrective Labour Camps) system where millions were sent to Siberia and the Arctic to rapidly industrialise the Soviet Union, starting at the time of the first Five-Year Plan in 1928. Later a system of wage increments and other benefits were paid to lure people to migrate to and work in the North. Transport to the region and consumer goods were heavily subsidised. At the end of the Soviet period, all of the various subsidies for northern development were estimated to cost 3% of GDP.
The breakup of the Soviet Union, liberalisation of the society including freedom of movement and the shift from a centrally planned to a market economy caused a shift in the direction of migration in the North from moderate inmigration in the 1980s to rather a large-scale outmigration in the post-Soviet period. The role of the state in northern development decreased considerably and development became governed by market principles. Subsidies for transport, wages and benefits and other necessities were largely eliminated causing a huge increase in the cost of living, resulting in a large-scale exodus from the region. Federal financing of fuel and food shipments to North fell from 1.58% of GDP in 1992 to just 0.12% in 1997 (The World Bank, Europe and Central Asia Region, 1998). There was a closure of many enterprises across the North as the cost of labour and other inputs became prohibitively expensive. Many northern settlements were closed as supplying the large scattered settlement structure became too costly. The downsizing of the military also influenced outmigration from the North. This was especially the case in regions with a large military such as Murmansk and the Far East.
The population of the entire Russian North declined by 20% between 1989 and 2010, from 9.4 to 7.6 million. Migration has been the main driving force of population change over the period of the economic transition, with a 22% population decline from migration. There was a slight natural increase (the difference between births and deaths) in the population of 2.7% at a time when the population of the country was experiencing significant natural decrease due to a steep decline in fertility and rise in mortality to a population that was old and aging rapidly. The reason that the population of the North continued to have natural population increase was due to its younger age structure, with relatively more people in the young working age and who are also of higher fertility age.
The year 1992 saw the greatest outmigration, the first year of the economic reforms and prices were liberalised when the market cost of living in the northern periphery began to be felt. Over the entire period, all northern regions, except the Khanty-Mansi Autonomous Okrug, have had outmigration. Of the 15 northern regions, 11 have had one quarter or more of their populations migrate out since 1989. The only exceptions, in addition to the Khanty-Manisy okrug, were the Yamal-Nenets okrug, the Karelian Republic and Archangelsk oblast, the latter two being closer and better connected to central Russia. The rates of outmigration increased to the east and in regions with smaller populations. At the extreme are Magadan, which had an outmigration of 62% of its population and Chukotka, from which nearly three of every four individuals migrated out, causing the population to fall from 164,000 in 1989 to just 49,300 currently.
The important implication of the regional migration patterns that have taken place in Russia since 1990 is that because migration is so education selective, those regions that have lost people in large numbers due to outmigration have lost them disproportionally among their most educated segments. Conversely, those that have gained have disproportionally gained more educated members. Since more educated people tend to be more productive and more innovative, this has important implications for regional economic growth and for those left behind. Thus, the 72% population decline from migration that Chukotka experienced during the inter-census period will have a greater impact on economic growth because it was the best and brightest that left. For the regions of the Russian North, it was the most educated segments of the populations who used migration as a strategy for adaptation. This left behind less educated populations who have shown to have coped worse with rapidly changing social and economic conditions.
In 1989, the regions of the Far North had more educated populations than the rest of Russia, which involves three reasons. One, the Far North was a region of migrants and more educated people in Russia have higher rates of mobility, as is the case in most countries (Gerber, Reference Gerber2005). Two, the economic structure of the Far North required a more educated labour force. Finally, there were restrictions on migration to many northern regions, allowing enterprises to be selective of whom they would hire. During the post-Soviet period, the regional pattern of change in educational levels mirrors that of net migration. Stated differently, those regions in Russia that gained larger numbers of people through migration, gained disproportionally large numbers of highly educated persons, while those regions that lost larger numbers of people through outmigration, as was the case in many regions of the Far North, lost larger portions of their most educated populations.
Under the Soviet system, since almost the entire economy was state owned and controlled, the various northern entitlements were supported by centrally planned budgetary transfers to regions, state-owned enterprises and organisations and families. The state financed transportation of supplies to northern territories with limited access. Prices were administratively fixed all over the country, and such transfers allowed the regulation of living standards in northern regions. Other laws on pensions, children, the labour code and employment contained special provisions that provided benefits for northerners.
The legislation included a long list of benefits, such as for relocation to the north including lump sum relocation grants, assistance with transport and free housing (The World Bank, Europe and Central Asia Region, 1998). Various employment-related benefits included regional wage coefficients, tax breaks for the coefficient portion of the wages, additional holidays, reduced work weeks, trips to the “mainland” and additional severance pay. Another portion of the legislation included benefits for relocation from the north such as free housing in the mainland, coverage of transport costs, partial funding of housing construction and free land. Additional northern benefits were early retirement for time worked in the north, credit towards early retirement for many occupations found primarily in the Far North, northern pension coefficients and transport for emergency medical service in the mainland.
With the transition, this system was no longer feasible and was replaced by a package of laws the most notable of which was the “Law on State Guarantees and Compensation for Workers and Residents of the North,” which was passed on 19 February 1993, thus shifting much of the burden for special northern benefits from the federal government to local governments and enterprises. The problem was that many of the guaranteed benefits, privileges and wage increment programs went unfunded by the local governments that are supposed to support them or are ignored by the newly private companies when they are obliged to pay various northern benefits or are nowhere near sufficient to compensate for the huge increase in the cost of living in the north.
The enormous costs of the northern development strategy pursued by the Soviet Union were seen as reasonable in that it helped to achieve various strategic goals including allowing the country to become self-sufficient in strategic minerals and to increase export revenue. With shrinking government revenues during a period of steep economic decline in the 1990s, these costs became unsustainable. When all the various extra costs of supporting the population of the 15 regions of the Far North are totalled, in 1997 this amounted to 3.16% of Russia’s GDP (The World Bank, Europe and Central Asia Region, 1998).
Northern labour policy is the combined responsibility of federal, legislative and regional authorities. Under Yeltsin during the 1990s, a new State Committee for North Affairs or Goskomsever was created in June 1992 (Blakkisrud & Honneland, Reference Blakkisrud, Honneland and Blakkisrud2006). With the various reshuffles of government that took place during the decade, this committee and its portfolio went through various iterations and was not very effective in its mandate of implementing the government’s new northern policy. Goskomsever was the main government agency responsible for implementation of the federal resettlement assistance schemes until its abolishment under Putin in 2000.
According to surveys, estimates and observations of the actions of people, there was a huge demand to migrate from the Far North that was not met with either the resources of individuals or government assistance. According to a matrix of inter-regional migration demand compiled in 1992 by Goskomsever, 1.3 million people on the application list wished to leave the Far North (Netherlands Economic Institute, 1998). According to one survey of potential migrants in the Far North, the percentage of various social groups who expressed a desire to leave the North was 60 of pensioners, 70 of disabled, 50 of unemployed, 50 of recent college graduates and 62 of all respondents. Of those surveyed, 12% were born in the North and 47% have lived their 30 years or longer. Ninety-six percent indicated that they or their relatives were not able to finance resettlement and 94% indicated that they have no or insufficient savings.
There is a large literature in both Russian and English, which examine the causes and implications of the switch from the Soviet Union’s centrally planned approach to northern development to Russia’s more market-oriented approach. The classic work in English is The Siberian Curse: How Communist Planners Left Russia Out in the Cold (Hill & Gaddy, Reference Hill and Gaddy2003). The book says that in order to grow, Russia needs to downsize its large Siberian cities. While true from an economic standpoint, there was a large human cost to this readjustment, one that disproportionality affected men living in the Russian North.
Data and methods
The size of a population changes over time because of the two components of population change: natural increase (or decrease) and net migration. This change is expressed in the rather simple population equation:
 $${\rm{Population \ at \ beginning \ of \ the \ period + births}} - {\rm{deaths}} + {\rm{inmigrants}} - {\rm{outmigrants}} = {\rm{population \ at \ the \ end \ of \ the \ period}}$$
The beginning of the period is often the start of the year but can be for any date. The difference between the number of births and deaths is natural increase. The term natural increase is often used by demographers because for most societies, the number of births has exceeded the number of deaths. However, in Russia during the 1990s, the number of deaths has exceeded the number of births, a situation termed negative natural increase or natural decrease. The natural increase or decrease in a population is strongly influenced by the age structure of a population. In relatively younger populations, less people are dying and more people are in the child-bearing ages. In older populations, less people are in the child-bearing ages giving birth and more people are dying. Net migration is the difference between the number of people migrating to a region or country and the number migrating away from a region or country. Important for this analysis is that the population equation can be disaggregated by sex, to determine the relative addition or subtraction of males and females and to isolate the components of population change by gender.
Russia has conducted three recent population censuses, which conveniently cover the period from the late Soviet era through the first two decades of the post-Soviet period when the economy started to grow again and the social situation began to stabilise. This encompasses the period of rapid social and economic change brought about by the breakup of the country, the economic transition away from central planning and the liberalisation of society. The last Soviet census was conducted in 1989, just prior to the breakup of the Soviet Union. In fact, the complete results were never published by the State Committee on Statistics of the Union of Soviet Socialist Republics (Goskomstat SSSR), but many results were published by the successor states including Russia. Fortunately, the CIS Statistical Committee, the scaled-down successor to the Goskomstat SSSR, teamed with a company in the USA to publish all the results on an easy-to-use CD-ROM (CIS Statistical Committee and EastView Publications, 1996). After several delays, independent Russia conducted its first census in 2002, which were published in 12 volumes and also in electronic form as a series of Excel spreadsheets (Rosstat, 2005). The most recent census was conducted in 2010, which was published in 10 volumes and also in electronic form as a series of Excel sheets (Rosstat, 2012).
From these results, data are compiled on the sex composition by region for 1989, 2002 and 2010. The number of births and deaths by sex by region were compiled over this period to determine natural increase (or decrease) by sex. These are readily available in Rosstat’s annual demographic yearbook. Net migration by sex by region was calculated as a residual using the population balancing equation. Thus, population balancing equations were calculated for males and females separately in order to calculate change by sex from natural increase and net migration.
To analyse patterns of mortality by sex, the numbers of deaths by region were disaggregated by cause of death by sex into to several broad categories according to the International Classification of Diseases (World Health Organization, 2019). This is the international system for reporting diseases and health conditions, including deaths. Data on death by cause are usually collected from death certificates. When analysing mortality differences between the sexes in the Russian North during the post-Soviet period, data on six broad categories of causes of death are compiled: infectious and parasitic diseases; neoplasms; diseases of the circulatory system; diseases of the respiratory system; diseases of the digestive system and accidents, injuries, and poisonings.
One issue when analysing data on the regions of the Russian North is the changing status of the autonomous okrugs. During the Soviet period, the autonomous okrugs were administratively subordinated to their parent oblasts or krays and often socioeconomic data for them were not shown separately. During the period of increased autonomy for regions in the early 1990s, the autonomous okrugs were at the same level as oblasts, krays and autonomous republics at a level called “subjects of the federation” of which there were 89. In 2006, six of the autonomous okrugs in the Arctic and Siberia were merged with their parent oblasts and became municipal districts. Data for them are subsumed with the larger region and not shown separately. For the Russian North, this applies to the Taymyr Autonomous Okrug, Evenki Autonomous Okrug and Koryak Autonomous Okrug. The other autonomous okrugs have retained their autonomy and data are shown for them.
Results
The population of Russia was growing during most of the Soviet period. The population size peaked in 1993 at 148.6 million and then declined by 6 million to a low of 142.7 million in 2009 before beginning to increase. In 1992, the number of deaths began to exceed the number of births; ever since, Russia experienced a negative natural increase. In the two decades from 1992 to 2011, Russia witnessed 13.3 million more deaths than births. During that period, there was a net immigration of 7.8 million individuals into the country. This decline was disproportionally of the male population, causing the sex ratio to decline from a peak of 88.4 males per 100 females in 1995 to 86.0 in 2009 before starting to slightly increase.
The population of the Russian North grew considerably during the Soviet period from a combination of both inmigration and natural increase. The population of the Russian North, as defined here, grew from 1.8 million at the time of the 1926 census to 9.5 million at the time of the 1989 census. During the 1980s, the population continued to grow from a combination of these two factors. The population of the North peaked in 1990 and the peak for most northern regions was 1989–1991. The overall net outmigration has been the driving force behind the population decline in the North, which turned from positive to negative in 1989, and peaking in 1992, the year when prices were liberalised and the economic transition started. The number of deaths began to exceed the number of deaths in 1993 and natural increase stayed negative until the mid-2000s. Between 1989 and 2010, the population of the North declined by 1.6 million, from a combination of a net outmigration of 1.7 million and a small natural increase of 91,000.
Changing sex composition of the Russian North
At the time of the 1989 census, there were 87.7 males for 100 females in all of Russia. The northern regions form a distinct geographical block all of which had much higher male sex ratios than the national average. (Fig. 2(a), all three maps are shown with the same scale to facilitate comparison. These maps differ from the pan-Arctic map shown in Fig. 1. The sex ratios shown in Fig. 2 are relative to the Russian average.) For the North as a whole, the ratio of males per 100 females was 100.9, almost parity but significantly higher than the national level. The ratio of males to 100 females in the North in 1989 ranged from 90.2 in the Republic of Karelia to 111.0 in Chukotka, the latter being the highest ratio of any region in the country. The sex ratios at the regional level reflect sex-selective patterns of migration, differences in male and female mortality and historical sex ratios. The regional pattern is one of a predominantly male periphery and predominantly female core. The map shows regional sex ratios relative to the national average, not to parity. A number of regions in central Russia had male–female sex ratios below the national average. These regions contain a large portion of the country’s population and are thus reflective of the national ratio. The reason behind the low male–female sex ratios in these regions is the same as for the country, very low male–female sex ratios following World War II and high male mortality. In 1989, the Ivano oblast had the lowest male–female sex ratio in country, 81.2 males per 100 females, or roughly four males for every five females. Moscow (81.4 males per 100 females) and St. Petersburg (81.9 males per 100 females) had low sex ratios close to this level. Moving out from this core is a group of regions with sex ratios close to the national average. Moving further north and east towards the periphery, the sex ratios are predominantly male.
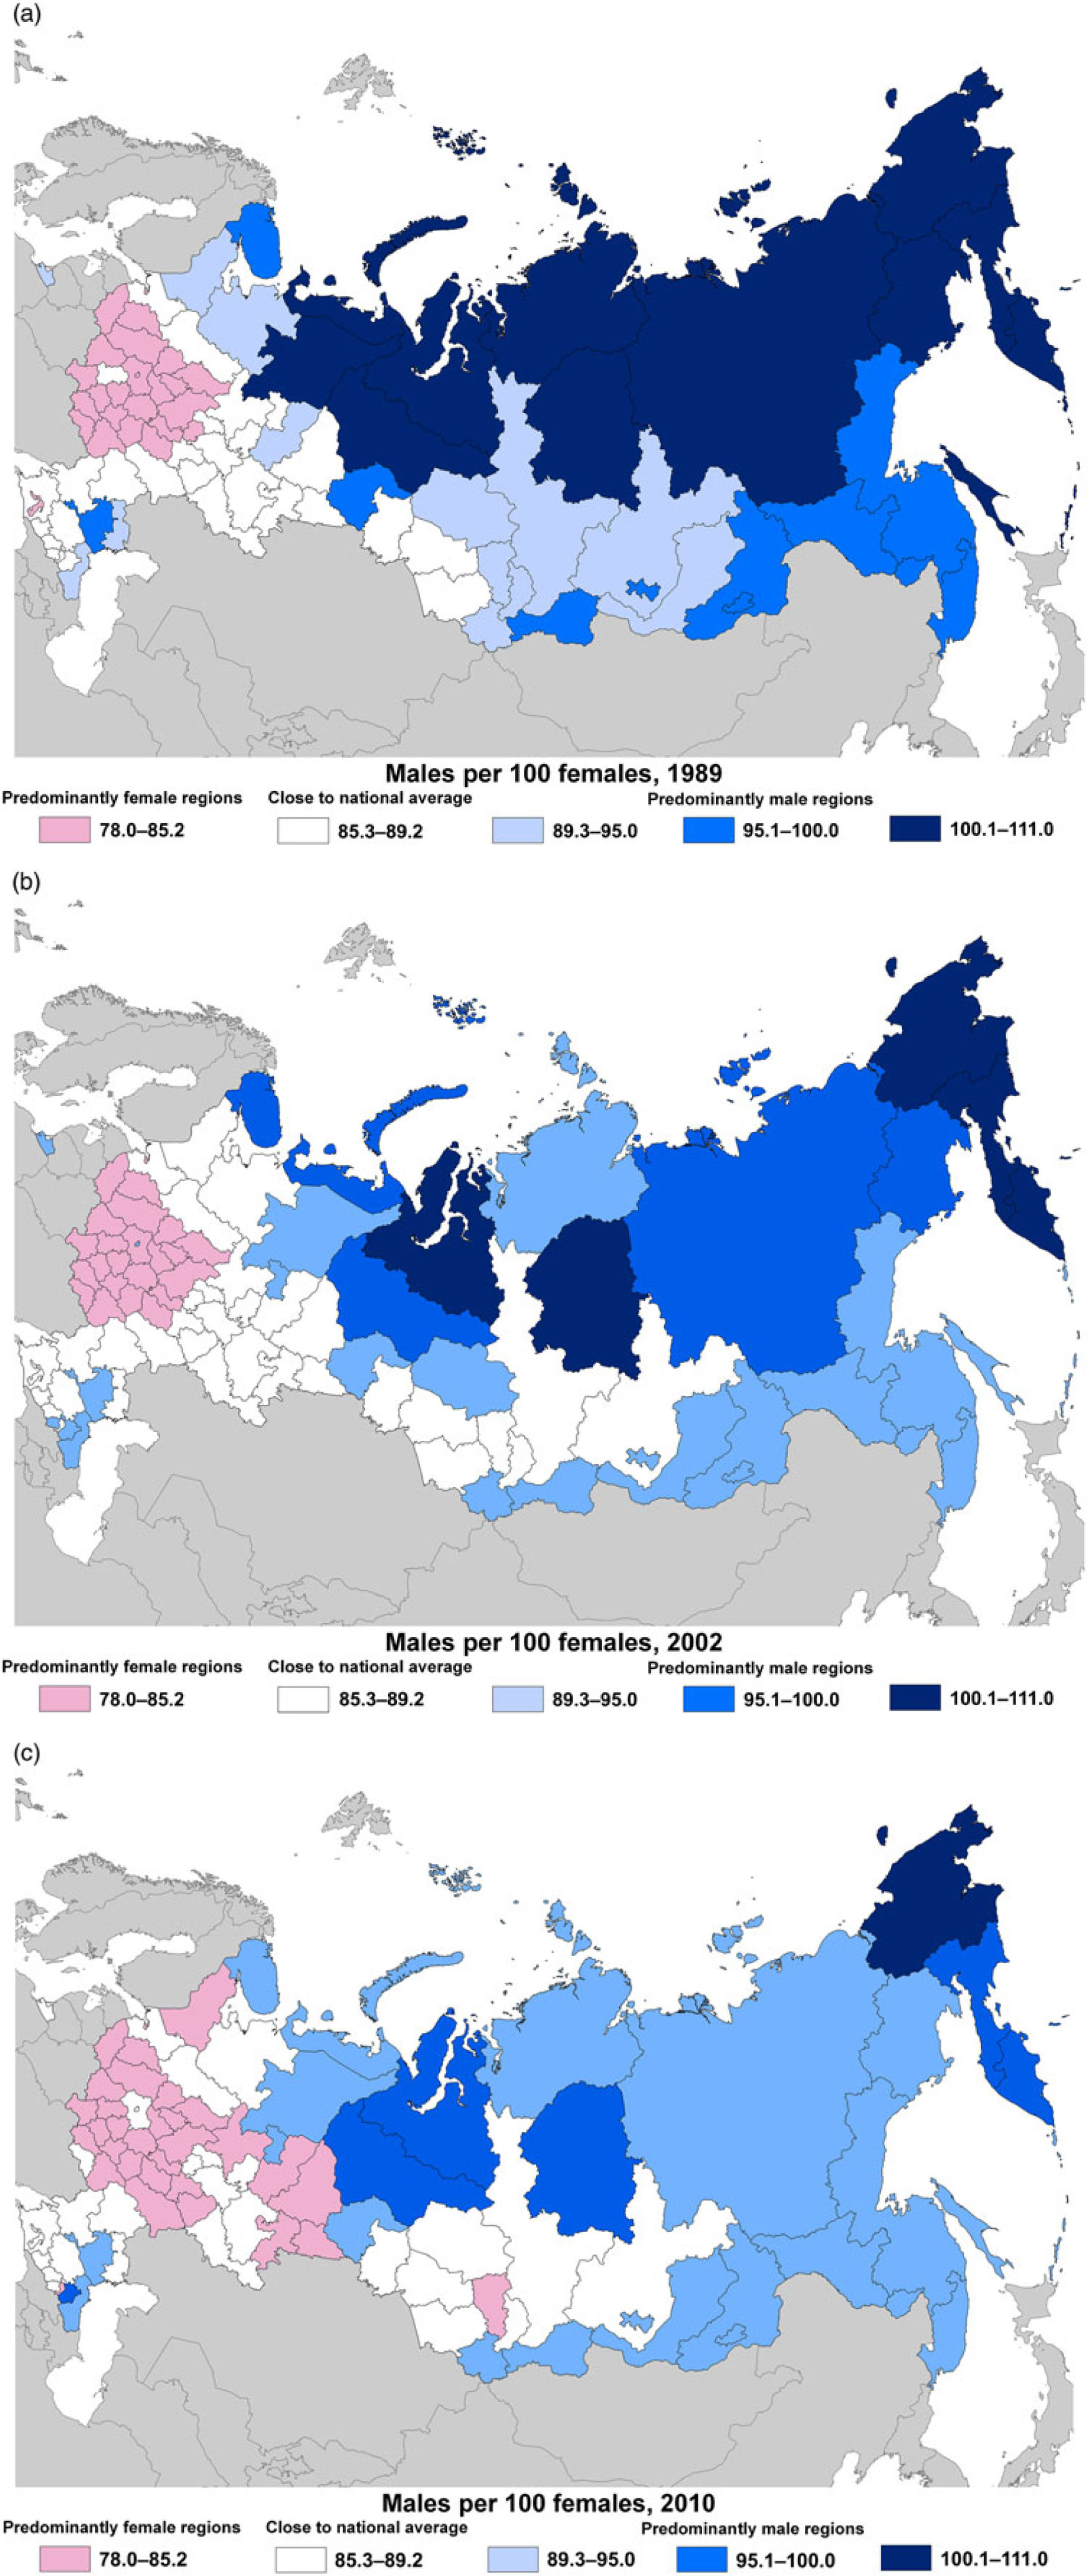
Fig. 2. Sex ratio by region in Russia: (a) 1989, (b) 2002 and (c) 2010.
At the time of the 2002 census, the ratio of males to 100 females had fallen slightly to 87.4 for all of Russia. However, the decline in the number of males in the North was much steeper, falling to 94.8 (Fig. 2(b)). There were declines in the number of males in every northern region with the largest declines in the Nenets Autonomous Okrug, from 107.2 to 97.2 males per 100 females and in the Taymyr Autonomous Okrug, from 106.1 to 93.8 males per 100 females. Moscow city had the largest increase going from 81.4 males per 100 females in 1989 to 91.2 in 2002. Moscow had the largest absolute population increase in the country, as a result of large-scale inmigration, which was obviously predominantly male.
The decline in the percentage of male continued into the 2002–2010 census period. For Russia, the percentage of male declined to 86.1 males per 100 females and for the North, even further to 92.2. The same pattern of decline in the male sex ratio in every northern region continued (Fig. 2(c)). Overall for Russia for the entire 1989–2010 period, there was a slightly larger percentage decline in the male population compared to the female population. The male population in Russia declined by 5.0%, while the female population declined by 2.9%. This was due to the widening gaps in life expectancy between the sexes that occurred in the country during this period, especially during the 1990s. However, in the North, the population decline between the sexes was even greater, by 20.0% for males and by 13.3% for females.
The regional trend of decline in the male sex ratio in the northern and Arctic periphery regions also continued. Only a few regions had increases in the male–female sex ratio and these were rather small. Many of the periphery regions in the North, Siberia and the Far East continued to have large decline in their male–female sex ratios, though these declines were generally smaller compared to that during the 1989–2002 census period. Chukotka had the largest decline, going from 110.9 males per 100 females in 2002 to 100.4 males per 100 females in 2010. In spite of the decline, it remained the only region in Russia where males outnumbered females.
This paper has two main research and policy questions, one to quantify the large decline in the male sex ratio in the regions of the Russian North during the first two decades of the post-Soviet period, and two, to understand the causes of this large decline. To determine this, population change by sex is disaggregated into natural increase (decrease) and net migration. This is done to determine whether the decline in the male sex ratio in the Russian North was caused primarily by differential natural increase or net migration. There are well-documented differences between the sexes in terms of patterns of disease and death which result in differential life expectancy and over time, increasingly unbalanced sex ratios. Social and economic factors influencing migration are also not gender neutral and rarely does any migration stream have an equal number of males and females.
When examining the differences in population decline by sex and trying to explain the larger decline in the male population, the initial hypotheses was that with the shrinkage of the northern economy, men would be more affected than women and migrate out of the region in larger numbers. However, when disaggregating population by sex into natural increase and net migration, it becomes clear that the major driving force behind the larger male population decrease was a substantially higher natural decrease compared to females.
The male population in the North declined by 904,000 from net outmigration, a 19% decline. The female population in the North declined by slightly less, 804,000, a 17% decrease. This pattern of roughly similar population decline between males and females from net migration occurred in every northern region between 1990 and 2010 (Fig. 3). This is similar to Russia as a whole where the population increase from net inmigration to the country was roughly the same for males and females.

Fig. 3. Change from net migration in the Russian North, 1990–2010.
However, when examining natural increase or decrease by sex in the North, substantial differences were observed. For males in the North, 87,000 more deaths than births were reported; while for females, 179,000 more births than deaths were reported. Every northern region had the same pattern of large differences between the sexes in terms of the contribution of natural increase or decrease (Fig. 4). In some regions, females had higher natural increase than males, in other regions females had natural increase while males had a natural decrease; and in those regions where both sexes had more deaths than births, the excess of deaths over births for males was larger than for females. For all of Russia, the natural decrease in the male population (6.9 million) was larger than the natural decrease in the female population (5.7 million) but the difference was rather small in terms of percentage.

Fig. 4. Change from natural increase in the Russian North, 1990–2010.
Population change by component by sex for the period 1990–2010 is shown in Figure 5. As can be seen, the major driver of the overall population change in the North has been net outmigration with the peak being in 1992 and a slowdown, albeit still negative outmigration at the end of the 2000s. While males left in slightly larger numbers compared to females, the wider gap between the sexes was natural increase, which was positive for females for the entire period but negative for males for most of the period. Thus, only one quarter of the differences in population decline between the two sexes in the North can be attributed to the differences in rates of outmigration. About three quarters of the differences in population decline between the sexes during this period is attributable to excess mortality of males. Thus, this was not a story of men positively coping with the changing economic and social situation in the north by migrating out of the region to new economic opportunities but rather negatively coping with the situation by dying prematurely. The relative contribution of natural increase and net migration to changing sex ratios by region can be seen in Figures 3 and 4. This pattern of natural increase (or decrease) accounting for most of the difference in the sex ratios over the period was the same across the North, with differential natural increase accounting for between half and all the differences. The only exceptions were the smaller autonomous okrugs (Nenets, Taymyr, Evenki and Koryak) where the changes in the sex ratios were less.
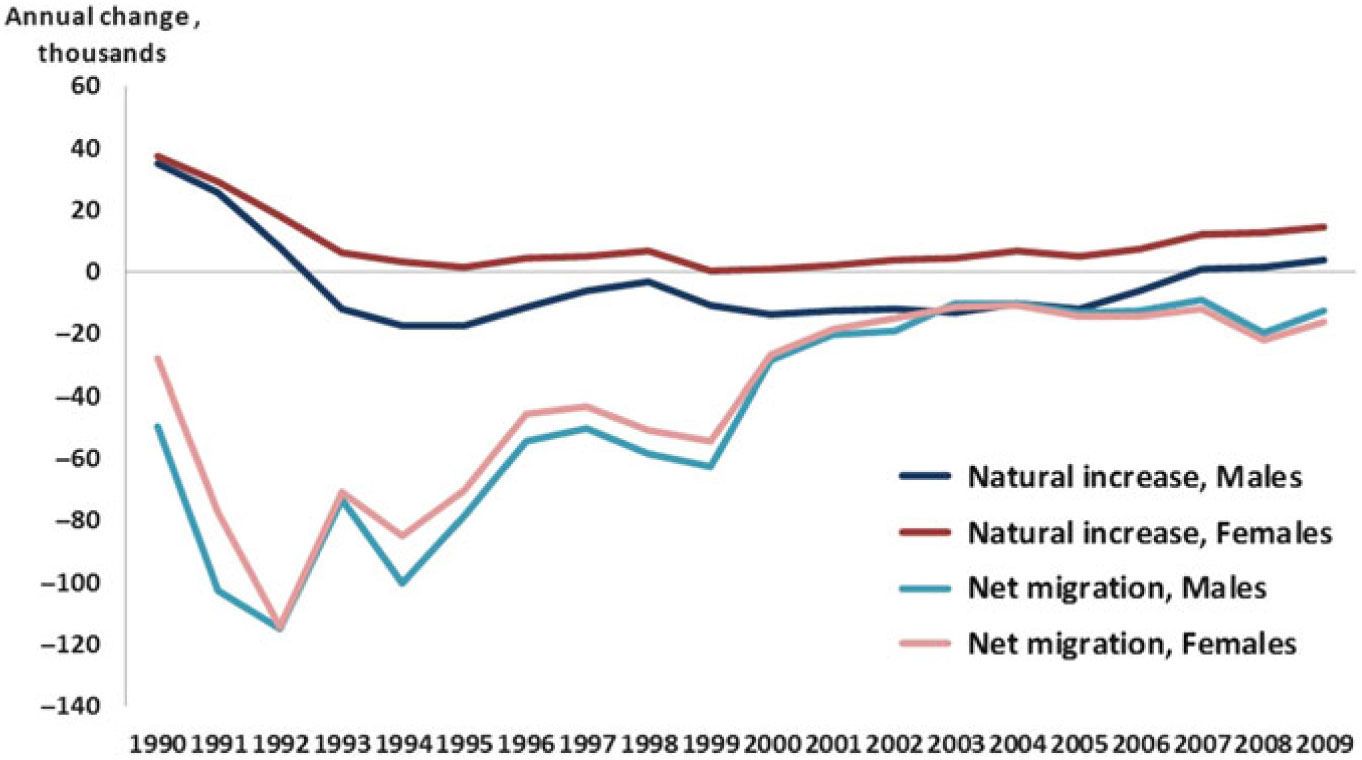
Fig. 5. Population change by component by sex in the Russian North, 1990–2010.
Life expectancy in the Russian North
Mortality in Russia is characterised by two distinct features. The first is a much lower level of life expectancy than expected, given the country’s level of development, making it a “point off the curve” in comparison to other countries. The second is extremely wide gaps in the levels of life expectancy between males and females, which for most of the period since the breakup of the Soviet Union have been among the highest in the world. The highest life expectancy during the Soviet period was in 1986–1987, during the period of the anti-alcohol campaign, when the level for both sexes combined was above 70 years and the gender gap was less than 10 years. The anti-alcohol campaign of 1985–1988 reduced state alcohol production and sales, reduced the distillation of samogon (home-made alcohol) and developed compulsory treatment for alcoholism (Shkolnikov & Nemstov, Reference Shkolnikov, Nemstov, Bobadilla, Costello and Mitchell1997). The campaign prevented between 433,000 and 779,000 male deaths and between 181,000 and 476,000 female deaths. In that year, life expectancy for males was 64.9 and for females was 74.6 and the female advantage was 9.6 years.
In 1989–1990, just prior to the breakup of the Soviet Union and the start of the transition period, life expectancy had fallen slightly to 64.0 years for males and 74.4 years for females and the female advantage had widened slightly. In the northern regions for which data were available, the life expectancy for both males and females was just slightly lower than the national average, and the gender gaps were about the same as the national level (Table 1). (Data for the autonomous okrugs are not available for all years.) It was during the first half of the 1990s that life expectancy fell precipitously, and the gender gap increased significantly, reaching a peak of 13.6 years in 1994. In 1995, all northern regions had life expectancy levels below the national average for both sexes. Life expectancy levels were lower in regions in the Far East and the female advantage was less. In Sakhalin, life expectancy was 50.7 years for males and 60.7 years for females, respectively, 8 and 11 years lower than the national levels, in a country with extremely low levels.
Table 1. Life expectancy in the Russian North by sex, 1990–2010 (at birth, years)

Sources and notes.
Goskomstat Rossii, Demograficheskiy yezhegodnik Rossiyskoy Federatsii (selected years).
– not available.
By 2000, the worst of the transition period was past and life expectancy had begun to recover slightly. The gender gap for Russia remained about the same level. In some northern regions, the gender gap widened, whereas it narrowed in other regions. For all but a few northern regions, life expectancy for males remained below the national average. In 2002, the first year for which data for all northern regions, including the autonomous okrugs, were available, a rather grim picture emerges regarding mortality in the north. In all but the two resource-rich regions of West Siberia, Khanty-Mansiy and Yamal-Nenets Autonomous Okrugs, life expectancy for males was well below the national average. In some of the smaller okrugs with higher shares of indigenous peoples, male life expectancy was below 55 years. Chukotka stands out with a steep decline in life expectancy to 53 years from 62 years among males since 2000, and to 64 from 74 among females.
By 2005, life expectancy started to increase in females but not in males. In most northern regions, the gender gap increased. In some regions, the gender gap increased to extraordinary levels, especially in regions with less population. In that year, in the Nenets okrug, women outlived men by an astonishing 17 years and in the Koryak okrug by 16 years. Given that Russia, during this period, had the widest gender disparity in life expectancy in the world, it is likely that the disparities in these northern regions were the largest female advantages compared to other regions in the world. By 2010, life expectancy had increased for both sexes in Russia and the gender gap had narrowed slightly. The gender gap had narrowed in most northern regions but remained wide, over 10 years in all but one region. In the northern regions where the bulk of the population reside, males continued to have much higher levels of mortality and lower levels of life expectancy compared to females, demonstrating that their ability to cope with stress brought about by the transition was less than that in females.
Death by cause in the Russian North
The previous section showed the extremely wide disparities in life expectancy by sex in the Russian North during the 1990s and 2000s. This section examines the differences in causes of death between men and women to be able to understand the factors driving the wide differences. Published data are available on the cause of death by region by sex by broad category for selected years between 1990 and 2010 persons in the working ages (males 16–59 and females 16–54). The years chosen were the beginning, middle and end of this period. The year 1993 was included because of data availability, it was near the nadir of life expectancy in post-Soviet Russia and the male–female life expectancy gap was at its widest.
Data for Russia and selected northern regions are shown in Figure 6. Given the large gaps in life expectancy, it is no surprise that death rates in the working ages also differed considerably. In 2000, the death rates in Russia for males of working ages were four times that of females, 1,149 deaths per 100,000 persons versus 298. The differences in the causes of death between the sexes and those which widened the most during the worst years of the transition period are diseases of the circulatory system and external causes of death. Circulatory system diseases include heart diseases, strokes and heart attacks and are often caused by stress. Accidents, poisonings and injuries are referred to as external causes of deaths and include murders, suicides, alcohol poisonings, drowning, drug overdoses and other sudden deaths of an undetermined nature. These are causes most associated with the extreme psychosocial stress that men in the Russian North face and they were unable to find positive coping skills. For Russia, there were differences in all causes of death, all of which increased during the transition period. The differences in the diseases of the circulatory system increased sharply between 1990 and 1993 and stayed at about that level. There was almost a doubling of the difference in external causes between 1990 and 1993 which has fallen back to the same level since then.
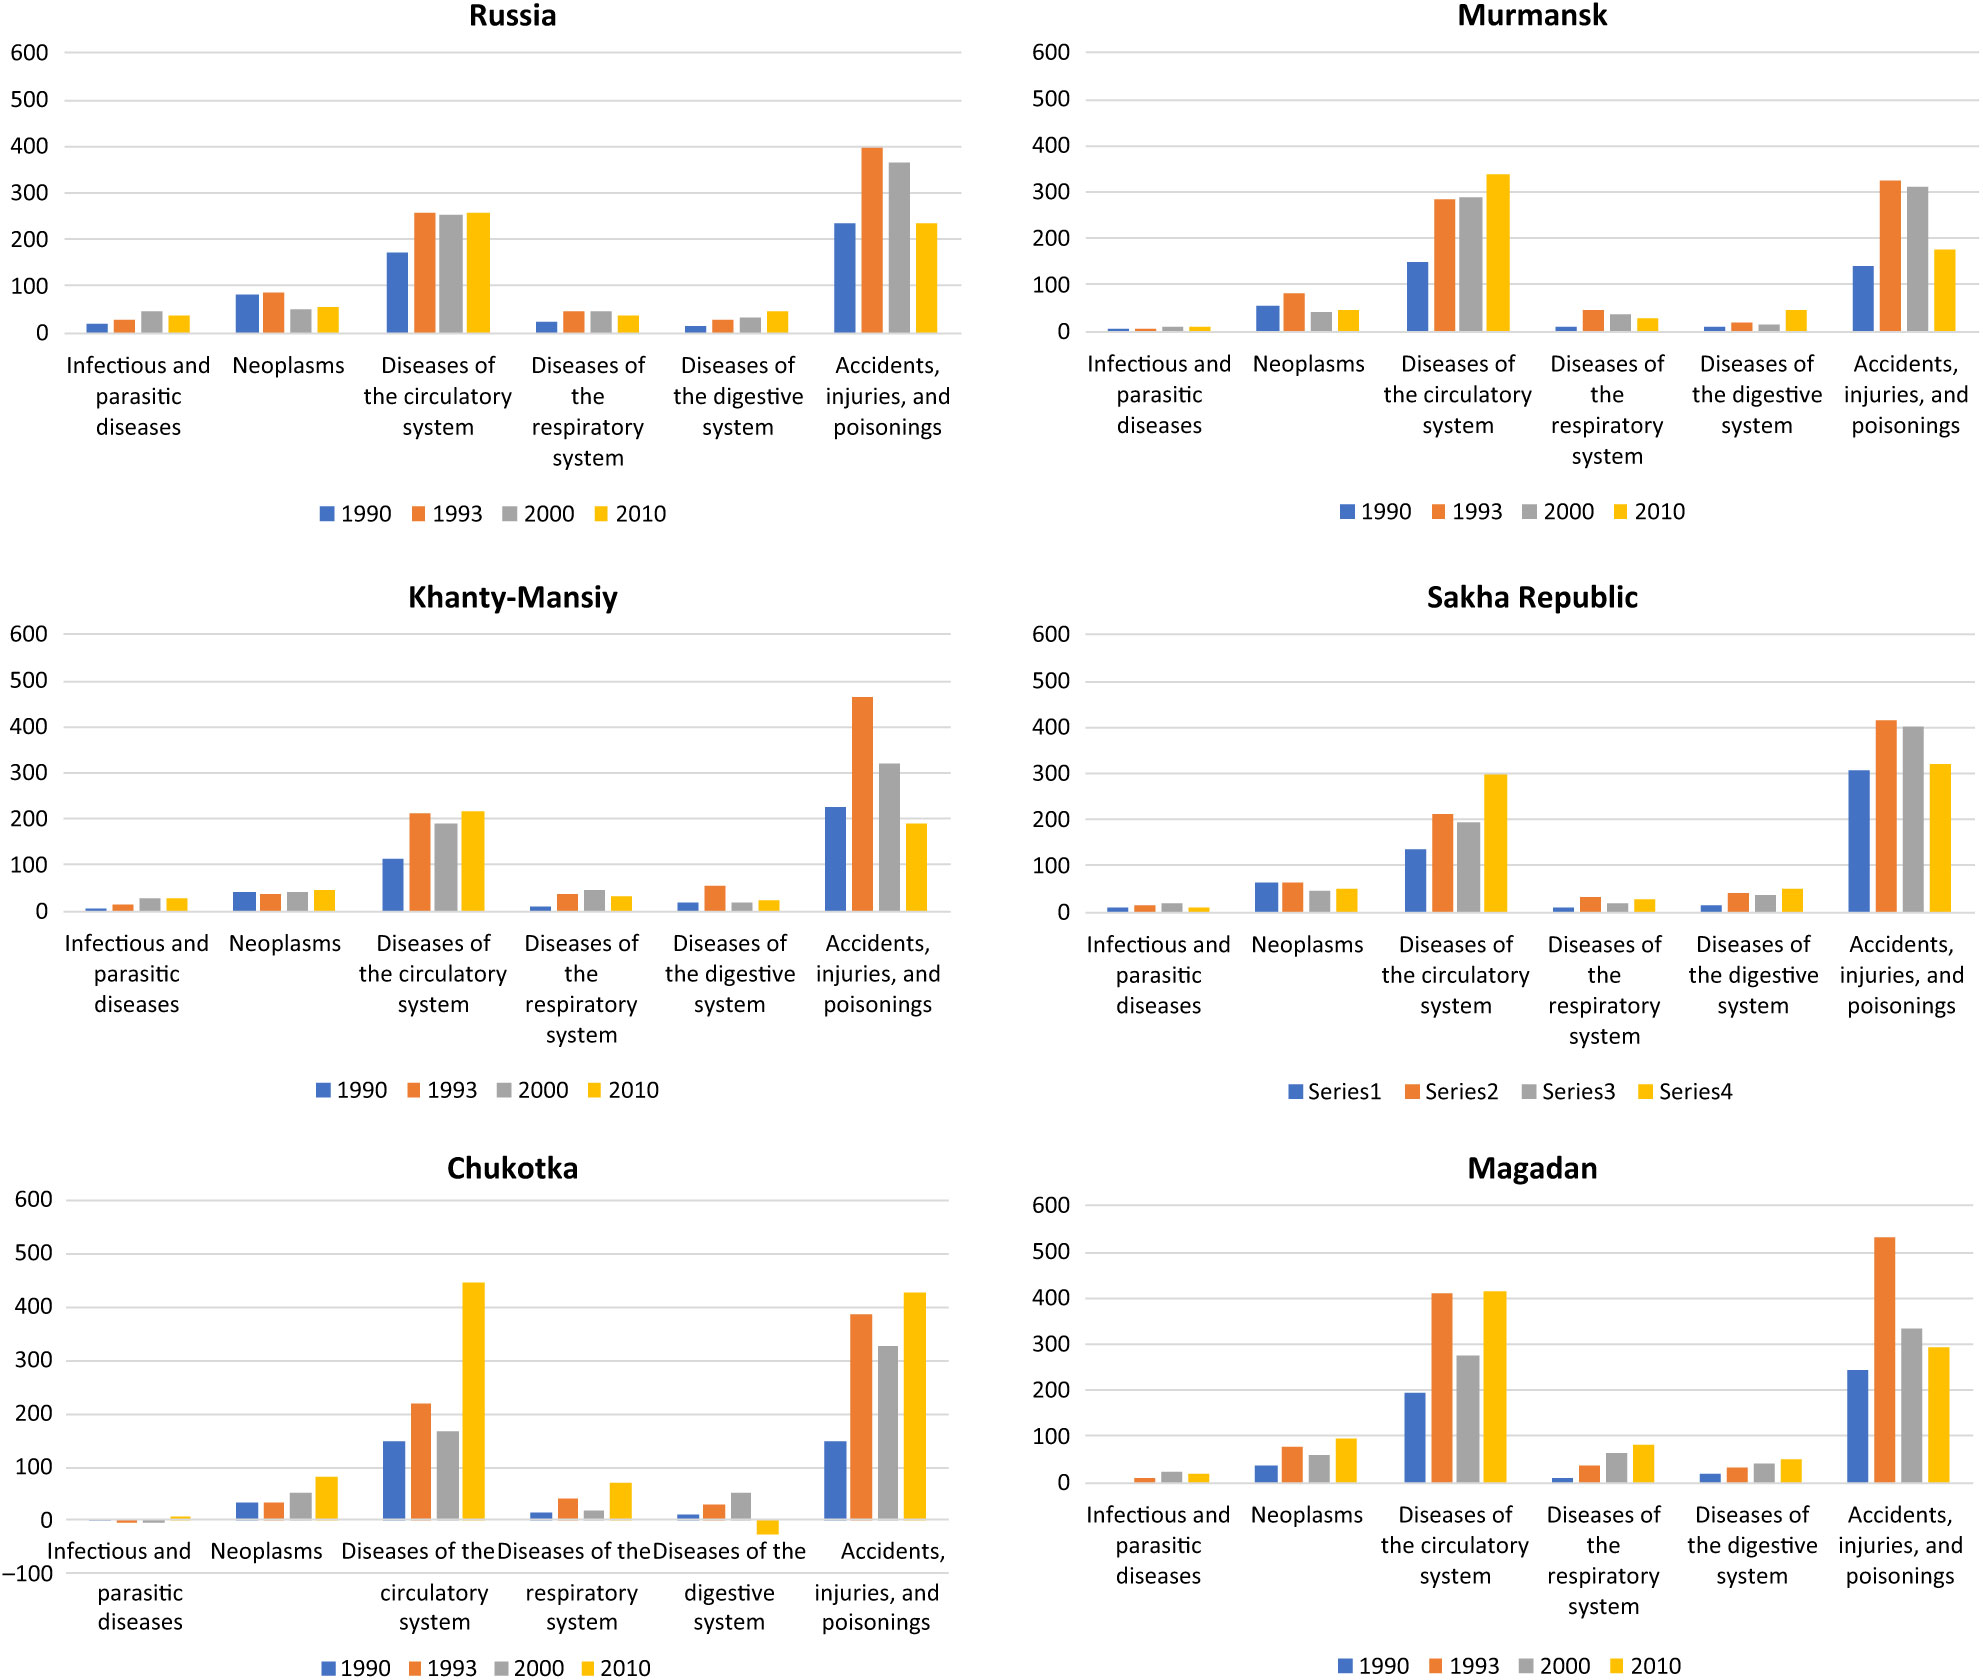
Fig. 6. Sex differences in death rates by cause in the working ages for selected regions of the Russian North, selected years from 1990 to 2010 (per 100,000 people)
For Murmansk, the overall death rate in the working ages was higher than the national level but the gender difference was about the same. The sex differences in the diseases of the circulatory system increased to a level higher than that in Russia, and the differences from the external cause showed the same sharp increase in the early 1990s before declining. The Khanty-Mansiy okrug is the centre of Russian oil production and is an example of a northern region that has become rather prosperous in the post-Soviet period. The overall death rate in the working ages is lower than the national level and the sex differences are smaller. Differences by the main causes are smaller and the differences for external causes fell sharply to 2010 and are lower than the national average. In Yakutia, the overall mortality rate and the gender differences are higher than the national average. Gender differences from heart and circulatory system diseases continued to increase to 2010.
Chukotka is the region that has seen perhaps the most dramatic impacts of transition in the Russian North and where the overall and gender differences from mortality are highest. Since 1989, outmigration of the population was three quarters. This resulted in the indigenous population increasing from 10% in 1989 to 33% in 2010, as much of the outmigration was of the Slavic population. In 2010, the mortality rate in the working ages was double the national average. Deaths from circulatory diseases for both sexes are the highest in the country and the gender gap is the widest. The levels and gender gap for external causes are the highest in the country and unlike for other regions, the gender gap continued to increase to 2010. Magadan, which borders Chukotka in the northeast, also has a higher than average mortality rate with wide sex differences. Unlike Chukotka, the sex differences from external causes have narrowed. A similar pattern of high and widening differentials between males and females in the working ages for these two causes of death was seen across the Russian North, demonstrating that stress-induced mortality affected men more than women.
Discussion
The previous section has shown that males in general in Russia but particularly those in the Russian North coped worse to the new social and economic conditions than women. The high levels of male mortality in the Russian North during the post-Soviet period were a little-publicised public health crisis. The previous analysis focused on behaviours that ultimately resulted in death and did not include actions that resulted in injury or disability. In the face of severe economic and social stress, why did females cope better compared to men? Did men in Russia have more difficulties finding their place compared to women (Povoroznyuk, Habeck, & Vate, Reference Povoroznyuk, Habeck and Vate2010)? Other research has examined the gender shift in the Russian North and its demographic consequences including increased alcohol consumption, especially binge drinking, which resulted in increased levels of premature death, especially among young people. Men’s status as fathers, hunters and breadwinners was lost in the immediate post-Soviet period in many northern regions. Many of the explanations behind the excess male mortality in Russia during the 1990s and 2000s were amplified in the Russian North by region-specific issues. These included the withdrawal of much state support to northern development, the closure or abandonment of many settlements, large-scale outmigration from many northern regions. There were the psychological effects of men being recruited to “conquer” the harsh conditions of the North under Communism and then having that system abandoned almost overnight.
Women are more educated and were better able to find different employment in new economic conditions. This included finding jobs in the larger settlements within the regions of the Russian North. Especially indigenous women had positions requiring formal education (Povoroznyuk et al., Reference Povoroznyuk, Habeck and Vate2010). Among indigenous communities, women lead stable lives with good jobs in towns, while men remained in the tundra or taiga when they could not find unskilled employment in larger settlements. This unemployment often led to alcoholism and various other physical and psychological stresses. In Yakutia at around the year 2000, 86% males was drug addicts, 81% alcoholics and 72% HIV positive (Vinokurova, Reference Vinokurova2010). This pattern of women adapting better than men to changed or different circumstances has been noted in other Arctic regions (Hamilton, Reference Hamilton, Huskey and Southcott2010; Hamilton &Rasmussen, Reference Hamilton and Rasmussen2010). While women in other Arctic regions cope by migrating to better opportunities, men in the Russian North did not adapt to rapid social and economic changes.
Current mortality situation in the Russian North
While life expectancy remains below levels in countries at similar income levels, there have been recent impressive gains; that is, in 2012, life expectancy was over 70 years for the first time in Russian history. While female advantage in life expectancy has narrowed somewhat, women in Russia still live more than 10 years compared to men. This gap is one of the largest in the world and contributes to the overall low life expectancy. In 2017, life expectancy among men in Russia increased to 67.5 years and in women to 77.6 years, both are the highest levels in Russian history. However, for all northern regions but the Khanty-Mansiy and Yamal-Nenets okrugs, male life expectancy remains below the national levels and the female advantage is higher than the national level. Thus, males in the Russian North continue to suffer the effects of the transition period.
It appears that there is a growing middle class in Russia who not only care about the future of their own country but also about their own futures and are emulating the habits of their counterparts in other developed countries and taking better care of their own health. Within parts of the north such as Yakutia, more recently there appears to be a shift towards a softer manifestation of masculinity. This includes less hard drinking and street fighting. Yakutia has imposed strict regulations on the sale and consumption of alcohol (Ventsel, Reference Ventsel2018). The increase in income in Yakutia and elsewhere has brought about interest in western style consumption and healthy lifestyles. There is certainly awareness of the demographic situation in Russia and steps are being taken to improve it. National policies are aimed at reducing smoking and drinking, improving road safety and the healthcare system. While none of these are specifically targeted at northern regions, if implemented successfully, they will go a long way towards improving the mortality situation in the region, especially of males.
Acknowledgements
The author would like to thank Olivia Napper, Department of Geography, George Washington University, for her research assistance with this article and to Eeva Turunen and Shinan Wang of Nordregio for producing the map on gender by region for the Arctic.
Financial support
Research for this article is part of a project titled Polar Peoples: Past, Present, and Future supported by a grant from the US National Science Foundation, Arctic Social Sciences Program (award number PLR-1418272).


