


Introduction
The Nazi ghetto system was one of the main vehicles for the persecution of Jewish and other peoples in German-occupied Europe in World War II (Michman and Schramm Reference Michman and Schramm2011). The ghetto system extended across a swathe of Eastern Europe and consisted of thousands of urban districts and other locations—the exact number is still uncertain—in which Jews and others were confined for the purpose of segregating them from the rest of the population (Megargee and Dean Reference Megargee and Dean2012; Megargee et al. Reference Megargee, White and Hecker2018; Miron Reference Miron2010). The first ghetto was established at Piotrków Trybunalski, Poland, in October 1939. Thereafter, large metropolitan ghettos were established in many cities of German-occupied Eastern Europe, notably in Lódź and Warsaw in 1940; Białystok, Kraków, Lwów, Minsk, Riga, and Vilna in 1941; and, somewhat later, Budapest in 1944 (Cole Reference Cole2003; Epstein Reference Epstein2008; Gutman Reference Gutman1982; Horwitz Reference Horwitz2008). The systematic liquidation of the ghettos began in the winter of 1941–42 with the implementation of the Final Solution, resulting in the death of millions by way of immediate killings and mass deportations to the death camps at Auschwitz, Bełżec, Chełmno, Majdanek, Sobibór, and Treblinka (US Holocaust Memorial Museum 2015a).
In their book Geographies of the Holocaust, Anne Kelly Knowles and colleagues observe that the Holocaust was “a profoundly geographical phenomenon, though few scholars have analyzed it from that perspective” (Knowles et al. Reference Knowles, Cole and Giordano2014: 1; see also Charlesworth Reference Charlesworth1992). Transport and confinement—twin pillars of the Nazi ghetto system—were intrinsically geographical matters that operated on scales from the international to the local and that shaped the demographic and epidemiologic character of Jewish ghettos across Eastern Europe (Gilbert Reference Gilbert2009; Knowles et al. Reference Knowles, Cole and Giordano2014; Megargee and Dean Reference Megargee and Dean2012; US Holocaust Memorial Museum 1996). In this article, we use geographical methods of map-based visualization and spatial analysis to aid an understanding of the intrinsic links between the demographic and epidemic histories of the “model” camp-ghetto at Theresienstadt (Terezín in Czech) in the erstwhile German Protectorate of Bohemia and Moravia (figure 1).Footnote 1 Our study presents the first detailed graphical reconstruction of the geographical pattern of transports of Jewish prisoners to the ghetto, their shifting demographic structure and their association with outbreaks of communicable diseases that were carried through Theresienstadt’s demographic revolving door—the Schleuse (“floodgate”). We show how, in the highly controlled environment of Jewish prisoner transports from cities across Nazi Europe to the ghettos, and then on to the extermination camps, communicable diseases traveled with the prisoners and contributed to the Holocaust’s turbid mix of illness and death.
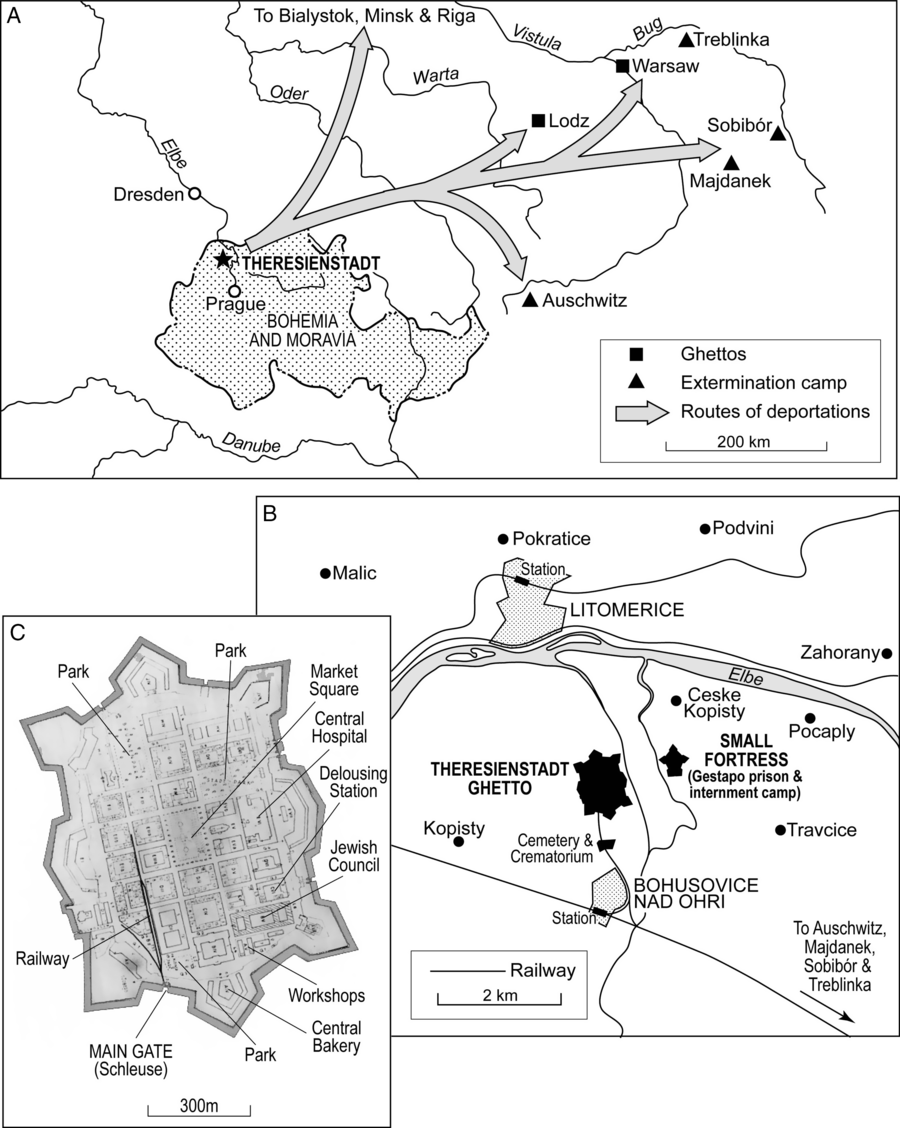
Figure 1. Theresienstadt camp-ghetto. (A) Location of Theresienstadt, situated some 65 km to the north of Prague. The principal routes of deportations to other ghettos (including Riga, Warsaw, and Łódź) and extermination camps (including Auschwitz) in the period 1942–44 are indicated. (B) Theresienstadt ghetto and environs, 1944. (C) Annotated plan of Theresienstadt ghetto, summer 1944.
Theresienstadt was the last of the substantially populated Nazi concentration camps and ghettos to be liberated by the Allies (May 8, 1945); see Stone (Reference Stone2015).Footnote 2 The present study is a contribution to commemorations of the 75th anniversary of that historic event. The study is informed by recent scholarship on aspects of medicine, health, and disease in Theresienstadt (Horáčková et al. Reference Horáčková, Hrstka, Grulich and Hlaváčková2017) and by a recognition that the medical histories of those interned in the ghettos have been largely overlooked in Holocaust research (Hájková Reference Hájková2018). Our study is also informed by an increasing public health concern with genocidal violence as “one of the most pressing threats to the health of populations in the twenty-first century” (Adler et al. Reference Adler, James, Paul and Larson2004: 2028; see also: Fein Reference Fein1997; Krug et al. Reference Krug, Dahlberg, Mercy, Zwi and Lozano2002; Willis and Levy Reference Willis and Levy2000). Mass population dislocation and communicable diseases are—by accident or design—frequent manifestations of such violence (Smallman-Raynor and Cliff Reference Smallman-Raynor and Cliff2018: 242–69). Our study highlights the importance of a geographical understanding of the intersection of these factors when attempting to comprehend the demographic and public health impacts of genocidal events.
Background: The Theresienstadt “Model” Camp-Ghetto
Theresienstadt ghetto was established by the Nazis in the main fortress of the garrison town of Theresienstadt in November 1941 (figure 1). Perspectives on the ghetto, its organization and daily life are provided in the survivor accounts of Lederer (Reference Lederer1953), Adler (Reference Adler1955, Reference Adler2017), and Troller (Reference Troller1991). As the term “camp-ghetto” implies, Theresienstadt was a hybrid space that differed in kind from the major urban ghettos of Warsaw, Lódź, and elsewhere in German-occupied Eastern Europe (Megargee and Dean Reference Megargee and Dean2012). As Blodig and White (Reference Blodig, White, Megargee and Dean2012) observe, Theresienstadt functioned as a reception, holding, and transit camp and this has led some observers to view it as a form of “concentration camp.” By contrast, the forced removal of Theresienstadt’s non-Jewish Czech inhabitants by June 1942 was consistent with its commonly held status as a “ghetto” (Blodig and White Reference Blodig, White, Megargee and Dean2012: 180). More generally, Prochnik (Reference Prochnik1945: 6) has divided the history of Theresienstadt under Nazi control into four broad phases: (1) Arbeitslager or “labor camp” (November 1941–June 1942); (2) ghetto (June 1942–May 1943), encompassing the designation of Theresienstadt as an Altersghetto or “ghetto for the aged”; (3) Jüdisches Siedlungsgebiet or “Jewish settlement area” (May 1943–April 1945); and (4) Liquidierung or “liquidation” (from April 1945). A similar classification, albeit with some differences in timings (most notably, with the phase of the Jüdisches Siedlungsgebiet ending in September 1944) has been proposed by H. G. Adler; see Blodig and White (Reference Blodig, White, Megargee and Dean2012: 180).
In terms of command and control, Theresienstadt was subordinate to the SS-operated Central Office for Jewish Emigration (Prague) that, in turn, reported to SS-Obersturmbannführer Adolf Eichmann at the Reich Security Main Office (RSHA) in Berlin (US Holocaust Memorial Museum 2015c). The primary pupose of the camp-ghetto was to concentrate the Jewish population of Prague and all other parts of the Protectorate of Bohemia and Moravia in preparation for deportation to the East. Deportations from the ghetto began in 1942, variously to other ghettos (including Łódź, Riga, and Warsaw) or directly to the extermination camps at Sobibór, Majdanek, Treblinka, and Auschwitz (figure 1A). The final liquidation of the ghetto commenced in the autumn of 1944, with transports to Auschwitz occuring every 1–3 days in late September and early October (Lederer Reference Lederer1953: 232–38). All told, some 140,000 Jews were transported to Theresienstadt during the course of the war, of whom more than 88,000 were subsequently deported and almost 34,000 died in the ghetto in consequence of starvation, disease, and other causes. The remainder were resident when the ghetto was finally liberated in the spring of 1945 (Fischel Reference Fischel1998; Hájková Reference Hájková2018; Prochnik Reference Prochnik1945; US Holocaust Memorial Museum 2015c).
Allthough Theresienstadt was—first and foremost—a desperately overcrowded waystation for those destined for the East, Holocaust scholars have placed emphasis on the portrayal of Theresienstadt as a “model camp” by the Nazi propaganda machine (see e.g.: Farré and Schubert Reference Farré and Schubert2009; Margry Reference Margry1992, Reference Margry1999; Woolford Reference Woolford2010). A number of prominent members of the intelligentsia were interned there and, as part of a Nazi “embellishment project,” some cultural activities (including live theater, orchestral and choral concerts, and poetry recitals) were tolerated by the captors (Intrator Reference Intrator2004; Karas Reference Karas1985; Lederer Reference Lederer1953: 125–30; Modlinger Reference Modlinger2010; Rovit Reference Rovit2000). The ghetto’s physical appearance was also improved at one stage in its existence, all in an attempt to delude the outside world that life there had some sort of approximation to normality. Such was the façade in June 1944 when the German authorities permitted Dr. Maurice Rossel, Swiss delegate of the International Committee of the Red Cross (ICRC), to visit the ghetto. As François Bugnion explains of this episode:
In the the weeks preceding Rossel’s visit the ghetto had been carefully refurbished and flower beds planted. Everything was done to give the impression that the Jews spent happy and peaceful days under the benevolent gaze of their German protectors, and this was certainly the image it projected, not so much in Dr Rossel’s report following the visit, but in the photos and water colour sketches which accompanied it. (Bugnion Reference Bugnion2003: 239)
In the event, Rossel was unable to talk privately to any of the residents, and the ICRC refused to pass on their report to either the German authorities or the Allies (Bugnion Reference Bugnion2003: 239–40).
Data Sources
Notwithstanding the efforts of the Nazis to sequestrate and destroy records and documents relating to Theresienstadt (along with other sites associated with Nazi atrocities) in the latter months of the war, sufficient records were preserved by members of the Jewish Council and other parties and organizations to permit a reconstruction of transports, demography, and communicable diseases in the ghetto. Our examination draws on two primary archival sources: (1) the compiled correspondence and statistical records of Theresienstadt held in the Archives du Comité International de la Croix-Rouge (ACICR), Geneva; and (2) the statistical compilation of demographic, health, and disease records prepared by Robert Prochnik under the title Židé v Terezíně: Statistické Sestavení (Jews in Theresienstadt: A Statistical Report) and dated July 1945 (Prochnik Reference Prochnik1945). We consider each data source in turn.
-
(i) ACICR, Geneva. The relevant records are collected in two folders (ACICR G59/12-368, G59/12-369) and comprise delegate reports, official correspondence, and notes on activities in connection with the ghetto and its liberation. Included in the second folder is a diverse collection of statistical summaries, plans, reports, and related materials for the period 1941–45. These documents had been gathered by Paul Dunant, ICRC delegate, around the time that the ghetto had come under the protection of the ICRC in May 1945 (Lederer Reference Lederer1953: 191). Among these latter documents are systematic tabulations of arrivals/departures of transports to/from Theresienstadt in the period November 1941–April 1945. The records run to more than 900 entries over 40 pages and include information on the place of assembly of each transport, the number of males and females by age cohort (0–14 yrs, 15–45 yrs, 46–60 yrs, and 61 yrs and over), and, where applicable, the official transport identification code.
-
(ii) Prochnik’s statistical compilation (Židé v Terezíně). Robert Prochnik was an Austrian Jew and close associate of Dr. Benjamin Murmelstein (Chief Rabbi of Vienna and, later, Judenältester of Theresienstadt) who was detained at Theresienstadt from October 1942. From September 1943, Prochnik assumed responsibility for the ghetto’s transport logistics and was, in practice, the last Jewish official to be seen by many of the ghetto’s deportees. In the closing months of the war, when the German authorities attempted to destroy materials that contained the personal records of prisoners, Prochnik and others succeeded in preserving many of the records (Prochnik Reference Prochnik1945; Rabinovici Reference Rabinovici2011). After the liberation of Theresienstadt in May 1945, Prochnik continued to work in the central secretariat of the ghetto, during which time he used the preserved records as the basis for his 38-page statistical compilation Židé v Terezíně. The compilation includes, inter alia, tabulations of the ghetto’s demographic structure, prisoner arrivals and departures, housing, overcrowding, health conditions, and morbidity and mortality. Data are variously presented for daily, monthly, six-monthly, and annual intervals and extend from November 1941 to June 1945.
Given the prominent administrative roles of both Dunant and Prochnik in the weeks and months after the liberation of the ghetto, we can speculate that the lists of transports found in the ICRC records were among the documents that had been preserved by Prochnik. More generally, Prochnik acknowledged that his statistical report was reliant on occasionally fragmentary demographic, health, and disease records, although he considered such limitations to be relatively minor in the broad depiction of the demographic and epidemiological history of 140,000 Jews (Prochnik Reference Prochnik1945: 2). Indeed, Prochnik’s records subsequently assumed considerable importance as official registers and were used, inter alia, in the identification and arrest of SS officers and former Theresienstadt guards (Rabinovici Reference Rabinovici2011: 180).
Transports and Demography
To deconstruct the geographical patterns and demographic composition of the transports, we draw on the camp records in ACICR (G59/12-369.01, 369.03). The records span a 42-month period, from the arrival of the first transport (originating from Prague and designated Aufbaukommando I or “AK I” by the German authorities) on Monday, November 24, 1941 to the arrival of the last transport (XXVI/4 from Sered’ in the Slovak Republic) on Saturday, April 7, 1945. For each transport, information on the date of arrival/departure, the place of assembly/destination, and demographic (gender and age) structure was abstracted to form a geocoded database of transports. This database was supplemented by information from the International Institute for Holocaust Research’s Shoah (Holocaust) Deportation Database (International Institute for Holocaust Research 2017) and the statistical compilation of Lederer (Reference Lederer1953: 199–262). Consistent with the records of the ACICR, a “transport” was defined in the database as any discrete and documented arrival or departure of one or more prisoners and for which a transport code was typically allocated (including discharges, escapees, fugitives, and transfers involving the state police). So defined, the resulting database included records of 904 transports of widely varying size (1–5,000 people), divisible into 649 transports into the ghetto and 255 out (table 1).
Table 1. Summary details of transports to and from Theresienstadt, November 24, 1941 to April 7, 1945

1 The enumerated departures include a small number of escapees (38 persons involved in 29 recorded episodes).
Morbidity, Mortality, and Communicable Diseases
The geocoded database of transports was linked to statistical information on cause-specific morbidity and mortality in Theresienstadt, 1941–45, assembled by Prochnik (Reference Prochnik1945: 26–37). We supplement this information with case data on a specific epidemic outbreak documented by Vojtěch Adalbert Král (Reference Král1947) and with contextual information on the general health conditions of the ghetto included in the survivor account of Zdenek Lederer (Reference Lederer1953: 135–44, 263–5).
Transports, Demography, and Disease
Before the ghetto was established in late 1941, the resident population of Theresienstadt was 3,700 (Lederer Reference Lederer1953: 2). Once the ghetto was formed, an average of 35,000 people were interned in Theresienstadt at any one time, with the population exceeding 58,000 in September 1942.
The Geography and Demography of Transports
What were the geographical patterns of the transports that brought the Jews to Theresienstadt? Figure 2 is based on the place of assembly of transports and plots the number and demographic composition of people who were removed to the ghetto, November 1941–April 1945. The map provides a sense of the long geographical reach of the ghetto and the cosmopolitan mix of nationalities, cultures, and languages of Jews that came to characterize the ghetto’s social space (Lederer Reference Lederer1953: 54–55). The dominance of local transfers from Prague, Brno, and other towns and cities in the Protectorate is apparent, as is the large number of transfers from Austria (Vienna) and from all parts of Germany. Elsewhere, the role of Westerbork as a gathering point for Jewish prisoners in Holland is also clear. Underpinning this broad geographical mix, figure 2 also shows that there was a female bias everywhere; men were needed elsewhere for forced labor and were underrepresented in the transports to Theresienstadt.
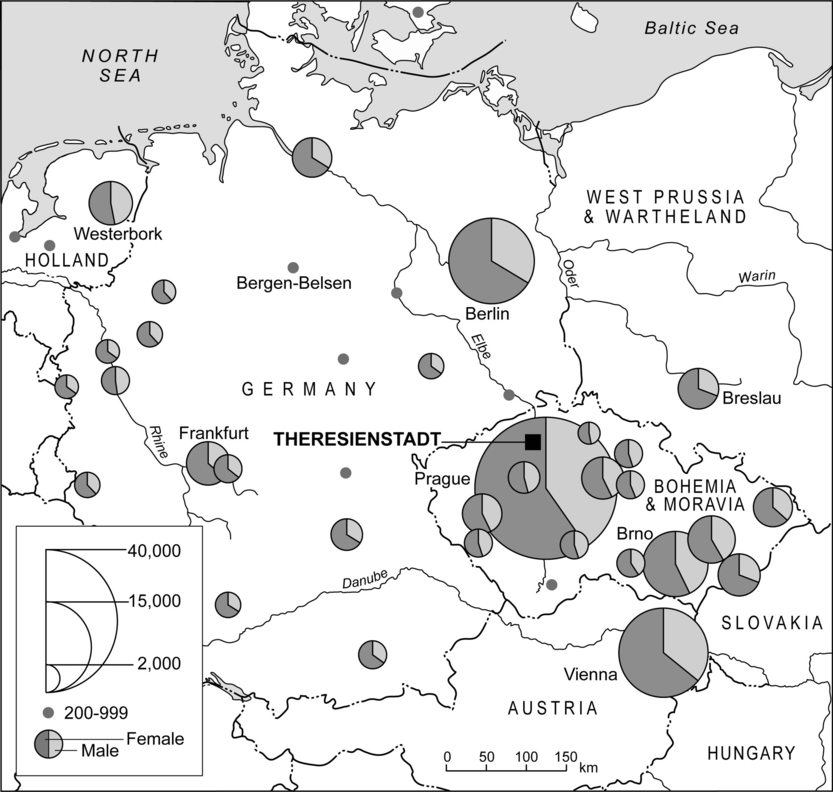
Figure 2. Number of prisoners transported to Theresienstadt, November 1941–April 1945. The divided proportional circles give, by gender, the numbers transported from each assembly point in Nazi-controlled Europe. Note that assembly points involving <200 prisoners are not shown.
Until May 1942, transports to Theresienstadt reflected the initial intention to concentrate the Jewish population of Bohemia and Moravia and, as such, were dominated by Jews of all ages from Prague and other places in the Protectorate (figures 3 and 4). Beginning in June 1942, however, the demographic structure of Theresienstadt’s population began to change (figure 5). The origins of this transition can be traced to the Wannsee Conference (January 1942) and the pronouncement of SS-Obergruppenführer Reinhard Heydrich that Theresienstadt would be designated as an Altersghetto (“ghetto for the aged”) to accommodate older, privileged, and famous Jews from Germany and Austria (Woolford Reference Woolford2010). Between June and September 1942, almost 40,000 such individuals—mostly over the age of 60 years—arrived on more than 130 transports from Berlin, Vienna, and elsewhere (figure 3).

Figure 3. Monthly time series of arrivals at Theresienstadt by country of origin of transports, November 1941–April 1945.

Figure 4. Age-sex structure of arrivals at Theresienstadt from six European countries, November 1941–April 1945.

Figure 5. Time series of prisoner arrivals at Theresienstadt, November 1941–April 1945. The stacked line graph plots the percentage of arrivals by age cohort.
The very high deaths rates that resulted from the gross overcrowding of the elderly arrivals from Germany and Austria, combined with additional arrivals and deportations to the East, resulted in a reshaping of the age-sex pyramid in the latter months of 1942 (figure 6). Writing of the developments, Zdenek Lederer observes how:
At the end of September [1942] the number of prisoners over sixty-five years of age had been reduced to 45 per cent of the Ghetto population; further deportations and deaths reduced the figure to 33 percent at the end of December 1942. Thus death, deportations and the arrival of further transports augmented the number of young prisoners (from sixteen to forty-five years) from 23 per cent … at the end of September to 29 per cent at the end of December; the corresponding figures for the age group from forty-five to sixty-five years were 26 per cent at the end of September and 31 per cent at the end of December. (Lederer Reference Lederer1953: 51)

Figure 6. Age-sex structure of Theresientadt’s population at sample points in time. The selection of sample points has been determined by data availability.
The appointment of Anton Burger as Commandant of Theresienstadt in the mid-summer of 1943 followed a six-month period when new arrivals were comparably few in number (figure 3). Burger’s appointment effectively marked the onset of Theresienstadt’s incarnation as a Jüdisches Siedlungsgebiet or “Jewish settlement area” (Prochnik Reference Prochnik1945: 6) and so began one of the most notorious exercises in Nazi ghetto propaganda. With the implementation of the aforementioned “embellishment project” (Lederer Reference Lederer1953: 88–121), the deceit of Theresienstadt as a model Jewish settlement was played out on both film and during the aforementioned ICRC visit in June 1944 (Farré and Schubert Reference Farré and Schubert2009; Margry Reference Margry1992, Reference Margry1999; Woolford Reference Woolford2010). The decision to promote Theresienstadt as a model settlement necessitated a reduction in the visible misery and overcrowding in the ghetto. The matter was managed locally by selective deportations to the East and resulted in the relative demographic balance of the age-sex pyramid for June 1944 (figure 6) (Lederer Reference Lederer1953: 105–15). Subsequent changes in the ghetto’s demographic structure as depicted in figure 6 were largely associated with the deportation of some 5,000 young males in the early autumn of 1944 (age-sex pyramid for October 1944), ostensibly associated with the concerns of the German authorities over a possible camp revolt (Lederer Reference Lederer1953: 140), and the arrival of prisoners from other camps in the early months of 1945 (age-sex pyramid for April 1945).
To summarize, while deaths and deportations played a pivotal role in determining the demographic structure of Theresienstadt, so too did the demographic composition of prisoner transports from across Nazi Europe—initially from Bohemia and Moravia and proximal countries (Germany and Austria) and then from further afield (West Prussia, Denmark, and the Netherlands) (figure 3). Within this framework, the national age-sex pyramids in figure 4 identify two distinct groups: (1) Austria, Germany, and West Prussia and Wartheland, where females aged ≥61 years were in the majority; and (2) Bohemia and Moravia, Denmark, and the Netherlands where males and females of reproductive and working age group, 15–45 years, were in the majority.
To explore further the underpinning geography of figures 3–6, figure 7 uses techniques of multidimensional scaling (MDS) and cluster analysis to map those locations from which transports mirrored (“similar”) or otherwise (“not similar”) the overall monthly time series of transportees in two sample demographic groups: females aged ≥61 years (figure 7A) and males aged 15–45 years (figure 7B). Analytical details are provided in the Appendix. In brief, the maps in figure 7 were produced in two steps:
-
(i) Step 1: MDS mapping. The concepts that underpin MDS mapping are straightforward (Cliff et al. Reference Cliff, Haggett, Smallman-Raynor, Stroup and Williamson1995). On a conventional geographical map, the relative locations of points correspond to their (scaled) geographical locations. In MDS mapping, the relative locations of points correspond instead to their degree of similarity on some variable measured for them.Footnote 3 In general terms, points that are similar for the variable measured are positioned close to each other in the MDS space, while points that are dissimilar are widely separated. If the MDS configuration is formed in two dimensions (m = 2), the resulting configuration is “maplike” and the location of each point is conventionally specified by xy coordinates. As described in the Appendix, two-dimensional MDS mapping was used in the present analysis to measure the degree of similarity of transport assembly points in terms of the demographic composition (females aged ≥61 years; and males aged 15–45 years) of the associated transports to Theresienstadt. As similarity was measured in terms of the time-series structure of each demographic group (Appendix), it provides a measure of the synchrony of assembly points in the movement of members of that group. Assembly points for which transports had similar demographic structures in time (i.e., synchronous) were positioned close to each other in the resulting two-dimensional space, while assembly points for which the transports had dissimilar demographic structures in time (i.e., nonsynchronous) were distant from each other in the space.
-
(ii) Step 2: Cluster analysis. As an analytical basis for discriminating between “similar” (synchronous) and “not similar” (nonsynchronous) transport assembly points in Step 1, the xy coordinates of points in the two-dimensional MDS spaces were then subjected to a hierarchical (complete linkage) cluster analysis. The principles of cluster analysis are summarized by Everitt et al. (Reference Everitt, Landau, Leese and Stahl2011). At the beginning of the clustering process, each element (here, each transport assembly point) is in a cluster of its own. The clusters are then successively combined into larger clusters in such a way that intragroup similarities in the elements are greater than intergroup similarities. For the purposes of the present analysis, the position of the maximum separation between clusters was then taken as a basis for determining similar (synchronous) and not similar (nonsynchronous) assembly points in terms of the demographic composition of transports.
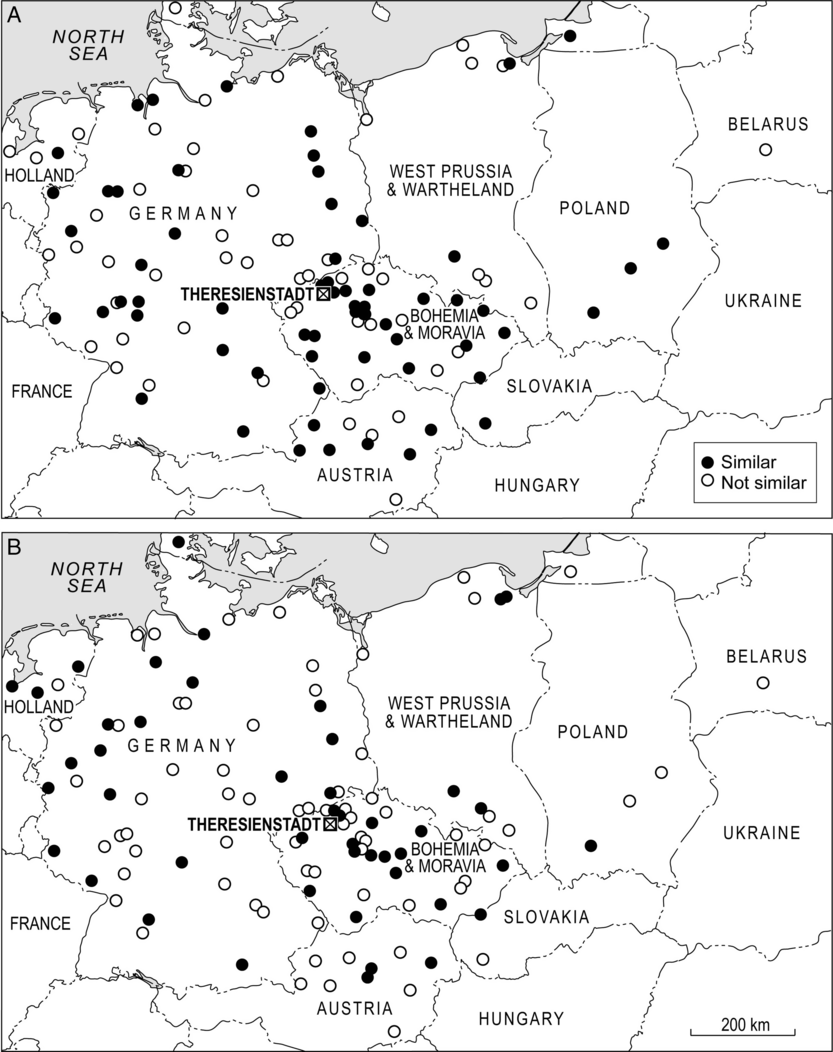
Figure 7. Transports and the demographic structure of Theresienstadt, November 1941–April 1945. The maps are based on techniques of MDS mapping and cluster analysis and show the similarity between the monthly time series of (1) prisoner arrivals from individual assembly locations and (2) all prisoner arrivals at Theresienstadt, irrespective of the place of assembly. Assembly locations are represented by circles that are coded according to a binary classification of “similar” (= synchronous; black circles) or “not similar” (= nonsynchronous; white circles) to all arrivals at the ghetto. (A) Females aged ≥61 years. (B) Males aged 15–45 years.
On this basis, the maps in figure 7 identify those parts of the Reich that were similar/synchronous (black circles) or not similar/nonsynchronous (white circles) in terms of the transportation of older females (figure 7A) and younger males (figure 7B) to Theresienstadt. For older females, the many black circles in figure 7A are consistent with the early designation of Theresienstadt as an Altersghetto and point to a broad geographical synchrony of transports from many parts of the Reich in this phase of the ghetto’s existence. In comparison, the map for younger males in figure 7B shows a less geographically coherent pattern. In addition to Bohemia and Moravia, particular foci of synchronous activity are evident in western Germany and neighboring areas of Holland and Denmark. Many of the transports from the latter two countries arrived at Theresienstadt between November 1943 and April 1944 and the associated representations of the Danish Red Cross and the ICRC to visit the ghetto were to provide an important impetus to the implementation of the ghetto’s “embellishment project” (see, e.g., Lederer Reference Lederer1953: 100).
Transports and Communicable Diseases in Theresienstadt
When combined with insanitary and overcrowded conditions, the near-continuous arrival of transports from all parts of the Reich had a deleterious impact on health conditions in Theresienstadt (Brush Reference Brush2004; Hájková Reference Hájková2018; Hoenig et al. Reference Hoenig, Spenser and Tarsi2004; Lederer Reference Lederer1953: 135–44). Not least, the population flux added to the overcrowding and served in the frequent introduction of all manner of communicable conditions that spread in epidemic form through the ghetto (Král Reference Král1947; Lederer Reference Lederer1953: 135–44). In the words of Hoenig and colleagues:
From a medical perspective, Ghetto Terezín [Theresienstadt] was a disaster. The ghetto quickly became overcrowded with Jews, resulting in epidemics of typhoid fever, scarlet fever, typhus and tuberculosis. Pneumonia, gastroenteritis and cardiovascular diseases claimed many thousands of lives. Food was in short supply and as a consequence malnutrition was common among the ghetto population, often contributing to the high death rate among the ghetto Jews. The first doctors in Ghetto Terezín had no medical equipment or supplies; thus, people with surgical problems such as appendicitis would die because of lack of treatment. (Hoenig et al. Reference Hoenig, Spenser and Tarsi2004: 131)
Some impression of the gross levels of overcrowding can be gained from table 2. For December 1941, Prochnik (Reference Prochnik1945) estimated the population density of the ghetto at 181,500 persons per km2 of living space. With the subsequent arrival of transports (figure 3), the population density grew to a peak of 321,000 persons per km2 in July 1942—well more than 50 times the density of contemporary Prague. Thereafter, with deportations and efforts to create additional living space, table 2 shows that levels of overcrowding reduced progressively to a low of 33,200 persons per km2 in January 1945 (Prochnik Reference Prochnik1945; see also Lederer Reference Lederer1953: 35–56).
Table 2. Population and population density of Theresienstadt at sample points in time

Source: Data from Prochnik (Reference Prochnik1945: 27).
Notwithstanding the overcrowded and insanitary conditions, a well-organized Health Department was established by the self-governing Jewish Council. Among the prisoners, doctors and nurses established hospitals and clinics to treat the sick, while lessons in public health and hygiene were provided to the community (Goldman Reference Goldman1994; Hájková Reference Hájková2018; Hoenig et al. Reference Hoenig, Spenser and Tarsi2004; Horáčková et al. Reference Horáčková, Hrstka, Grulich and Hlaváčková2017). Various measures were implemented to control epidemics, including delousing, the isolation of people with communicable diseases, and measures to promote sanitation and hygiene. To an extent, the SS supported such activities with a view to limiting the risk of disease transmission to the local German population (Hájková Reference Hájková2018). Figure 1C shows, inter alia, the location of the Jewish Council, the main hospital, and the delousing station. In association with these efforts, the average monthly death rate per 1,000 population fell progressively from 30.6 (1942) to 24.2 (1943) and 12.6 (1944) (Prochnik Reference Prochnik1945). Nevertheless, more than 33,000 prisoners died as a consequence of disease, starvation, suicide, execution, and other causes in the ghetto, with enteritis alone claiming some 8,600 lives in the period 1942–44 (Prochnik Reference Prochnik1945).
Documented patterns of mortality in Theresienstadt are summarized in figure 8. As figure 8A shows, mortality spiked at 3,941 recorded deaths in September 1942. This coincided with the time when the ghetto’s population was at a maximum (figure 8A), levels of overcrowding had reached their peak (table 2) and the proportion of older prisoners (≥61 years) among the arrivals was high (figure 5). Thereafter, mortality fell away with the declining population and population density to <1,000 deaths per month from May 1943 and <500 deaths per month from June 1944. Infectious diseases (18,207 deaths) and malnutrition (6,534 deaths) were the most commonly recorded causes of mortality (figure 8B). Some two-thirds of these deaths occurred among females, with gastroenteritis, pneumonia, and other infectious diseases of the respiratory system (including pulmonary tuberculosis) accounting for approximately 50 percent of the documented mortality in both genders (Lederer Reference Lederer1953: 264–65; Prochnik Reference Prochnik1945).
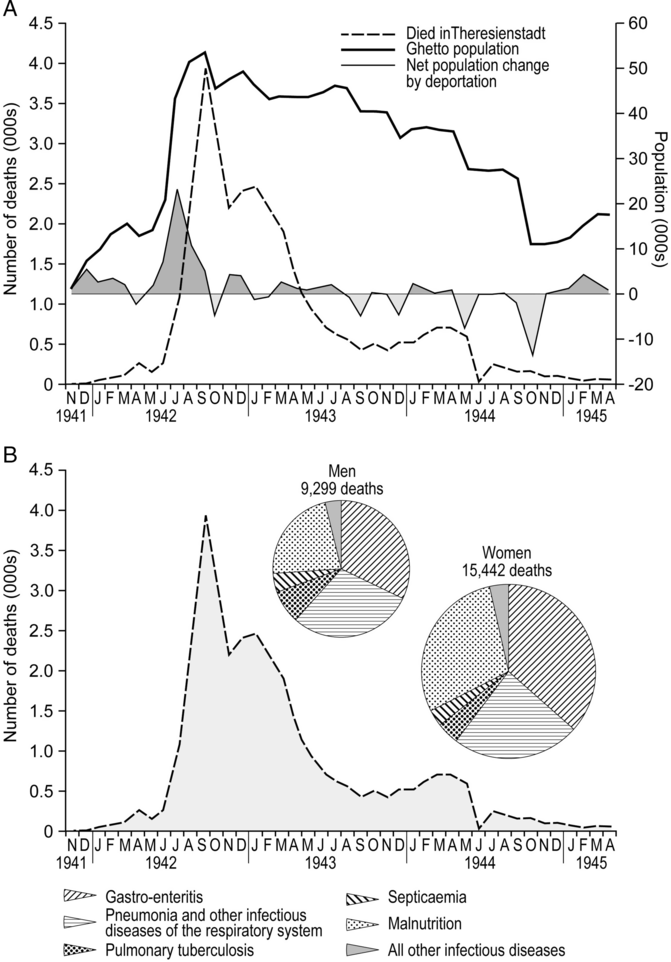
Figure 8. Mortality in the Theresienstadt ghetto, November 1941–April 1945. (A) The heavy line trace tracks the total population of the ghetto on a monthly basis. The shaded line trace shows net population change produced by the prisoner flux. (B) The divided proportional circles show deaths by cause and gender for malnutrition and various communicable conditions; the mortality curve is replotted from graph (A).
The epidemiological record of Theresienstadt began with scarlet fever in the winter of 1941–42 and ended with typhus fever in the late spring and early summer of 1945 (Hájková Reference Hájková2018; Lederer Reference Lederer1953: 135–44). Figure 9 summarizes this epidemic history (figure 9B) in relation to the arrival of transports at the ghetto (figure 9A). Consistent with the view that “most of the contagious diseases were brought into the Ghetto by new transports” (Lederer Reference Lederer1953: 138), the graphs show a clear visual correspondence between the onset of epidemics and the major spikes of arrivals in: (1) the summer of 1942 (conjunctivitis, enteritis, jaundice, pediculosis, pulmonary tuberculosis, and typhoid); (2) the winter of 1942–43 (diarrhoea and diphtheria); and (3) the summer of 1943 (encephalitis and poliomyelitis). In terms of recorded morbidity, communicable diseases were particularly prominent in the main arrival period of 1942–43 (figure 10); this was also the period of greatest mortality in the period prior to the ghetto’s liberation in May 1945 (figure 8B).

Figure 9. The epidemic history of Theresienstadt, 1941–45. (A) Monthly time series of the number of transports arriving at (line trace) and departing from (bar chart) Theresienstadt. (B) Overview of the main epidemic periods, the diseases involved, and the prophylactic history of the ghetto.

Figure 10. For the most frequently occurring communicable diseases at Theresienstadt, graph A plots the annual count of recorded cases while graph B plots the annual case rate per 1,000 persons.
The inferred links between the arrival of transports and the timing of epidemics are corroborated by the survivor account of Zdenek Lederer. Pediculosis (louse infestation), with the attendant risk of typhus fever and other louse-borne diseases, was one of the first communicable conditions to reach epidemic proportions in the ghetto (figure 9B). The infestation was introduced “when several thousands of lice-infected prisoners from Vienna” arrived in the summer of 1942 (Lederer Reference Lederer1953: 142). This influx of new arrivals—some 6,000 in a series of six transports (IV/1–IV/6) from Austria between June 21 and July 29 (ACICR G59/12-369.01, 369.03)—overran the operational capacity of the delousing station and the infestation spread to others in the ghetto (Lederer Reference Lederer1953: 142).
Mysterious contagions also gained entry through Theresienstadt’s Schleuse. A virulent outbreak of an unidentified form of encephalitis in the autumn and winter of 1943 was described in particular detail by the prisoner-doctor, Vojtěch Adalbert Král (Král Reference Král1947; Rollin Reference Rollin1988) (figure 9B).Footnote 4 The source of the outbreak is unknown, although Král observes that the main epidemic was preceded by sporadic cases in the summer months to August. These early cases corresponded with the arrival of almost 4,000 people on a series of transports, primarily from Prague (2,154 persons), Berlin (798 persons), Hamburg (189 persons), Breslau (179 persons), and Vienna (169 persons) amongst other locations (ACICR G59/12-369.01, 369.03) (figure 9A). From a possible introduction with one or more of these transports, the disease acquired epidemic proportions in the winter of 1943–44 and continued to circulate at a lower level until the ghetto was liberated in the spring of 1945 (figure 11A). Demographically, the disease was highly selective. Over 75 percent of the 978 recorded cases were female, with a marked predeliction for those aged 11–20 years; only eight cases were recorded in children aged 10 years or less (figure 11B).
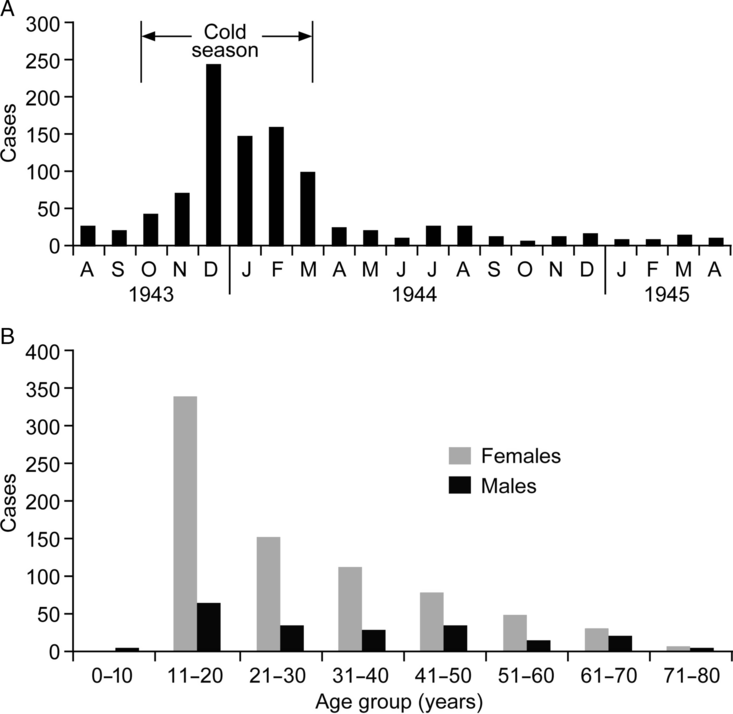
Figure 11. Outbreak of encephalitis in Theresienstadt, summer 1943–spring 1945. (A) Cases by month. (B) Cases by age group and gender.
At the beginning of 1944, while the epidemic of encephalitis was still prevalent, another new outbreak of an infectious disease (diphtheria) was attributed to the transports that arrived from Holland, West Prussia, and from many parts of Germany (ACICR G59/12-369.01, 369.03; Lederer Reference Lederer1953: 142). But, with the Allies advancing in the east and west, it was the spring of 1945, and the arrival of thousands of prisoners who had been hastily evacuated from other camps—variously by train or on foot as survivors of the death marches—that presented one of the gravest communicable disease challenges to the ghetto’s Health Department. The first column of 2,000 reached Theresienstadt on April 20, and another 9,000 followed two days later (Lederer Reference Lederer1953: 185–86). Not only did a considerable proportion of the arrivals present with active pulmonary tuberculosis; they also overwhelmed the capacity of the delousing stations and carried typhus fever into Theresienstadt (figure 9B). From the first documented case of typhus fever on April 24, figure 12A shows that epidemic mortality grew to a peak in the latter half of May when some 20–30 deaths per day were attributed to the disease. The epidemic eventually terminated at the end of June, by which time a documented 2,190 typhus patients had been admitted to hospital and more than 500 patients had succumbed (Prochnik Reference Prochnik1945).Footnote 5 While efforts to contain typhus fever served to interrupt the postliberation repatriation process, Theresienstadt was finally emptied on August 17, 1945 (Lederer Reference Lederer1953: 196–97).
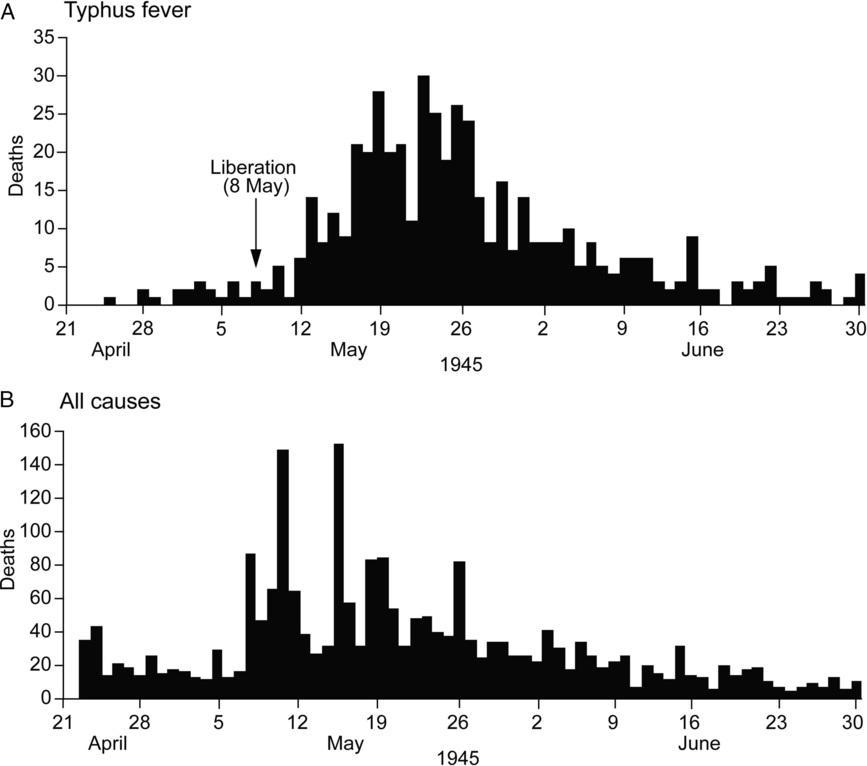
Figure 12. Daily series of deaths by cause in Theresienstadt, April 24 to June 30, 1945. (A) Typhus fever. (B) All causes.
The Geographies of Deportation and Liquidation
Figure 13 maps the geography of deportations from Theresienstadt. As the graph shows, mass deportations began in January 1942, initially to Riga, Lublin, and other ghettos and camps in the north and east and then, from May, directly to the extermination camps at Sobibór, Maly Trostinec, and Treblinka. The first transport for Auschwitz (“Transport By”) left on Monday, October 26, with 1,866 people and, from thereon, Auschwitz became the principal destination for deportees. Some 46,000 residents of Theresienstadt were deported to that place in the 24 months to October 1944, with major spikes of deportations in early and late 1943 and, as the systematic liquidation of the ghetto began, in the autumn of 1944 (ACICR G59/12-369.01, 369.03) (figure 13).
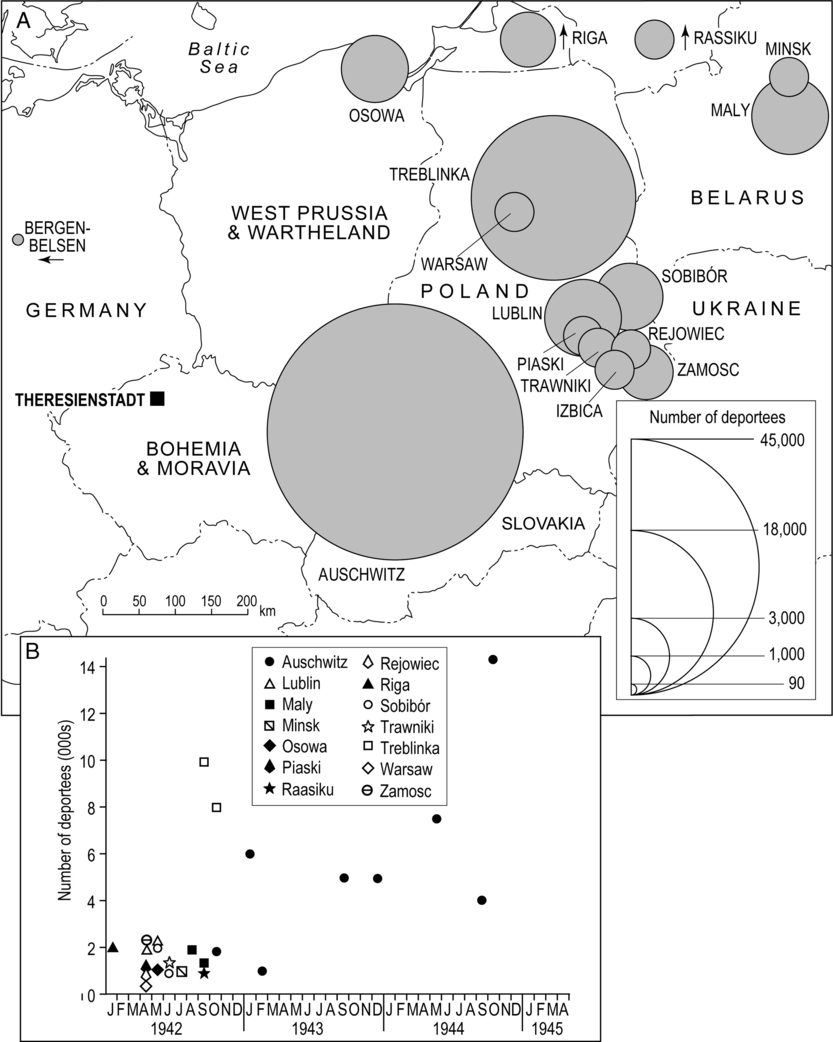
Figure 13. Documented destinations of deportees from Theresienstadt, 1942–45. (A) Total number of deportees by destination over the observation period. (B) Monthly count of deportees by destination.
Specific information on the disease status of the deportees is virtually nonexistent, although it is reasonable to assume that communicable conditions exited the ghetto in the same way that they had entered; through the Schleuse. In some instances, sickness and disease is reputed to have protected the sufferers from deportation and, on occasion, those with specialist knowledge of such conditions—including Adalbert Král—may also have been spared (Lederer Reference Lederer1953: 25; Rollin Reference Rollin1988). But this was not always the case. In the summer of 1944, for example, the decision was taken to deport all patients in the hospital’s tuberculosis ward (Lederer Reference Lederer1953: 25). Indeed, the use of mass murder as a means of infection control was a familiar concept to the Nazis; as Guenter Lewy observes, a similar fate had befallen the residents of the gypsy quarter of Łódź ghetto in consequence of a typhus fever epidemic in the winter of 1941–42 (Lewy Reference Lewy1999; see also, Browning Reference Browning1988, Reference Browning1995).
Conclusion
The complex relationship between ghettos, health policy, and mass murder has featured prominently in historiographical accounts of ghettoization in the Holocaust; see, for example, Cole (Reference Cole2004) and Browning (Reference Browning2005). Drawing on the example of the Warsaw Ghetto, for example, Browning (Reference Browning1988, Reference Browning1995) suggests that health policy was central to the medical rationalization of both ghettoization and the Final Solution. The advocacy of German doctors for ghettoization rested with the prevailing medical view that Jews were natural carriers of louse-borne typhus fever and needed to be segregated for the protection of the rest of the population. When living conditions in the ghettos of Warsaw and elsewhere in Poland resulted in large-scale epidemics of typhus fever in 1940–41, the same doctors were receptive to the implementation of mass murder as a means of disease control (Browning Reference Browning1988, Reference Browning1995). While the Warsaw Ghetto is just one example, and the initial impetus for the creation of ghettos undoubtedly varied in time and space (Browning Reference Browning2005), it is true to say that the ghetto system in Eastern Europe was brutally effective in its promotion of the geographical spread of communicable diseases (Beinfeld Reference Beinfeld1998; Longacre et al. Reference Longacre, Beinfeld, Hildebrandt, Glantz and Grodin2015; Shasha Reference Shasha2002; Weindling Reference Weindling2000). The massing of people in overcrowded and insanitary tenements, barracks, and other buildings provided ideal conditions for the high-level transmission of all manner of infections. In instances such as Theresienstadt, the prisoners were drawn from a variety of epidemiological environments, and their resistance to infection was often compromised by mental and physical stress, trauma, extreme nutritional deprivation, and the deleterious consequences of rapid exposure to multiple disease agents. The lack of medicines, facilities, and equipment, the frequent failure of the captors to assist in the implementation of humane measures of infection control, and the collapse of the conventional rules of social behaviour further compounded the epidemiological dangers of the ghettos (Smallman-Raynor and Cliff Reference Smallman-Raynor and Cliff2004, Reference Smallman-Raynor and Cliff2018). Indeed, it is hard to imagine a system of mass population dislocation and confinement that was more calculated to degrade human health than the Nazi ghetto system of World War II (Longacre et al. Reference Longacre, Beinfeld, Hildebrandt, Glantz and Grodin2015).
As we have already noted, Theresienstadt “camp-ghetto” was a hybrid space—part reception and transit camp and part ghetto—that distinguished it from many of the other ghettos of German-occupied Eastern Europe (Megargee and Dean Reference Megargee and Dean2012). Within the context of this hybrid space, we have used methods of map-based visualization and spatial analysis to aid a geographical understanding of the demographic and epidemiological history of Theresienstadt. We have shown that the “biological space” of the ghetto was the product of complex patterns of prisoner arrivals and departures that, in turn, fed into the successive depictions of Theresienstadt as an Altersghetto and a Jüdisches Siedlungsgebiet. Large numbers of prisoners from across the Reich brought with them the agents of familiar and not-so-familiar diseases, resulting in the frequent epidemiological bombardment of the ghetto’s population. Echoing recent scholarship on public health as a form of Jewish political resistance (Beinfeld Reference Beinfeld1998; Longacre et al. Reference Longacre, Beinfeld, Hildebrandt, Glantz and Grodin2015; Shasha Reference Shasha2002; Weisz et al. Reference Weisz, Grzybowski and Albury2012), the self-governing Jewish Council of Theresienstadt maintained a Health Department that implemented a range of initiatives for the prevention and control of communicable diseases, including health education, patient isolation, and prophylaxis against various diseases (Goldman Reference Goldman1994; Hoenig et al. Reference Hoenig, Spenser and Tarsi2004; Lederer Reference Lederer1953: 135–44). While these activities did limit the opportunities for what Lederer calls “disastrous epidemics,” it remains the case that an average of some 800 people per month died in the ghetto and that more than 20 percent of those who entered Theresienstadt succumbed to starvation, communicable diseases, and other causes before they could be deported to the East (Lederer Reference Lederer1953: 135; Prochnik Reference Prochnik1945).
The public health impacts of genocidal violence are extreme and demand the close attention of health professionals, planners, and policy makers in the twenty-first century (Adler et al. Reference Adler, James, Paul and Larson2004; Fein Reference Fein1997; Krug et al. Reference Krug, Dahlberg, Mercy, Zwi and Lozano2002; Willis and Levy Reference Willis and Levy2000). These health impacts assume special prominence when, as in the Holocaust, famine and communicable diseases are deemed to be legitimate weapons in the persecution of peoples and races (Rummel Reference Rummel1992: 38–39). Framed by the issues of scarcity, crisis, and public health disaster, Longacre and colleagues have drawn an analogy between the ghettos of World War II and the extreme health plight of some refugees and other forcibly displaced populations in recent times (Longacre et al. Reference Longacre, Beinfeld, Hildebrandt, Glantz and Grodin2015). The death of some 50,000 refugees from cholera and other diarrhoeal diseases in the Goma area of Zaire in the aftermath of the Rwandan Genocide (1994) is illustrative (The Goma Epidemiology Group 1995), and underscores the nexus of genocide, forced population displacement, and communicable diseases that we have demonstrated for Theresienstadt and that has profound implications for displaced populations today (Smallman-Raynor and Cliff Reference Smallman-Raynor and Cliff2018: 242–69).
Acknowledgements
This work was supported by a grant from the Leverhulme Trust (RPG-2012-736).
Appendix
This appendix summarizes the operational details of the MDS and cluster analysis that were used in the formation of figure 7. The analysis was performed in two steps:
-
(1) Step 1: MDS. For each of two sample age groups (females aged ≥61 years; and males aged 15–45 years), the Pearson correlation coefficient r was computed between the monthly time series of (i) transportees from each of 121 European towns, cities and other assembly locations and (ii) the total number of transportees (irrespective of place of assembly) in the same age-sex category that arrived at Theresienstadt. All time series were formed over a 42-month period, November 1941–April 1945. The resulting correlation matrices were then analyzed using two-dimensional MDS to yield “maps” of similarities of locations for each of the sample demographic groups. Locations whose time series echoed that of Theresienstadt were positioned close to each other on the MDS maps. Conversely, locations with very dissimilar time series behavior to Theresienstadt were widely spaced. The fitting procedure yielded stress measures of 0.29 (R 2 = 0.56) for females aged ≥61 years and 0.30 (R 2 = 0.48) for males aged 15–45 years.
-
(2) Step 2: Cluster Analysis. For each demographic group, the xy coordinates of locations in the two-dimensional MDS spaces were then subjected to a hierarchical (complete linkage) cluster analysis that yielded the dendrograms in figure A1. These provided a basis for discriminating between “similar” (= synchronous) and “not similar” (nonsynchronous) locations as plotted in figure 7.
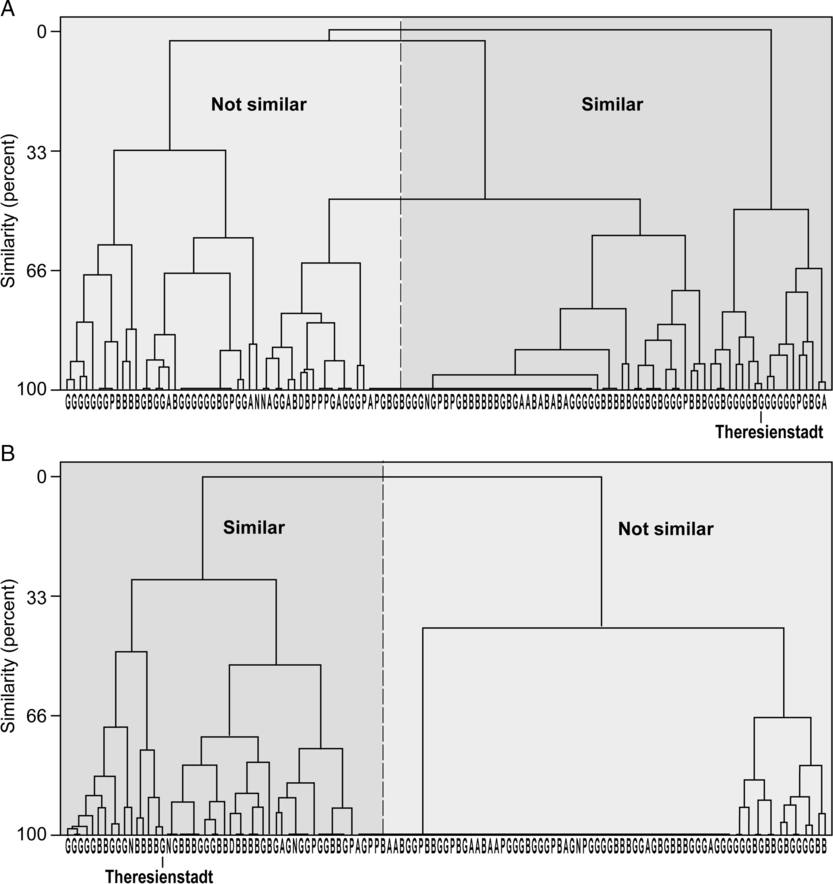
Figure A1. Dendrograms of the similarity between the monthly time series of (1) prisoner arrivals from individual assembly points and (2) all prisoner arrivals at Theresienstadt, irrespective of place of assembly. Assembly points are letter-coded by country on the horizontal axes (A = Austria; B = Bohemia and Moravia; D = Denmark; G = Germany; N = Netherlands; P = West Prussia and Warthland). (A) Females aged ≥61 years. (B) Males aged 15–45 years. The binary classification of “similar” and “not similar” for each demographic group forms the basis of the maps in figure 7.


