


Introduction
As an important food crop, wheat is mostly distributed in the temperate climate region of the Northern Hemisphere (Wang et al., Reference Wang, Gu, Wang and Dong2012). With the gradual warming of the global climate, freezing injury has become the main disaster occurring in the winter wheat region of northern China. When serious freezing damage occurs, it leads to significant losses in crop yield and quality (Frederiks et al., Reference Frederiks, Christopher, Sutherland and Borrell2015; Crimp et al., Reference Crimp, Zheng, Khimashia, Gobbett and Nicholls2016). Therefore, it is of great importance to quickly and accurately determine the severity and distribution of freezing injuries and take active and effective measures to prevent freezing injury. The traditional monitoring and evaluation methods of freezing injury of winter wheat involve measuring the lowest temperature through field observation points or meteorological stations; these methods are complicated and have certain limitations (Feng et al., Reference Feng, Yang, Cao and Ding2009). With the development of remote sensing (RS) technology, all kinds of multiphase, multiresolution, multispectral satellite RS systems bring the advantages of wide monitoring ranges, fast information updates, low costs, objectivity and accuracy, and unlimited study locations; thus, these methods perform better than traditional monitoring methods. With the development of geographic information systems (GIS), crop growth monitoring has developed through the use of RS data by combining global positioning system (GPS) and GIS products. Dong et al. (Reference Dong, Chen, Wang, Gu and Wang2012) evaluated the degree of winter wheat freezing injury with the freezing injury index and found that the change of normalized difference vegetation index (ΔNDVI) had a great linear correlation with the freezing injury index and could effectively be used to evaluate the scope of influence and the degree of the disaster of winter wheat freezing injury. Wang et al. (Reference Wang, Wang, Dong, Gu and Huo2014) proposed a ‘gray’ system model, i.e. one designed to cope with uncertainty in a system, to evaluate the severity of winter wheat freezing injury and monitored the degree and distribution of winter wheat freezing injury with RS and GIS. Kuang et al. (Reference Kuang, Li, Yao and Ding2009) used the normalized difference vegetation index (NDVI) product of the Moderate Resolution Imaging Spectroradiometer (MODIS-NDVI) to monitor the spatial distribution and the disaster area of sugarcane freezing injury; the error in the disaster area calculation was <5%. Wang et al. (Reference Wang, Wang, Huo, Guo and Li2005) established a dynamic monitoring early warning system for agricultural meteorological disasters by combining ‘3S’ (geographic information systems (GIS), global positioning system (GPS), and remote sensing (RS)) technology and ground monitoring. Some researchers have performed extensive research on the RS monitoring of winter wheat freezing injury (Yang, Wang and Pei, Reference Yang, Wang and Pei2002; Feng et al., Reference Feng, Yang, Cao and Ding2009; Wang et al., Reference Wang, Wang, Dong, Gu and Huo2014), mainly by using land surface temperature (LST) inversions to calculate the occurrence level and degree of freezing injury (Gupta et al., Reference Gupta, Prasad, Sesha Sai and Viswanadham1997).
However, the occurrence and severity of freezing injury are not only related to temperature but are also affected by plant varieties, irrigation conditions, and other factors. NDVI has a significant correlation with the growth and yield of winter wheat. The change in NDVI could be reasonably used to represent the severity of a freezing injury (Zhao et al., Reference Zhao, Li, Zhang, Wang and Du2020). With the aggravation of freezing injury, the red-edge region of the reflectance of a winter wheat canopy increases, the green region reflectance decreases, and the red-edge position obviously moves towards the blue band; this is called a ‘blueshift’ (Ren et al., Reference Ren, Feng, Yang, Wang, Liu and Wang2014). This change in spectral reflectance makes it possible to monitor the freezing injury of winter wheat by RS. The NDVI values of winter wheat decrease significantly with the blueshift phenomenon. Certain researchers have used NDVI values obtained from RS data to evaluate the degree of winter wheat freezing injury (Kerdiles et al., Reference Kerdiles, Grondona, Rodriguez and Seguin1996; Feng et al., Reference Feng, Yang, Cao and Ding2009; Wang et al., Reference Wang, Guo, Wang, Huang, Gu, Dong and Xu2013). Remotely sensed vegetation indexes such as NDVI and enhanced vegetation index (EVI) are regarded as reliable indicators for estimating productivity and monitoring vegetation conditions globally (Myneni and Williams, Reference Myneni and Williams1994; Cuomo et al., Reference Cuomo, Lanfredi, Lasaponara, Macchiato and Simoniello2001; Lanfredi, Reference Lanfredi2003; Bascietto et al., Reference Bascietto, Cinti, Matteucci and Cescatti2012). Therefore, the change in the NDVI was used to monitor the occurrence (Jurgens, Reference Jurgens1997) and spatial distribution of Tan et al. (Reference Tan, Ding, Wang, Xin and Ou2008) and to assess the damage caused by freezing crops (Tan et al., Reference Tan, Ding, Wang, Xin and Ou2008; Feng and Yang, Reference Feng and Yang2010).
Since temperature is not the only factor affecting freezing injury, ΔNDVI tends to overestimate the coverage rate of winter wheat before ridge sealing. Many researchers have studied the change vector analysis (CVA) method to estimate the freezing injury of winter wheat. In the CVA method, the change direction and amplitude are obtained by comparing two feature vectors of different time courses (Zhu, Reference Zhu2017). By processing satellite images in different stages, this method can avoid unreasonable classification defects caused by accumulated errors (Zhu, Reference Zhu2017). This method can also reflect the degree and spatial distribution of winter wheat freezing injury and growth recovery and provide a foundation for the monitoring of other crop disasters (Wang et al., Reference Wang, Gu, Dong, Wang, Huang, Guo, Wang and Wang2011). The CVA method has a strong application in dynamic monitoring. Sun et al. (Reference Sun, Yang, Zhang, Pan and Yun2015) found that a combination of map points and CVA can make full use of object-oriented sample land information and can extract crops more accurately on the basis of crop change information when supplemented by a standardized vegetation index. Through a change vector sensitivity analysis, Zhu (Reference Zhu2017) found a great correlation between the total erosion of wheat and the enhancement of the vegetation index.
These two approaches (CVA and ΔNDVI) have been useful for monitoring crop freezing injury and in addition have different characteristics and emphases. Thus far, both approaches have been used independently. The aim of the current study was to study the effects of the freezing injury degree and the recovery degree on winter wheat yield, and to explore a more accurate monitoring method, using a combination of CVA and ΔNDVI to monitor freezing injury in winter wheat. According to the statistical analysis, spatial distribution maps of the degree of freezing injury, recovery rate and winter wheat yield were obtained to monitor the freezing injury of winter wheat; these results will provide the scientific basis for the monitoring of winter wheat freezing injury and the evaluation of crop production.
Materials and methods
Sampling and data collection
Thirty-four winter wheat fields were selected from the study areas of Wenxi County, Shanxi Province, China (35°9′–35°34′ N, 110°59′–111°37′ E, 450–1500 m a.s.l.) in 2010; each wheat field had a size of at least 5 ha. At the mature wheat stage, the yield components (spike number, grain number per spike, thousand-grain weight) were investigated to determine the yield. Specifically, in each plot, 1 m × 1 m of above-ground plants was harvested manually and brought to the lab for processing. Triplicate plots (50 m × 50 m) were sampled in each field. Abnormal wheat yield values were eliminated by SPSS 20.0 software.
A GPS product (Brand: Jiaming, Model: G120BD, country of origin: China) was used in the study region for accurate positioning. ENVI 5.0 was used to process the RS images obtained from the HuanJing (HJ)-1A/1B satellite charge coupled device (CCD). ArcGIS 10.0 was used to process the related GIS content. SPSS 20.0 was used for various data analyses described in the text.
Preprocessing of the HuanJing-1A/1B satellite charge coupled device data
The HJ-1A/1B CCD data, whose spatial resolution was 30 m × 30 m, were provided by the China Centre for Resources Satellite Data and Application. In the present study, the HJ1A-CCD1-8-72-20100223 data set was used to extract the winter wheat planting area, and the HJ1B-CCD2-7-71-20100410, HJ1B-CCD1-6-72-20100424 and HJ1B-CCD1-9-71-20100510 data sets were used to extract the vegetation indexes. The ratio vegetation index, difference vegetation index, NDVI, EVI, structure insensitive pigment index (SIPI) and green ratio vegetation index were adopted as six-dimensional spatial vectors.
Pretreatment method
Atmospheric correction: The Fast Line-of-sight Atmospheric Analysis of Spectral Hypercubes (FLAASH) module was used to adjust the HJ-1A/1B RS images.
Geometric correction: A coarse geometric-correction and precise geometric-correction process were completed using a 1:50 000 digital raster map and ground control points. A cubic convolution interpolation was used to assure that the error was less than one pixel in the georeferencing process (Chen, Reference Chen2012).
Calculation of VI: The vegetation indices (VIs) of the HJ-1A/1B images were calculated using the following methods (Table 1).
Table 1. The introduction of six vegetation indexes
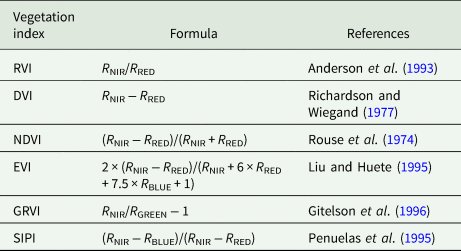
RVI, ratio vegetation index; DVI, difference vegetation index; NDVI, normalized difference vegetation index; EVI, enhanced vegetation index; GRVI, green ratio vegetation index; SIPI, structure insensitive pigment index. R NRI is reflectance of near infrared band; R RED is reflectance of red band; R BLUE is reflectance of blue band; R GREEN is reflectance of green band.
Extraction of planting area: First, an atmospheric correction was performed on the HJ-1A data, and ground control points were used for the geometric correction. The Mahalanobis distance taxonomy was used to classify the data, and the classification effect was the best when the threshold was set to 2.9. To address the leakage and spillage fractions remaining in the images after classification, each planting area vector graph produced by classification was superimposed with the corresponding HJ-1A RS image in ArcGIS through a second visual interpretation to ultimately produce an area vector graph. An HJ-1A image of the winter wheat planting area was obtained by cutting the HJ-1A image in ENVI (Fig. 1).

Fig. 1. Colour online. Extraction of planting area of winter wheat in Wenxi County, Shanxi Province, China in 2010.
Construction of the change vector
The six-dimensional spatial vector was constructed from the six vegetation indexes described above, and each pixel on the three-stage images corresponded to a six-dimensional vegetation index vector, as follows:

In the formula, t is the six-vegetation index; i is the phase image, where i = 1, 2, 3; and j is the pixel on a phase image. The module length and directional cosine were calculated as shown in Eqn (2):


According to the spatial vector constructed using the six vegetation indexes described above, the spatial angle vector of each pixel is obtained, and the angle change vector in space is constructed as follows:

Δθ 1 reflects whether winter wheat has suffered from freezing injury and the severity of the freezing injury and Δθ 2 reflects the degree of winter wheat growth recovery following freezing injury. The vegetation index with the largest change range was selected as the best index for use in freezing injury monitoring applications because the larger the change range is, the more obvious the change degree of pixels is.
Monitoring of the freezing injury of winter wheat by the change of normalized difference vegetation index
The NDVI values obtained in each neighbouring stage were used to monitor freezing injury. That is, ΔNDVI1 = NDVI2 – NDVI1. In this formula, NDVI1 is the NDVI value recorded before the occurrence of a freezing injury, and NDVI2 is the NDVI value obtained during the freezing injury period. If ΔNDVI1 > 0, winter wheat is not affected by freezing injury; if ΔNDVI1 = 0, the growth of winter wheat is suppressed; and if ΔNDVI1 < 0, winter wheat is affected by freezing injury.
The NDVI values obtained before and after freezing injury were used to monitor the degree of growth recovery following freezing injury. That is, ΔNDVI2 = NDVI3 – NDVI1, in which NDVI1 is the NDVI value measured before the occurrence of freezing injury and NDVI3 is the NDVI value recorded after the freezing injury period.
Geostatistical analysis
Through the analyses, it was ensured that the relevant data were normally distributed, and the kriging interpolation method (Huang et al., Reference Huang, Wang and Zhai2015; Cao et al., Reference Cao, Zhao, Duan and Cao2018) was used to obtain the spatial distributions of the analysed data.
Results and analysis
Monitoring of winter wheat based on the change vector analysis results
According to Eqns (3) and (4), the spatial vector angle ranges of the six considered vegetation indexes can be obtained for all pixel characterizations. The ranges of Δθ 1 and Δθ 2 are shown in Table 2. The range in Δθ (j, NDVI) is the largest, so NDVI is used to characterize the winter wheat freezing injury and recovery degrees (Table 2).
Table 2. Range of special vector angle about vegetation indexes

DVI, difference vegetation index; RVI, ratio vegetation index; NDVI, normalized difference vegetation index; EVI, enhanced vegetation index; GRVI, green ratio vegetation index; SIPI, structure insensitive pigment index; Δθ 1 and Δθ 2 were the angle change vectors in space, Δθ 1 reflects whether winter wheat has suffered from freezing injury and the severity of the freezing injury and Δθ 2 reflects the degree of winter wheat growth recovery following freezing injury.
The freezing injury degree can be divided into four grades according to the range in Δθ 1 (j, NDVI) and the change in the winter wheat yield following the freezing injury; this range can indicate normal (−12.00°, −4.45°), light (−4.45°, 6.62°), moderate (6.62°, 13.45°) and serious (13.45°, 21.85°) freezing injury degrees. Small portions of the northeast and southwest regions of the studied county suffered serious freeze-related damage, and some moderate freezing injury occurred around the wheat-growing areas that suffered from serious freezing injury (Fig. 2(a)). A small part of the freezing injury areas was not affected, and most areas suffered only a slight freezing injury.

Fig. 2. Colour online. Spatial distribution image of Δθ 1(j, NDVI) and Δθ 2(j, NDVI). ΔNDVI, the change of normalized difference vegetation index; NDVI, normalized difference vegetation index; Δθ 1(j, NDVI) and Δθ 2(j, NDVI) was the angle change vector in space. Δθ 1(j, NDVI) reflects whether winter wheat has suffered from freezing injury and the severity of the freezing injury and Δθ 2(j, NDVI) reflects the degree of winter wheat growth recovery following freezing injury.
The recovery degree of winter wheat following a freezing injury can be divided into four grades according to the range in Δθ 2 (j, NDVI) and according to the actual investigation results: these grades include not recovered (−13.48°, −5.00°), poorly recovered (−5.00°, 2.00°), generally recovered (2.00°, 14.00°) and optimally recovered (14.00°, 22.35°). There were few areas without freezing injury in Wenxi County, and other areas suffered from different degrees of freezing injury (Figs 2(a) and (b)). A small part of the central region suffered serious freezing injury, and a small part of this region did not recover; the recovery of winter wheat growth was poor in the eastern part of the central region, which suffered moderate freezing injury; the degree of recovery was general in most of the region in which the freezing injury was light; and in the small region where no freezing injury occurred, the degree of recovery was general (Figs 2(a) and (b)).
Monitoring of winter wheat based on the change of normalized difference vegetation index
In the process by which the winter wheat freezing injury is monitored based on a CVA, the range in Δθ (j, NDVI) was the largest, indicating a significant change in pixels following the freezing injury of winter wheat. Therefore, it was necessary to analyse the effect of winter wheat freezing injury on NDVI variability.
The NDVI value suddenly drops following a freezing injury of winter wheat. According to the change in the winter wheat NDVI recorded before and after a low-temperature event, it can be determined whether the winter wheat was affected by a freezing injury. When ΔNDVI1 > 0, winter wheat has not been affected by a freezing injury. When ΔNDVI1 ⩽ 0, winter wheat has been affected by a freezing injury, and the smaller the ΔNDVI1 value is, the greater the effect of the freezing injury was. It can be seen from the spatial distribution of ΔNDVI (Fig. 3(a)) that very small parts of the northeast and southwest regions suffered from serious freezing injury. Some moderate freezing injury occurred around the wheat-planting area that suffered from serious freezing injury. A small portion of the area was not affected; most areas suffered freezing injury at only a light degree.

Fig. 3. Colour online. Spatial distribution image of ΔNDVI1 and ΔNDVI2. ΔNDVI, the change of normalized difference vegetation index; ΔNDVI1 = NDVI2 – NDVI1. In this formula, NDVI1 is the NDVI value recorded before the occurrence of a freezing injury, and NDVI2 is the NDVI value obtained during the freezing injury period, ΔNDVI2 = NDVI3 – NDVI1, in which NDVI1 is the NDVI value measured before the occurrence of freezing injury and NDVI3 is the NDVI value recorded after the freezing injury period.
With the end of a freezing injury, the temperature gradually increases, winter wheat begins to resume its growth, and the NDVI values also gradually increase. However, because of the differences in the freezing injury temperatures and durations among different areas, the degree of winter wheat freezing injury is also different, and the speed and degree of its recovery are thus different. Therefore, the NDVI difference recorded before and after a freezing injury could be used to monitor the growth recovery degree of winter wheat following a freezing injury. When ΔNDVI2 > 0, it indicates that winter wheat has recovered its growth; the larger the ΔNDVI2 value is, the greater the degree of recovery is. When ΔNDVI2 ⩽ 0, it indicates that the internal structure of the winter wheat has changed, and it cannot recover its growth. From the spatial distribution of ΔNDVI2 (Fig. 3(b)), a small unrecovered area can be seen throughout the whole county, and the recovery was poor in the areas surrounding this region; most of the studied areas underwent optimal recovery.
The winter wheat in the area that suffered serious freezing injury had not yet recovered at the time of analysis (Fig. 3). The region that suffered moderate freezing injury generally had a poor recovery or even no recovery, and the area that was not affected by freezing injury had a general or optimal recovery (Fig. 3).
Comprehensive monitoring of winter wheat freezing injury
The CVA and ΔNDVI results were roughly the same, but there were also some differences. It was necessary to combine these two methods into a comprehensive analysis to obtain more accurate monitoring results.
Comprehensive monitoring of the freezing damage of winter wheat
The locations of the areas indicated to have suffered severe freezing injury by the two methods were exactly the same, and the areas that did not suffer from freezing injury were also generally consistent (Figs 2(a) and 3(a)). However, the areas under moderate and light freezing injury were not equal between the two methods; the freezing injury situation in the sampling area and the surrounding areas were exactly the same and appropriate, and the area of moderate freezing injury was located near the severe freezing injury area and far away from the no freezing injury area, while the remaining area suffered light freezing injury (Figs 2(a) and 3(a)). The degree of freezing damage in the figure is analysed, and it is found that there is a certain inclusive relationship between different degrees of freezing damage (Figs 2(a), 3(a) and 4).

Fig. 4. Inclusive relationship between different degrees of freezing damage.
According to the inclusive relationship of freeze injury severity (Fig. 4), the regions corresponding to the same freezing injury level were jointly processed by the superposition analysis tool of ArcGIS (Figs 2(a) and 3(a)). The area without freezing injury was considered the final area without any freezing injury, and the area with serious freezing injury was considered the final area with severe freezing injury. The final moderate freezing injury area was obtained by erasing the moderate freezing damage area with the erasing tool; then, the above three winter wheat planting areas were erased to obtain the final light freezing injury area (Fig. 5).

Fig. 5. Colour online. Spatial distribution image of freeze injury degree.
The spatial distribution of the freezing injury degree of winter wheat was consistent with the inclusion relationship (Fig. 4); however, the level of the regional area changed. Due to the limitations of the sampling points, the interpolation shown on the graph was most accurate at the location of the sampling point; the interpolation results become less accurate with an increasing distance from the sampling area. However, the severe freezing injury and no freezing injury areas were small, and there were sampling points in these ranges, so these results could be approximately considered as accurate. The moderate injury union area covered a small portion of the serious injury union area, so this area had to be erased. The rest of the studied region comprised light-injury areas. There was no sampling point at the border area of Wenxi County, and the interpolation results were not accurate in this region.
Statistical analysis of the area under different degrees of freezing injury showed that the area suffering serious freezing injury was the smallest proportion, accounting for 0.9% of the total study area, followed by the area with no freezing injury, which accounted for 3.5%, and the area of moderate freezing injury, which accounted for 10.2%; the remaining area experienced light freezing injury (Table 3).
Table 3. Statistical analysis of the degree of freeze injury and growth recovery

Comprehensive monitoring of the recovery degree of winter wheat following a freezing injury
The output optimal recovery region was basically consistent between the two methods, while differences could be seen in the locations and areas of the other degrees of recovery (Figs 2(b) and 3(b)). By analysing the degree of growth recovery in the graph, the areas with poor recovery rates, including areas with no recovery, were separated from the recovered areas, and the remaining areas were considered normal recovery areas (Figs 2(b) and 3(b)). Thus, the inclusive relationship between different degrees of growth recovery can be obtained (Fig. 6).

Fig. 6. Inclusive relationship between different degrees of restoring degree.
To comprehensively monitor the growth and recovery of winter wheat in Wenxi County, a methodical approach to comprehensively analysing the degree of freezing injury was used to divide the recovery level of the winter wheat area with the superposition analysis tool in ArcGIS. The not-recovered region obtained by Δθ 2 (j, NDVI) was located in the no freezing injury area (Fig. 5), which was unreasonable. Therefore, this part of the not-recovered region was discarded, and the not-recovered region obtained by ΔNDVI2 was taken as the final recovery region. The areas of optimal recovery output by the two methods were combined to obtain the optimal recovery area, and the areas overlapping with the not-recovered region were erased to obtain the final optimal recovery area. By combining the poor-recovery areas output by the two methods, a comprehensive poor-recovery area was obtained, and the part of this region that overlapped with the optimal recovery rate area was deleted to obtain the final poor-recovery area; the rest of the study region was considered the general recovery area (Fig. 7).

Fig. 7. Colour online. Spatial distribution image of winter wheat growth recovery rates.
The area of each level also changed due to alteration of the search radius at the time of interpolation, and the results did not conform to the inclusion relation (Figs 6 and 7). Similarly, the closer the sampling area was to the measured point, the more accurate the output recovery degree was. Because the sampling point was concentrated in a region of Wenxi County, the resulting interpolation graph was not accurate at the county boundary regions. However, the sampling points located near the boundary indicated general recovery, so the boundary region was classified as a general recovery area.
Statistical analysis of the area under different degrees of growth recovery showed that the area unable to recover was the smallest proportion, accounting for 0.2%, followed by the well-recovered area, which accounted for 1.2%; the poorly-recovered area accounted for 15.6%, and the rest was the general recovery area (Table 3). Winter wheat that was exposed to serious freezing injury did not recover or recovered poorly and the recovery of winter wheat in the moderate freezing injury area was generally poor, while the areas not affected by freezing injury showed general or optimal recovery (Figs 5 and 7).
The effects of freezing injury on winter wheat yield
Different degrees of freezing injury have different effects on the winter wheat yield. According to the statistical analysis conducted herein, the distribution of the winter wheat yield in Wenxi County showed a normal distribution, so the yield distribution of Wenxi County was obtained by the kriging interpolation method (Fig. 8).

Fig. 8. Colour online. Spatial distribution image of yield of winter wheat.
The winter wheat yield was highest in the area without freezing injury and the area with optimal recovery, spanning a region more than 3000 kg/ha in area. In the light freezing injury and general-recovery areas, the winter wheat yield ranged from 2601 to 3000 kg/ha; in the areas of serious and moderate freezing injury, the winter wheat yield ranged from 2331 to 2600 kg/ha; and the wheat yield was under 2330 kg/ha in the area where the recovery following freezing injury was poor (Figs 5, 7 and 8). The degree of freezing injury, the grade of recovery and the grade of yield (actual yield) are represented by I, II, III and IV (Table 4).
Table 4. Grading of degree of freezing injury, the degree of recovery and the level of yield

SPSS was used for the correlation analysis among the yield grade and the freezing injury grade and recovery grade; a regression model was constructed, and leave-one-out cross-validation was used to verify the results of the regression model. The results showed that in the regression model outputs characterizing the freezing injury grade, recovery grade and yield grade, R was 0.696 and 0.596, P was 0.001 and 0.006, respectively; the R of the verification results was 0.697 and 0.0.631, and P was 0.012 and 0.039, respectively (Table 5). In the regression model that predicted the yield grade using the freezing injury grade and recovery grade, the regression model had an R value of 0.771 and a P value of 0.006 (freeze injury level) and 0.045 (recovery degree level). In the verification results, R was 0.782 and P was 0.016 (Table 5). The verification results show that the regression models are relatively stable and can be used to predict the yield classification results to a large extent. In the results, the significance values of the regression coefficients of each model were <0.05, indicating that each model passed the 0.05 significance level test and that there were significant correlations among the yield level, freezing injury level and recovery level (Table 5), indicating that the freezing damage grade and recovery grade are of great significance when predicting the yield grade. Therefore, the yield level could be determined by selecting the level of freezing injury and the degree of recovery following injury to understand the measured yield range (Fig. 9).

Fig. 9. Colour online. Diurnal variations of air temperature in March and April 2010 in Wenxi County, Shanxi Province, China.
Table 5. Prediction model of yield level (n = 20)

Cal, calibration; Val, validation; R 2, coefficient of determination; P, significance; s.e., standard error. Leave-one-out cross-validation was used to verify the results of the regression model.
This study judged the model prediction results based on the magnitudes of the R 2 and s.e. indicators. The larger the R 2 and the smaller the s.e. values were, the better the prediction effect of the model was. The R 2 of the model that was jointly predicted by the level of freezing injury and the level of recovery was the largest, and the s.e. value was the smallest (Table 5). The yield range of winter wheat after freezing injury can thus be estimated more accurately using this method. Therefore, by combining the degree of freezing injury and the degree of recovery following a freezing injury in winter wheat, the winter wheat freezing injury and the impact on yield can be simulated well. At the same time, by the division of yield grades, the accuracy of the freezing injury classification can be verified.
Discussion
Compared with the traditional methods, the applications of RS monitoring technologies to studies of winter wheat freezing injury have made some progress, and these methods have wide scopes, are fast, save time and costs, and have other advantages, thus showing great potential. However, for a long time, research on freezing injuries was limited to surface temperature inversions, and research on freezing damage monitoring combined with ground data was limited.
It is obvious that when using the vector of change method and a single vegetation index to analyse freezing damage, the two utilized methods have roughly the same location and area differences in the freezing-damaged area (Figs 2 and 3). Regarding the division of the restoration area, the two methods differ not only in the location of recovering areas but also in the size of these areas (Figs 2(b) and 3(b)). These area differences may be related to the fact that NDVI tends to overestimate the vegetation coverage before ridge closure, while the change vector method can estimate the direction of a pixel change.
To monitor freezing damage more accurately, a comprehensive analysis method can be used to obtain the final wheat-freezing-damage information. The results of this study show that few areas in the study region have not suffered freezing damage, while the other areas have suffered different degrees of freezing damage (Fig. 5). It is speculated that the low-temperature weather that occurred from 10 to 28 March 28 kept the winter wheat plants in low-temperature conditions for a long time, causing the winter wheat to suffer extensive freezing damage. A very small part of the central region suffered severe freezing damage, and a small part did not resume growth following this damage. This may have been because the winter wheat plants were affected by extremely low temperatures from 12 to 15 April, causing changes in the internal structures of the winter wheat plants and resulting in irreversible changes that prevented the plants from growing and caused them to die. In the areas that suffered moderate freezing damage east of the central study area, the recovery of winter wheat growth was poor, and most of the areas with slight freezing damage also showed normal recovery (Figs 5 and 7). This result may have been caused by freezing damage inhibiting the growth of winter wheat. The areas that were not affected by freezing showed fair or optimal recovery, indicating the normal growth of winter wheat.
After a freezing injury, the crops began to resume growth as the temperature increased. However, because of the differences in the surface temperature and the low-temperature duration, the degree of freezing injury and the speed of growth also differed. For example, following a winter wheat freezing injury, the growth period was extended, resulting in an inconsistent mature period and inconsistent production losses.
After crops suffer from a freezing injury, their frozen tissues and organs suddenly desiccate, lose their remaining green pigment, lose water, wilt and dry up. This performance is a gradual process, so there is a certain hysteresis effect that prevents the crop injury situation from being fully reflected when monitoring crops using the vegetation index before and following a freezing injury. At the same time, this lagging performance also induces certain risks when conducting immediate disaster relief measures. However, from a macroscopic point of view, the methods utilized herein are conducive to assessing crop damage and disaster situations in a timely manner by the state and competent departments, and these results have great significance for follow-up disaster relief and macro control.
In addition, measured taken to monitor the freezing injuries of crops should start with studying the crop to strengthen the understanding of the target crop's response when a freezing injury occurs; then, the crop can be monitored in combination with RS techniques. After freezing, the potassium and copper contents in winter wheat have been found to decrease significantly, leading to further changes in the physiological structures of crops (Lacoste et al., Reference Lacoste, Nansen, Thompson, Moir-Barnetson, Mian, Mcnee and Flower2015). These physiological changes lead to obvious changes in the spectral response of winter wheat. In addition, freezing can also increase the impacts of winter wheat diseases and insect pests. Some studies have shown that frostbite increases the susceptibility of winter wheat to beetles (Lacoste et al., Reference Lacoste, Nansen, Thompson, Moir-Barnetson, Mian, Mcnee and Flower2015), and various disasters often occur throughout the winter wheat growth season. Using Advanced Very-High-Resolution Radiometer (AVHRR), LST vegetation index data and satellite-derived RS data can capture important topographic features of freeze occurrences, including changes in latitude, longitude, altitude and distance (Tait and Zheng, Reference Tait and Zheng2003). Moreover, the MODIS LST product from the Aqua satellite has been shown to be well-correlated with the minimum air temperature on homogeneous surfaces (Zeng et al., Reference Zeng, Wardlow, Tadesse, Shan, Hayes, Li and Xiang2015), with increasing variances at high elevations (Pepin et al., Reference Pepin, Maeda and Williams2016). Analyses of ground-based station data have revealed a strong relationship between the freezing intensity and terrain form (Lindkvist et al., Reference Lindkvist, Gustavsson and Bogren2000). Therefore, it is necessary to monitor and analyse freezing damage using space-based and ground-based RS methods.
Change vector analyses are often used to dynamically monitor land use and coverage; this method is rarely seen in studies monitoring winter wheat freezing injury, and the optimal criteria with which to classify freezing injuries are not yet clear. In this study, CVA was used to dynamically monitor winter wheat land use and coverage and to study the growth recovery of winter wheat following a freezing injury. This method is rarely applied in winter wheat freezing injury monitoring studies, and the reunification index used herein was the normalized vegetation index, which was also verified by Feng et al. (Reference Feng, Yang, Cao and Ding2009) using multitemporal MODIS data to monitor winter wheat freezing injuries. In the study of Wang et al. (Reference Wang, Gu, Dong, Wang, Huang, Guo, Wang and Wang2011) on the classification of winter wheat freezing injuries based on a CVA method, SIPI was used to characterize the degrees of freezing injury and growth recovery following a freezing injury. The reasons for the differences in their results may involve environmental conditions such as planting, management, water and fertilizer ratio, wheat varieties, sowing date (Yang et al., Reference Yang, Wei and Yang2011), terrain (Lindkvist et al., Reference Lindkvist, Gustavsson and Bogren2000), slope, slope aspect (Xie and Chen, Reference Xie and Chen2008) and other disaster damage conditions. Therefore, the change in the vector angle constructed by the vegetation index cannot be used to completely determine the winter wheat freezing injury and recovery levels.
The geostatistical analysis conducted herein was based on obtaining predictions from a large number of samples by analysing the relationships among the samples and exploring their distribution. In general, the more sample points there are and the gentler the terrain is, the more accurate the forecast results are. However, in this experiment, the terrain conditions were not considered, and the spatial interpolation constraints largely affected the distribution of the results, so there was little deviation between the predicted results and the actual situation. In future studies, we must consider the factors that affect the forecast results to obtain the best possible prediction results.
The growth and development of crops involve all kinds of changes in different environmental factors, characterized by temporal and spatial changes with strong temporal and spatial effects. With the passage of time, the environment and crops are changing, indicating that the factors influencing crop changes are not necessarily the same among different time periods and that the same factors can differently influence winter wheat in different stages. As freezing damage is a natural disaster with a high probability, the methods used to monitor winter wheat freezing injuries must consider the environment at a certain time during the winter wheat freezing injury period, the various factors affecting the normal growth and development of winter wheat at different times, and the resistance of winter wheat under freezing injury stress. Through the combination of these considerations, we can establish a more accurate monitoring mechanism and perform better crop growth monitoring.
Conclusion
In this study, the map obtained using a CVA and a single vegetation index to analyse the degree of freezing damage shows that the degrees of freezing damage indicated by these methods are roughly the same, but the areas are different; when considering the recovery degree of winter wheat following freezing damage, a difference not only in area but also in location information can be seen. Therefore, a comprehensive analysis method was used to obtain the final winter wheat freezing injury information. Through a comparative analysis of the relationships among the yield, degree of freezing injury and degree of recovery, the combination of the degree of freezing injury and degree of recovery was finally found to have the best yield prediction effect. Therefore, it was best to combine the degree of freezing damage and the degree of recovery to predict the yield range of winter wheat, so as to verify the freezing damage classification accuracy.
Financial support
This work was supported by the National Natural Science Foundation of China (31871571, 31201168), Basic Research Program of Shanxi Province (20210302123411), Outstanding Doctor Funding Award of Shanxi Province (SXYBKY2018040), Key Technologies R&D Program of Shanxi Province (201903D211002-01, 05), Applied Basic Research Project of Shanxi Province (201801D221299), Science and Technology Innovation Fund Project of Shanxi Agricultural University (2020BQ32).
Conflict of interest
None.
Ethical standards
Not applicable.


