INTRODUCTION
The sea scallop Placopecten magellanicus (Gmelin, 1791) is a commercially important pectinid species, found along the eastern seaboard of North America from the Northern Gulf of St Lawrence to North Carolina (Posgay, Reference Posgay1957; Squires, Reference Squires1962). On the continental shelf, sea scallops can form dense aggregations on the scale of kilometres, known as beds, which, depending on their spatial extent and scallop density, can support commercial fishing (Posgay, Reference Posgay1957; Squires, Reference Squires1962; Shumway & Parsons, Reference Shumway and Parsons2006). Scallop beds are often associated with particular substrate types, with dense aggregations occurring on hard sediments, such as coarse sand or sandy-gravel (Langton & Robinson, Reference Langton and Robinson1990; Thouzeau et al., Reference Thouzeau, Robert and Smith1991; Stokesbury & Himmelman, Reference Stokesbury and Himmelman1993, Reference Stokesbury and Himmelman1995; Stokesbury, Reference Stokesbury2002; Kostylev et al., Reference Kostylev, Courtney, Robert and Todd2003). However, scallop abundance and distribution are also influenced by water depth, currents and temperature (Thouzeau et al., Reference Thouzeau, Robert and Smith1991; Stokesbury & Himmelman, Reference Stokesbury and Himmelman1993, Reference Stokesbury and Himmelman1995; Brand, Reference Brand and Shumway2006).
The sea scallop is a relatively strong swimmer compared to other scallop species, and its mobility changes with size (Dadswell & Weihs, Reference Dadswell and Weihs1990; Brand, Reference Brand and Shumway2006). They are broadcast spawners and their larvae have a planktonic phase of 30–40 days, with settlement usually occurring at ~0.25 mm shell height (SH) (Culliney, Reference Culliney1974). Juveniles (1–30 mm SH) are generally sedentary and byssally attached (Caddy, Reference Caddy1972; Dadswell & Weihs, Reference Dadswell and Weihs1990; Parsons et al., Reference Parsons, Warren-Perry and Dadswell1992), whereas individuals 30–100 mm SH tend to swim readily; at >100 mm SH, individuals become less mobile and recessed on the seabed (Bourne, Reference Bourne1964; Caddy, Reference Caddy1968; Dadswell & Weihs, Reference Dadswell and Weihs1990). Swimming ability decreases with size in several scallop species, including P. magellanicus, and is thought to be due to allometric changes associated with growth (Gould, Reference Gould1971). Four major forces act on swimming individuals: gravity, lift, thrust and drag (Gould, Reference Gould1971). Mid-sized (40–80 mm SH) Placopecten experience the lowest drag and have the best development of power and greatest available lift, thus conferring better swimming ability relative to smaller and larger sizes (Dadswell & Weihs, Reference Dadswell and Weihs1990). Placopecten <40 mm SH produce less power, whereas individuals >80 mm SH experience increased wing loading, drag and reduced lift (Dadswell & Weihs, Reference Dadswell and Weihs1990).
Placopecten magellanicus swim by rapidly opening and closing their two shells simultaneously. By taking in water at the ventral edge and simultaneously closing the muscular pallial curtain, the valves close, forcing water out through two dorsal jets (Buddenbrock, Reference Buddenbrock1911; Moore & Trueman, Reference Moore and Trueman1971; Cheng & DeMont, Reference Cheng and DeMont1996; Wilkens, Reference Wilkens, Shumway and Parsons2006). The expulsion of water from the mantle is controlled by the velum and may enable the scallop to direct its swimming movements (Stephens, Reference Stephens1978; Wilkens, Reference Wilkens, Shumway and Parsons2006). Swimming likely evolved as a means of predator avoidance, but may be utilized in habitat selection and is thought to have occurred first as a cleaning response to debris and sediment (Yonge, Reference Yonge1936; Caddy, Reference Caddy1968; Winter & Hamilton, Reference Winter and Hamilton1985; Shumway & Parsons, Reference Shumway and Parsons2006). Scallops can be induced to swim by numerous stimuli, including swimming conspecifics, a perceived or real presence of predators, selection or avoidance of habitat, the approach of divers and fishing or survey gear (Hartnoll, Reference Hartnoll1967; Caddy, Reference Caddy1968; Chapman et al., Reference Chapman, Main, Howell and Sangster1979; Winter & Hamilton, Reference Winter and Hamilton1985; Ansell et al., Reference Ansell, Cattaneo-Vietti and Chiantore1998; Shumway & Parsons, Reference Shumway and Parsons2006).
Most studies that have characterized the swimming behaviour of P. magellanicus have either been theoretical or were done in the laboratory (Gould, Reference Gould1971; Caddy, Reference Caddy1972; Dadswell & Weihs, Reference Dadswell and Weihs1990; Manuel & Dadswell, Reference Manuel and Dadswell1991, Reference Manuel and Dadswell1993; Carsen et al., Reference Carsen, Hatcher and Scheibling1996; Cheng & DeMont, Reference Cheng and DeMont1996). Although investigations of swimming have been conducted in the natural environment, these have occurred near shore at relatively shallow depths (≤20 m) (Caddy, Reference Caddy1968; Dadswell & Weihs, Reference Dadswell and Weihs1990; Parsons et al., Reference Parsons, Warren-Perry and Dadswell1992; Carsen et al., Reference Carsen, Hatcher and Scheibling1996). Our study characterized the swimming patterns of P. magellanicus from a fished scallop bed on German Bank, Gulf of Maine, by using a remotely operated vehicle (ROV). We also provide a description of the habitat, and the distribution and abundance of the sampled population to set the context for the swimming characterizations. The ROV was fitted with a high definition (HD) video camera which allowed for improved detection of smaller scallops and more accurate determination of size distribution compared to traditional dredge surveys. The use of an ROV provided an opportunity to observe scallop swimming behaviour in situ. We related our observations to those in similar studies on P. magellanicus, as well as to other scallop species, made both in situ and in laboratory experiments. Our study provided a unique opportunity to investigate scallop size distribution, abundance, and associated swimming behaviour in the natural habitat, and at depths not reachable by SCUBA diving.
MATERIALS AND METHODS
Study site
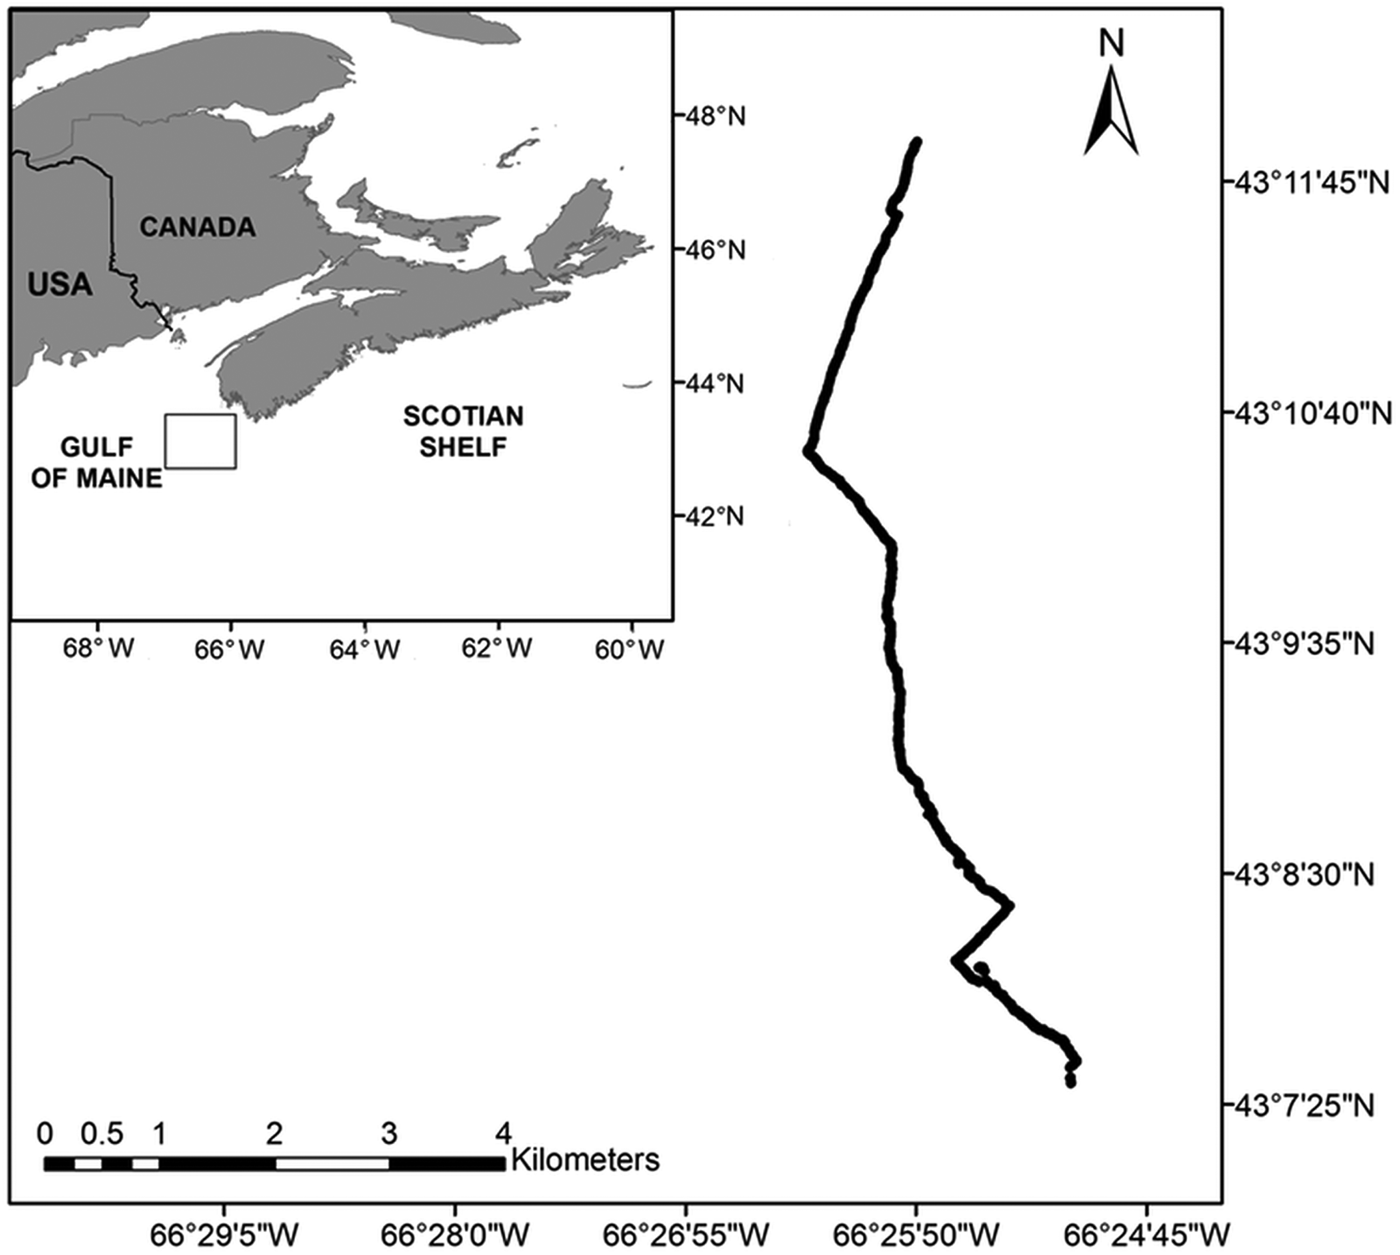
Our study was conducted on German Bank off the south-western tip of Nova Scotia, Canada, in the eastern Gulf of Maine (Figure 1). Bottom temperature in shallow areas of German Bank can reach almost 10°C, while at depths greater than 100 m, it can be <2°C. Salinity ranges from 32 to 34 throughout the bank (Hannah et al., Reference Hannah, Shore, Loder and Naimie2001; Todd & Kostylev, Reference Todd and Kostylev2011). While the bank exhibits several substratum types, ranging from muddy fine-grained sand to rocky outcrops, it is dominated by sandy-gravel (Todd & Kostylev, Reference Todd and Kostylev2011; Brown et al., Reference Brown, Sameoto and Smith2012). German Bank is characterized by a stable scallop bed that has been actively fished since the 1960s (Robert, Reference Robert1997). Our study focused on a highly fished area on the south-west portion of the bank, where depth ranges between 65 and 120 m.

Fig. 1. Location of German Bank in the Gulf of Maine off Nova Scotia, Canada, and track of a 9.95-km transect made with the ROV ‘ROPOS’ in August 2010.
A 9.95-km transect (43°7′31″N 66°25′6″W–43°11′54″N 66°25′49″W) was made by the ROV ‘ROPOS’ across a major section of a known scallop bed in August 2010 (Figure 1), with a downward facing (right angle to the seafloor), HD underwater colour video camera (Zeus camera, Insite Pacific Inc., USA) with scaling lasers spaced 16.5 cm apart. The HD camera had a glass hemispherical viewport with proprietary corrected optics that virtually eliminated geometric and chromatic distortion. Because lasers were not present between 43°8′22″N 66°25′25″W and 43°8′27″N 66°25′32″W, video from this section of the dive was not included in our analysis. In addition, a small portion of transect between 43°8′47″N and 43°8′49″N was not analysed because the ROV was off-bottom for a distance of approximately 400 m (Figure 2). The depth of the transect ranged from 75 m in the north to 110 m in the south. The ROV was travelling at a speed of 0.58 ±0.43 knots (mean ±standard deviation (SD), N = 23,828) and at a height of 1.21 ±0.31 m (mean ±SD, N = 23,828) above the seafloor. The camera was positioned 0.7 m above the base of the ROV and was thus at a height of 1.91 ±0.31 m above the seafloor, resulting in an average field of view of approximately 3.11 m in width. The transect covered a total of 29,554 m2 of seafloor. The average bottom temperature was 8.30 ±0.21°C (mean ±SD, N = 36,155), as recorded by a SBE 19 plus V2 SeaCAT Profiler CTD (Sea-Bird Electronics, USA) attached to the ROV. Global positioning system data were audio encoded on the recorded HD video using a GeoStamp® audio.

Fig. 2. Scallop abundance (m−2) in a 9.95-km transect on German Bank made with the ROV ‘ROPOS’ in August 2010. Video was recorded with a downward looking camera at ~1 m above the seafloor.
Substrate characterization
For the entire transect, substrate composition was classified according to the Wentworth particle scale as percentage of boulder (>256 mm), cobble (64–256 mm), sandy-gravel (1–10 mm) or sand (<1 mm) (Wentworth, Reference Wentworth1922). Characteristics of the seabed were recorded and classified as either physical roughness features (e.g. ripples, dunes, ledges and outcrops) or biogenic roughness (e.g. sponge dominated, significant cover of shell hash) (Valentine et al., Reference Valentine, Todd and Kostylev2005; Sameoto et al., Reference Sameoto, Lawton and Strong2008).
Scallop abundance and size distribution
For analysis, the transect was divided into 190 non-overlapping 50 m sections. To estimate the sampled area, two frame grabs were taken from each section, approximately 17 m from the beginning and from the end of the section, respectively. The scaling lasers were used to measure the width of the field of view for each frame grab and the average area of each 50 m section was calculated by multiplying the average field of view width by 50 m. The area sampled within each 50 m section ranged from 115.1 to 313.2 m2 (mean ±SD: 155.5 ±28.6 m2; N = 190).
All scallops were counted in each 50 m section and standardized abundance was calculated as scallops m−2. For shell height, three frame grabs were taken at 12.5, 25 and 37.5 m in each 50 m section. For each 50 m section, all scallops with fully visible shells were measured in the three frame grabs and binned into 5 mm SH size-classes, ranging from 0 to 195 mm SH. To generate size distributions for each 50 m section, the sub-sampled number of scallops in each size-class was divided by the total number of measured scallops and then multiplied by the total number of scallops observed in the corresponding 50 m section. The size frequencies from each 50 m section were then combined to generate the size distribution of the entire transect.
The video of the seafloor was analysed for substrate composition and scallop abundance using ClassAct Mapper v.3.2, a utility developed within Fisheries and Oceans Canada for post-processing and analysis of video data. This software enables the user to interactively log continuous and discrete events that occur on video, with its associated positional information, directly to a database (for more details, see Sameoto et al., Reference Sameoto, Lawton and Strong2008). Both area and shell heights were calculated using ImageJ v.1.46m with the scaling lasers as a reference.
Swimming characterization
Of 535 swims that were observed during the transect, 200 were used to characterize scallop swimming. These included 126 full swimming bouts, where the take-off, duration and cessation of a swim could all be determined, and 74 partial swims, where it was only possible to characterize part of the bout (most often a swim in progress and the cessation of swimming). For each full swimming bout, the SH of the scallop (mm), the swim distance (cm, from take-off to last adduction clap), swim time (s, take-off to last adduction clap) and number of adductions were measured. From these, velocity (cm s−1) and distance travelled per adduction (cm, swim distance/number of adductions) were calculated. Since the HD camera was positioned perpendicular to the seafloor, scallop swim distances were measured as the net horizontal distance travelled over ground. For partial bouts, swim distance and swim time were measured for the duration of the observable swim, and velocity and distance travelled per adduction were derived from these values to be related to SH.
Statistical analyses
A power regression was used to explore the relationship between depth and scallop abundance, and simple linear regressions were applied to the relationships of swim distance and swim time with SH. Quadratic regressions were used to explore the relationships between velocity and SH, and between distance travelled per adduction and SH. Data for the latter comparison were log-transformed to meet the assumption of homoscedasticity (Underwood, Reference Underwood2005). Significance levels of α = 0.05 were used throughout. All statistical tests were run with Minitab v.16.0 software.
RESULTS
Substrate characterization
The composition of substrate varied little across the transect. Sand and sandy-gravel were the dominant substrates, with percentages consistently >80%. Boulders and cobbles were also present, but were generally much less abundant (<20%). Boulders and cobbles were randomly distributed throughout the transect, except near the extremes of the transect, where a more uniform coverage was observed (43°7′33″N 66°25′7″W–43°8′00″N 66°25′33″W; and 43°11′8″N 66°26′8″W–43°11′33″N 66°25′56″W, start and end of the transect, respectively).
The transect contained few physical and biogenic roughness elements. Small-scale ripples were observed in areas where the substrate was composed of sand, and shell hash (>30% cover) was observed relatively consistently throughout the transect. A single area dominated by sponges (>40 m−2 cover) was present near the northern end of the transect and was associated with 100% cover of sand.
Scallop abundance
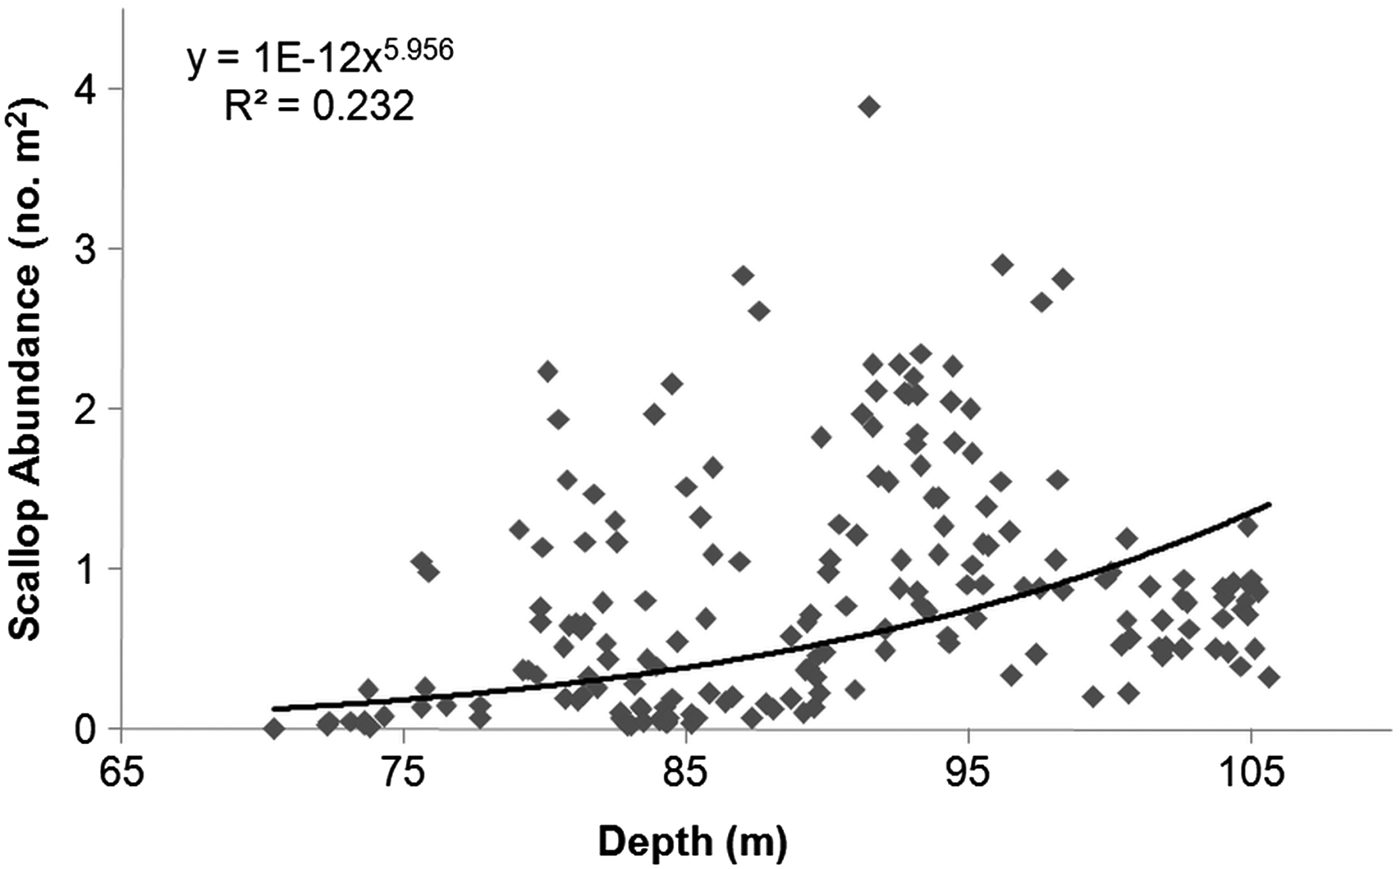
Scallops were present throughout the transect and abundance ranged from 0.004 to 3.89 scallops m−2 (mean ±SD: 0.87 ±0.73 m−2; N = 190). For most of the transect, abundance was <1 scallop m−2, however, there were three areas where abundance was >1 and up to 3.89 scallops m−2 (Figure 2). Abundance increased significantly with depth (F1, 186 = 15.89, P < 0.001; N = 188), even over the small range (~35 m) encountered in this study (Figure 3).

Fig. 3. Relationship between the abundance of Placopecten magellanicus (no. m−2) and depth in a 9.95-km transect on German Bank made with the ROV ‘ROPOS’ in August 2010.
Scallop size distribution
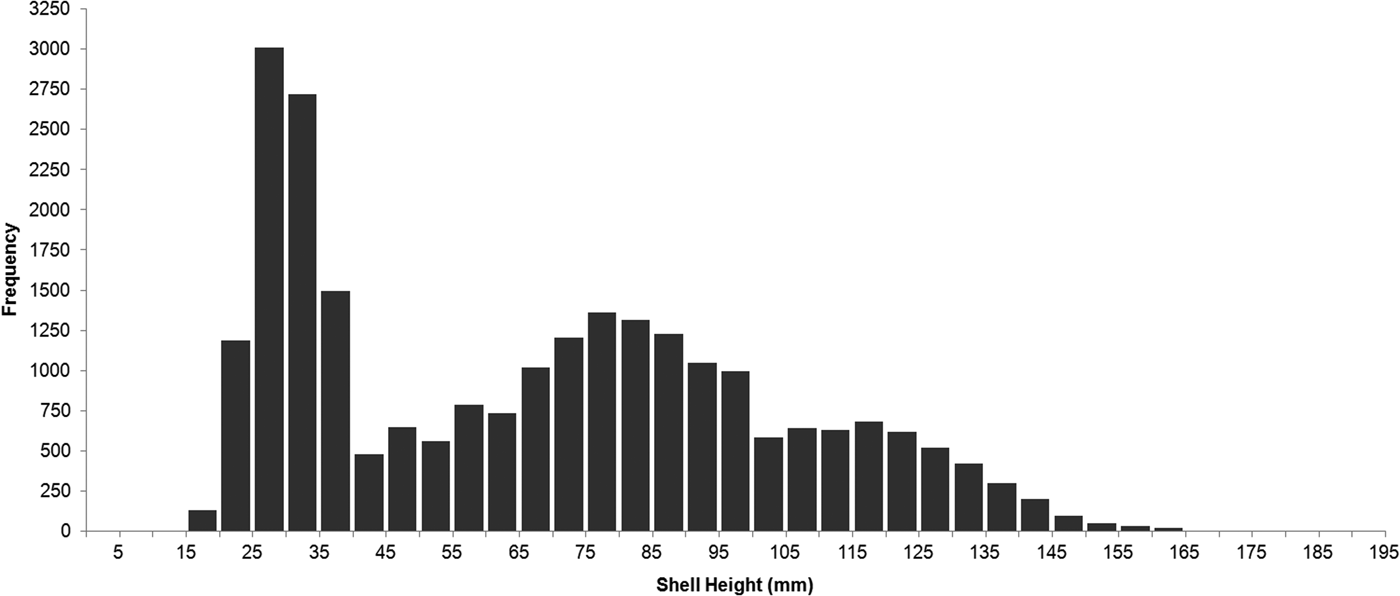
A total of 3067 scallops were sub-sampled to measure shell height. Scallops ranged in SH from 16.3 to 193.8 mm and for the entire population along the transect (N = 24,663), the median size-class was 65–70 mm. The shell height frequency distribution was bimodal and positively skewed, with peaks at 20–40 mm and 70–90 mm (Figure 4). Scallops <40 mm SH made up 35% of the population, 52% of the scallops in the population were <70 mm SH, and only 19% were >100 mm SH. There were no scallops recorded at <15 mm SH, or >165 mm SH, except for one individual that was 193.8 mm SH (Figure 4).

Fig. 4. Size distribution of Placopecten magellanicus observed in a 9.95-km transect on German Bank made with the ROV ‘ROPOS’ in August 2010.
Swimming characterization
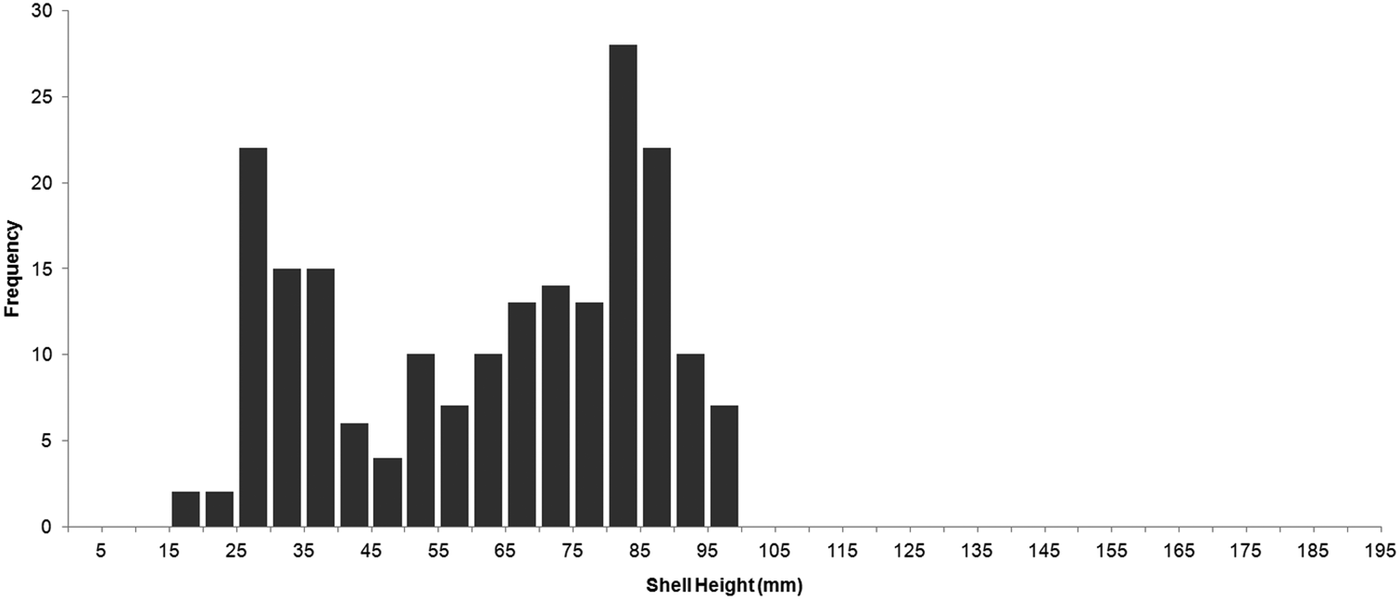
The size of sampled swimming scallops ranged from 18.9 to 99.9 mm SH (mean ±SD: 62.3 ±23.2 mm; N = 200) and reflected the size distribution from the entire transect except individuals >100 mm SH, none of which were observed to swim. The distribution was bimodal and positively skewed, with peaks at 25–40 mm and 80–90 mm SH (Figure 5).

Fig. 5. Size distribution of analysed swimming Placopecten magellanicus observed in a 9.95-km transect made on German Bank by the ROV ‘ROPOS’ in August 2010.
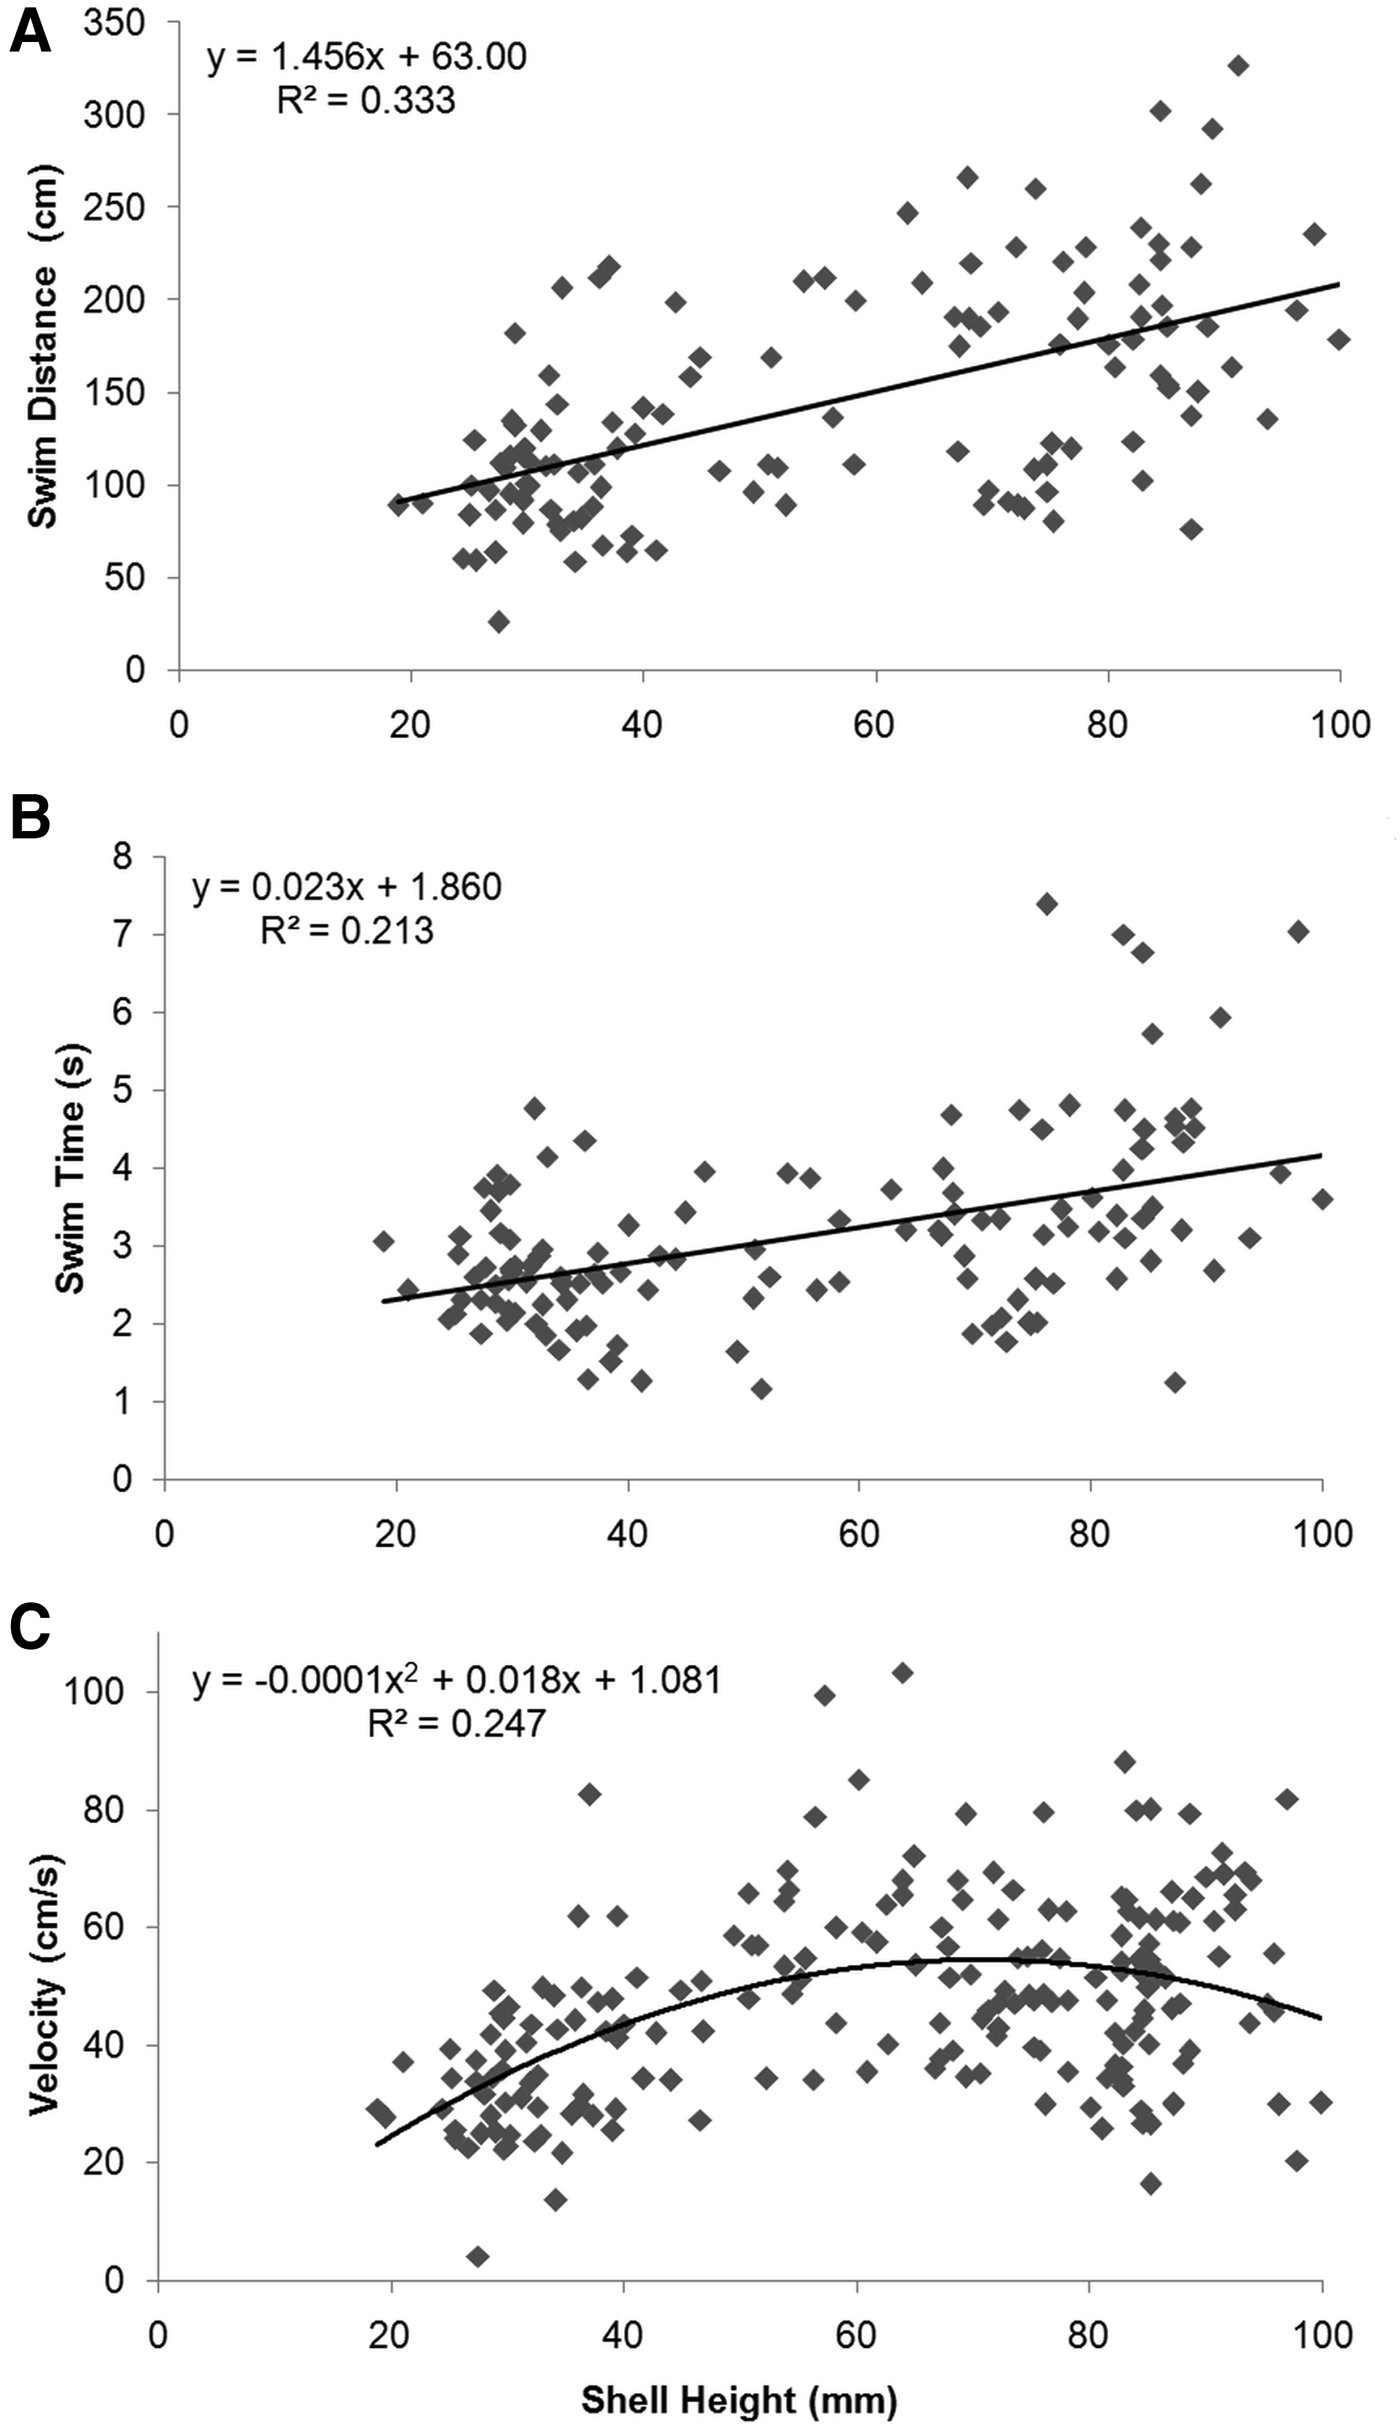
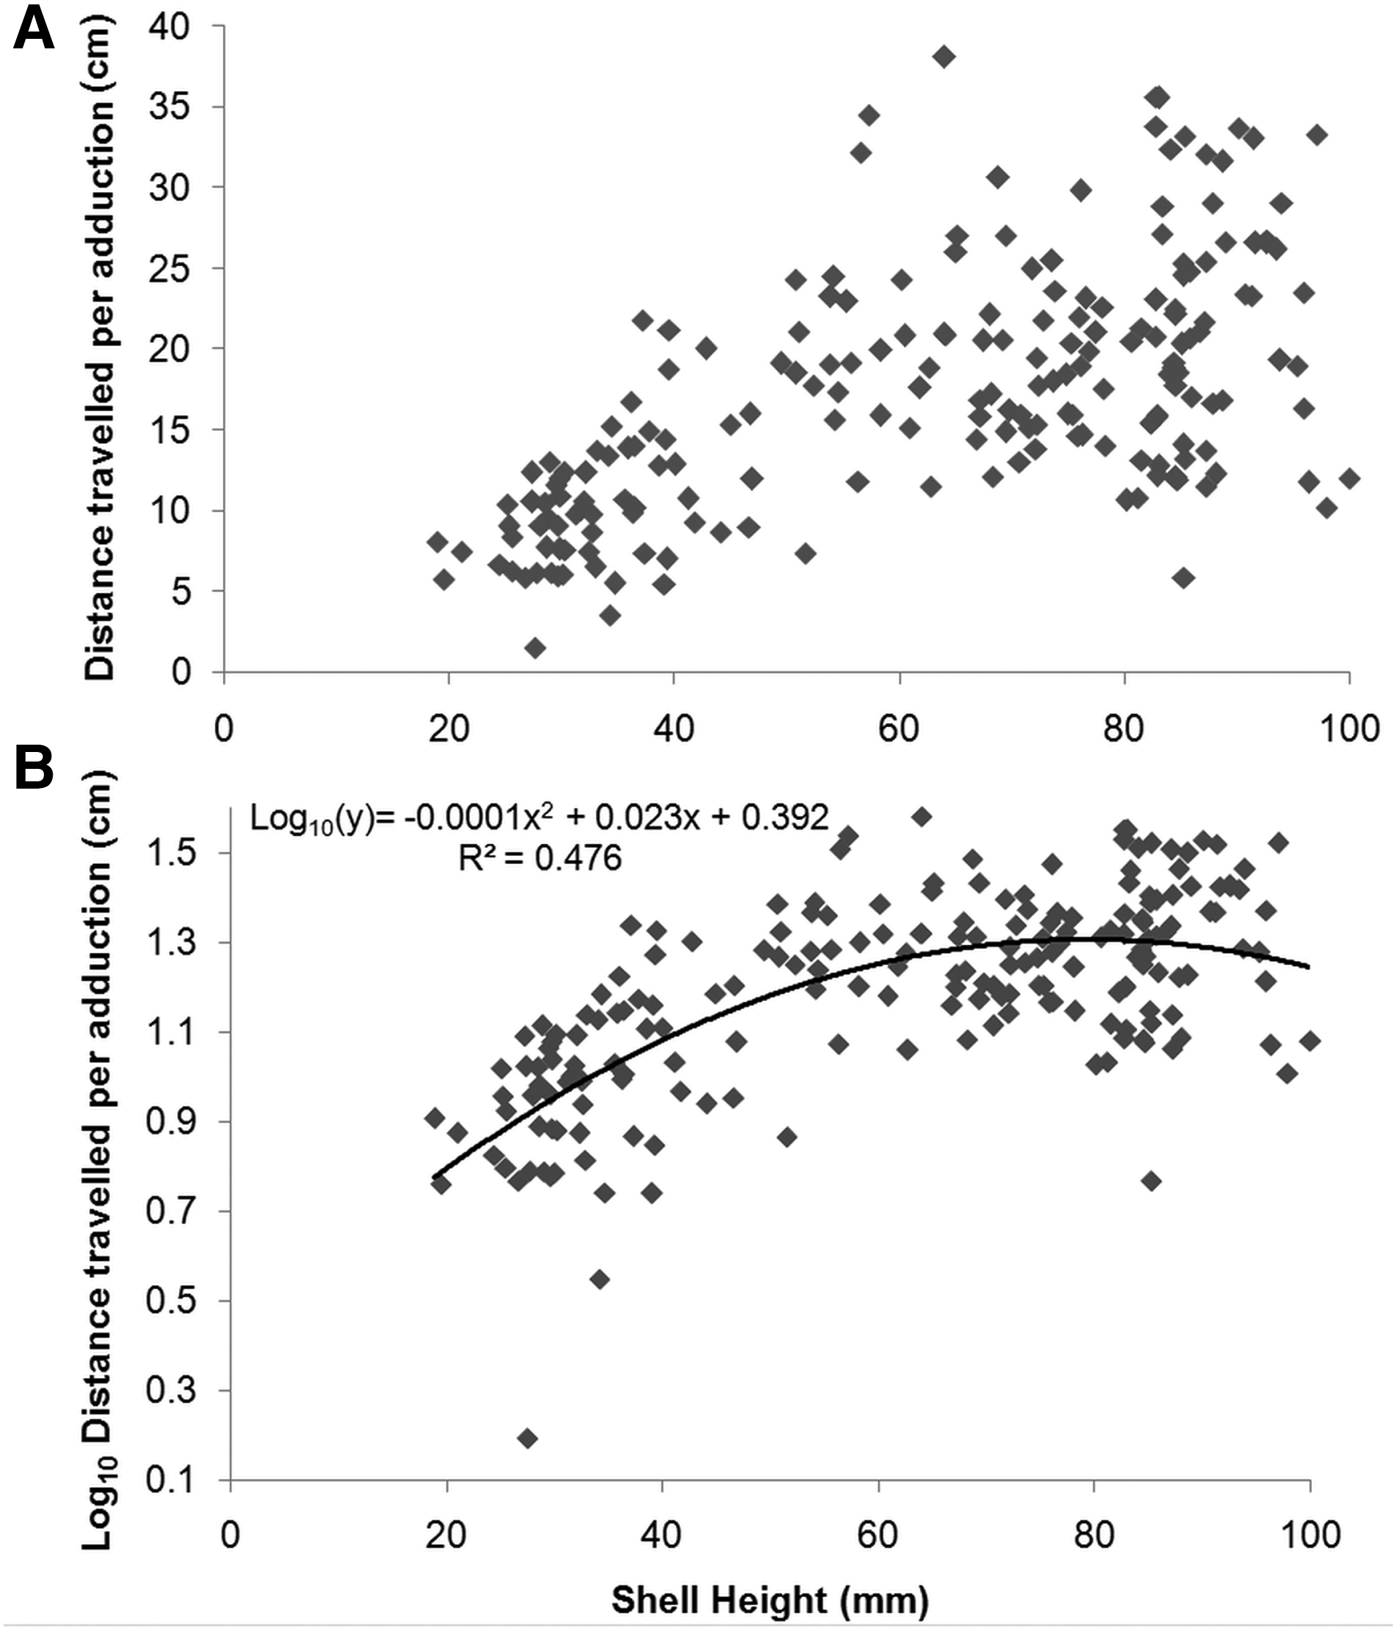
There was a positive linear relationship between swim distance and SH over the observed size range (F2, 123 = 30.42, P <0.001) (Figure 6A). Swim distance ranged from 25.7 cm (by an individual 27.5 mm SH) to 326.4 cm (by an individual 91.2 mm SH) (mean ±SD: 144.1 ±59.9 cm; N = 126). Swim time also showed a significant linear relationship with SH (F2, 123 = 21.03, P < 0.001) (Figure 6B), and ranged from 1.2 s (by an individual 51.5 mm SH) to 7.4 s (by an individual 76.1 mm SH) (mean ±SD: 3.1 ±1.2 s; N = 126). A significant quadratic relationship was recorded between velocity and SH, with velocity peaking at 60–80 mm SH (F2, 197 = 32.32, P < 0.001) (Figure 6C). Velocity ranged from 4.2 cm s−1 (by an individual 27.5 mm SH) to 103.2 cm s−1 (by an individual 64.0 mm SH) (mean ±SD: 47.4 16.6 cm s−1; N = 200). A significant quadratic relationship was also present between distance travelled per adduction and SH, being greatest at 70–90 mm SH (F2, 197 = 89.66, P < 0.001) (Figure 7). Distance travelled per adduction ranged from 1.6 cm (by an individual 27.5 mm SH) to 38.1 cm (by an individual 64.0 mm SH) (mean ±SD: 17.2 ±7.5 cm travelled per adduction; N = 200).

Fig. 6. Relationship between (A) swim distance, (B) swim time and (C) swim velocity vs shell height for Placopecten magellanicus observed in a 9.95-km transect on German Bank made with the ROV ‘ROPOS’ in August 2010.

Fig. 7. Relationship between distance travelled per adduction vs shell height for Placopecten magellanicus observed in a 9.95-km transect on German Bank made with the ROV ‘ROPOS’ in August 2010: (A) the overall trend in the original data; (B) log-transformed y-axis and trendline with associated equations.
DISCUSSION
The area of German Bank surveyed in this study was characterized by high abundances of scallop associated with mainly sand or sandy gravel. Sea scallops are most abundant on coarse substrates (Langton & Robinson, Reference Langton and Robinson1990; Thouzeau et al., Reference Thouzeau, Robert and Smith1991; Stokesbury & Himmelman, Reference Stokesbury and Himmelman1993, Reference Stokesbury and Himmelman1995; Stokesbury, Reference Stokesbury2002; Todd & Kostylev, Reference Todd and Kostylev2011; Brown et al., Reference Brown, Sameoto and Smith2012), which may enhance juvenile survival by offering protection from predators and a stable substratum to which to attach (Larsen & Lee, Reference Larsen and Lee1978; Thouzeau et al., Reference Thouzeau, Robert and Smith1991). The size–frequency distribution of P. magellanicus on German Bank was positively skewed and showed two peaks, one at 20–40 mm SH, likely due to a recent large recruitment event in the area. Pressure from the active scallop fishery in this area likely accounts for the skewness of the observed distribution and for the low abundance at >100 mm SH. No individuals <15 mm SH were observed in the current study; however, this was likely due to the limit of resolution of the video. Smaller scallops can also be obscured because they tend to attach themselves to shell debris, larger scallops and other species, such as hydrozoans (Culliney, Reference Culliney1974; Larsen & Lee, Reference Larsen and Lee1978; Thouzeau et al., Reference Thouzeau, Robert and Smith1991; Parsons et al., Reference Parsons, Warren-Perry and Dadswell1992).
The sea scallop is a relatively strong swimmer compared to other scallop species, and its swimming ability is size-dependent. Dadswell & Weihs (Reference Dadswell and Weihs1990) suggest that, for Placopecten, size-related allometric changes in growth account for changes in swimming ability. Juveniles (1–30 mm) have been observed to swim in both field and laboratory studies, but tend to be byssally attached to various substrates, such as sand, gravel and shells (Caddy, Reference Caddy1968, Reference Caddy1972; Dadswell & Weihs, Reference Dadswell and Weihs1990; Thouzeau et al., Reference Thouzeau, Robert and Smith1991; Parsons et al., Reference Parsons, Warren-Perry and Dadswell1992). For 30–100 mm SH, P. magellanicus tends to swim readily, but individuals >100 mm SH are less mobile and recessed on the seabed (Bourne, Reference Bourne1964; Caddy, Reference Caddy1968; Dadswell & Weihs, Reference Dadswell and Weihs1990). In our study, swim distance and swim time increased linearly with size, and scallops as small as 18.9 mm were observed to readily swim in response to the approaching ROV. The lack of swimming in scallops >100 mm SH confirms previous observations by Caddy (Reference Caddy1968) via SCUBA diving, in which these larger individuals were only induced to swim when subjected to direct tactile stimulation. Although it may be hypothesized that the lack of swimming by larger scallops may be due to a reduced risk of predation, Dadswell & Weihs (Reference Dadswell and Weihs1990) demonstrated that Placopecten over 110 mm SH weigh more than the lift available suggesting that scallops of this size are incapable of take-off and swimming.
Both velocity and distance travelled per adduction were greatest for mid-sized scallops (~60–90 mm SH) and observed patterns in velocity with shell size were similar to previous studies both in the laboratory and in situ (Caddy, Reference Caddy1968; Dadswell & Weihs, Reference Dadswell and Weihs1990; Manuel & Dadswell, Reference Manuel and Dadswell1991; Stokesbury & Himmelman, Reference Stokesbury and Himmelman1996). This size range provides a combination of light weight and fast swimming speed and is conducive to attaining the greatest available lift, which in turn produces the maximum swimming velocity in P. magellanicus (Dadswell & Weihs, Reference Dadswell and Weihs1990). Decreased swimming at larger sizes has been reported for a number of species of scallop including the sea scallop (Caddy, Reference Caddy1968; Gould, Reference Gould1971; Dadswell & Weihs, Reference Dadswell and Weihs1990). Reduced swimming ability at larger sizes (L) has been attributed to muscular power and lift scaling as L 2, whereas weight scales as L 3 (Gould, Reference Gould1971; Dadswell & Weihs, Reference Dadswell and Weihs1990). However, for the saucer scallop Amusium balloti, swimming speed increases linearly with size, and this species continues to swim at >100 mm SH, with speeds between 80 and 100 cm s−1 for individuals >60 mm SH. This species displays the largest quick muscle area per unit shell weight for the swimming scallops, has extremely small valve convexity that reduces drag, and the shell valves are extremely light and smooth. All these characteristics contribute to greater swimming ability in this species (Gould, Reference Gould1971; Joll, Reference Joll1989).
In our study, distance travelled over ground per adduction increased with shell height until ~70 cm, and was an average of ~17 cm. Although distance over ground may be influenced by prevailing currents, the degree of influence on swimming trajectory is size-dependent, with small scallops (<30 mm) displacing horizontally mainly by advection (Manuel & Dadswell, Reference Manuel and Dadswell1991; Carsen et al., Reference Carsen, Hatcher and Scheibling1996). Using an ROV, Ansell et al. (Reference Ansell, Cattaneo-Vietti and Chiantore1998) observed that the Antarctic scallop Adamussium colbecki travelled a mean of 1.61 times its shell length, which is comparable to the pattern of distance per adduction we observed for P. magellanicus. Other studies have generally measured changes in adduction frequency (adduction s−1) rather than distance travelled per adduction (Caddy, Reference Caddy1968; Dadswell & Weihs, Reference Dadswell and Weihs1990; Manuel & Dadswell, Reference Manuel and Dadswell1991; Tremblay et al., Reference Tremblay, Guderley and Fréchette2006); however, distance per adduction can be approximated. Our observations are similar to estimates that can be drawn from Caddy (Reference Caddy1968; ~19 cm per adduction), for near bottom current speeds up to 0.7 knots, at which there was no evidence of current direction on swimming distance. Similarly, from Dadswell & Weihs (Reference Dadswell and Weihs1990), an average distance per adduction can be estimated of ~19 cm for sea scallops ~77 mm SH observed at 7°C. In contrast, for Pecten maximus, a less accomplished swimmer than Placopecten, distance travelled over ground was generally <10 cm per adduction for 90–110 mm SH individuals in response to a predatory starfish (Jenkins & Brand, Reference Jenkins and Brand2001).
Swimming in scallops is believed to have evolved primarily as an escape reaction to predators, and scallops can be stimulated to swim by a real or perceived presence of predators, including the approach of divers and fishing or survey gear (Caddy, Reference Caddy1968; Winter & Hamilton, Reference Winter and Hamilton1985; Ansell et al., Reference Ansell, Cattaneo-Vietti and Chiantore1998; Shumway & Parsons, Reference Shumway and Parsons2006). In our study, the approach of the ROV undoubtedly elicited a swimming response. Scallops often began swimming when the ROV approached, usually turning away from it, then swimming out of its path. This reaction is similar to observations made in situ by Ansell et al. (Reference Ansell, Cattaneo-Vietti and Chiantore1998) using an ROV to observe A. colbecki. Although the exact stimulus is not known, the scallops were likely stimulated by changes in currents, turbulence, vibrations or the increase in light intensity (Caddy, Reference Caddy1968; Ansell et al., Reference Ansell, Cattaneo-Vietti and Chiantore1998; Brand, Reference Brand and Shumway2006).
The observed swimming behaviour in this study likely represents the peak swimming performance of sea scallops for this area. Scallop swimming activity has been shown to be significantly correlated with temperature (Manuel & Dadswell, Reference Manuel and Dadswell1991; Bailey et al., Reference Bailey, Johnston and Peck2005; Brand, Reference Brand and Shumway2006) and seasonal patterns have been observed for Placopecten (Scheibling et al., Reference Scheibling, Hatcher, Taylor, Barbeau, Lubet, Barret and Dao1995). Bottom temperatures on German Bank vary with season, with higher temperatures in summer (7–9°C) and lower temperatures (3–5°C) in winter (Petrie et al., Reference Petrie, Drinkwater, Gregory, Pettipas and Sandstrom1996; Todd & Kostylev, Reference Todd and Kostylev2011; Hebert et al., Reference Hebert, Pettipas, Petrie and Brickman2012). The average bottom temperature in our study was 8.3°C and was relatively consistent over the length of the transect.
CONCLUSIONS
Our study provided a unique opportunity to quantify size-related swimming patterns of P. magellanicus in situ in a fished area of German Bank. Such a study with an ROV has not been conducted for this species previously, although similar research has taken place in a fished area in Terra Nova Bay, Antarctica on A. colbecki, but at shallower depths (Ansell et al., Reference Ansell, Cattaneo-Vietti and Chiantore1998). The use of an ROV allows for an examination of scallop swimming at depths unreachable by SCUBA and in a natural environment.
ACKNOWLEDGEMENTS
We would like to thank the crews of the CCGS ‘Hudson’ and the CSSF ROV ‘ROPOS’ for their support during sample collection, and to Robert Benjamin, Peter Lawton (DFO) and Myriam Lacharité for their assistance with the video analysis.
FINANCIAL SUPPORT
Funding was provided by the NSERC Strategic Network CHONe, NSERC Shiptime Allocation, and NSERC Discovery Grants to Anna Metaxas.


