Introduction
The increasing prevalence of Type 2 diabetes mellitus (T2DM) in recent decades has been widely reported, Reference Wang and Lobstein1,Reference Guariguata, Whiting, Hambleton, Beagley, Linnenkamp and Shaw2 and has been associated with increased risks of various conditions, including cardiovascular disease, renal insufficiency, and blindness. The genesis of these T2DM-related health risks has been shown to manifest in part during childhood and adolescence, Reference Hannon, Rao and Arslanian3 a finding which necessitates research into the relationship between childhood health profiles and incidence of adult disease. The ability to identify and preemptively treat younger patients at risk for future T2DM is one way the public health crisis of obesity can be addressed.
Childhood measures of body size – such as body mass index (BMI) and waist circumference (WC) – have been associated with several diseases. Reference Turley, Tobias and Paul4 In particular, childhood WC measurements have been associated with various adult conditions such as metabolic syndrome Reference Sun, Liang and Huang5,Reference Schmidt, Dwyer, Magnussen and Venn6 and abnormal adult cardiac structure. Reference Yang, Huynh, Venn, Dwyer and Marwick7 The identification of longitudinal trends in these childhood measures, such as that obtained through using group-based trajectory modeling (GBTM), can be used to empirically identify distinct clusters of individuals who follow similar developmental trajectories throughout childhood. Reference Nagin and Odgers8 GBTM was used to identify between four and five childhood BMI groups, some of which were shown to differ in adult body composition measures, Reference Péneau, Giudici and Gusto9 asthma, deficit in FEV1/FVC ratio, and elevated systolic (SBP) and diastolic (DBP) blood pressure. Reference Ziyab, Karmaus, Kurukulaaratchy, Zhang and Arshad10
Since there is evidence that WC has a stronger association with T2DM than BMI, Reference Feng, Zhao and Wang11 this study focuses on identifying trajectory groupings for both WC and waist circumference index (WCI). We evaluated whether distinct trajectory groups can be found for both measures during childhood and investigated the relationship between the resulting group probabilities with adult T2DM occurrence (primary outcome), as well as other secondary adult outcomes, including blood pressure, body size, body composition, and hemoglobin levels. To estimate trajectory curves, we use serial measurements from the Fels Longitudinal Study (FLS).
Methods
Participants
We included participants (N = 2567) from the FLS, who are enrolled at birth – without reference to any predetermined criteria, disease or condition, or health outcome – and followed throughout the life course. Examinations are performed semiannually from birth until 18 years, and biennially thereafter. Extensive details on the FLS and its participants can be found elsewhere. Reference Roche and Sun12,Reference Roche13 Parents provided consent to participate in the study and gave permission for their infants to be enrolled, while offspring were asked to participate at 7–10 years and were asked again for their consent when reaching 18 years. All procedures were approved by the Institutional Review Boards at Wright State University and Virginia Commonwealth University.
Selection criteria
Selection criteria for this investigation were established according to childhood measurements of WC taken between birth to 18 years of age. This time period was segmented into 36 6-month intervals. Participants with waist size measurements in five or more of these intervals were included in our analysis; all others were excluded. A minimum of five measurements was needed as we explored up to five-degree polynomial models. Among the total 2567 FLS participants, 591 participants were included based on sufficient WC measurements after removing those with too few observations. Of those, 514 participants also had height measured in at least five of the same childhood visits.
Measurements
As outcomes we selected adult diabetes, blood pressure, and anthropomorphic measurements taken between 20 and 70 years of age. An indicator of T2DM diagnosis was assigned the level “yes” if the participant satisfied any of the following criteria: (i) self-reported as diabetic, (ii) was assessed to be diabetic, (iii) was listed as taking diabetic medications, (iv) and/or had blood glucose levels larger than 125 gm/dL. The T2DM indicator was assigned the level “no” if a participant satisfied none of the criteria. Glycated hemoglobin (HbA1c, g/dL) was measured through a simple blood test that measures average blood sugar levels over.
Blood pressure included both SBP and DBP. SBP (mmHg) and DBP (mmHg) were each recorded as the average three readings from a standard mercury sphygmomanometer with participants in a seated position. Each blood pressure measurement was taken by rapidly inflating the arm cuff to the maximum level and deflating at a rate of 2 mmHg/s, with 30 s between readings. Reference Sabo, Wang, Deng, Sabo and Sun14
Anthropomorphic measures included BMI, WC and WCI divided by height in meters, fat free mass index (FFM), percentage body fat (PBF), and total body fat (TBF). Anthropomorphic measures were taken according to reference standards, Reference Lohman, Roche and Martorell15 with stature measured to 0.1 cm using a Holtain stadiometer, waist circumference – in children and adults – measured twice at the suprailiac crest (also to 0.1 cm), and weight measured to 0.1 kg using a SECA® scale. To reduce the effect of various body sizes, WCI was calculated as the ratio of WC to height (in meters) while BMI (kg/m2) was calculated as the ratio of weight to height2 (in meters). Reference Sabo, Wang, Deng, Sabo and Sun14 Total and regional body composition and bone density measurements were made using a dual energy X-ray absorptiometry or DXA. The information from a total body scan includes TBF, PBF, and TBF-free mass, with FFM calculated as the total body FFM measured from DXA scans divided by patient height squared. 16
Trajectory modelling
Childhood waist size groups were identified through GBTM, which probabilistically classifies subjects into groups with similar longitudinal trends. An advantage of the GBTM method is its ability to distinguish and characterize distinct developmental progressions which are readily identifiable using predetermined classification criteria (described below), as well as its ability to customize the number of potential trajectory groupings and the polynomial degree for modeling the trajectories within each group. Reference Nagin and Odgers8 For our analysis we used the PROC TRAJ macro in SAS (version 9.4, SAS Institute Inc., Cary, NC, USA). The outcomes in the trajectory models were the longitudinal childhood waist size measurements (WC and WCI). Measurements were grouped into 6-month intervals from 0 to 18 years of age. Where multiple measurements were found in a single interval the average of those measurements were taken as that interval’s value. Separate models were fit for the WC and WCI participant sets.
We estimated a model for each possible combination between number of groups (ranging between 2 and 5) and polynomial degree (ranging between 0 and 5). Our criteria for model selection were high average posterior probability of correct group designation (values greater than or equal to 0.7) and minimum group sizes of at least 5% of total participants; BIC steadily improved as the number of groups increased, and was therefore not used for model comparison. Models that failed to achieve the minimum average posterior probability or group size were declared inadmissible and were not considered further. For model selection we favored parsimony in group numbers and polynomial order. For the remaining models lower group number or polynomial order models were chosen if these simpler models had equal or higher average posterior probabilities.
Associations with adult outcomes
Adult measurements were split into five age-based categories: 20–29, 30–39, 40–49, 50–59, and 60–69. Associations with group posterior probabilities in T2DM incidence (the only binary adult outcome) were estimated using a logistic regression model, while associations between group posterior probabilities and other adult measurements were estimated using linear mixed models. In each model, patient sex, alcohol use history, and tobacco use history are included as the fixed effects, and a participant-level random effect (modeled using variance components) was included to account for within-subject dependence; note that some fixed effects were removed from some models due to convergence failures. Odds ratios or regression slopes, 95% confidence intervals, and P-values are reported. All analyses between childhood groups and adult outcomes were performed with PROC GLIMMIX.
Results
Data summary
The FLS database consists of 2567 participants with 44,133 observations. Participants lacking the required number of childhood measurements were removed from the analysis, leaving 591 participants for the WC set (7542 total observations, average of 12.8 measurements per participant, range of 5−27) and 514 participants for the WCI set (6161 total observations, average of 12.0 measurements per participant, range of 5−24). The measures with the largest number of subjects and total subject measurements tended to be the anthropomorphic measurements, although these numbers were high for SBP as well.
Group-based trajectory models
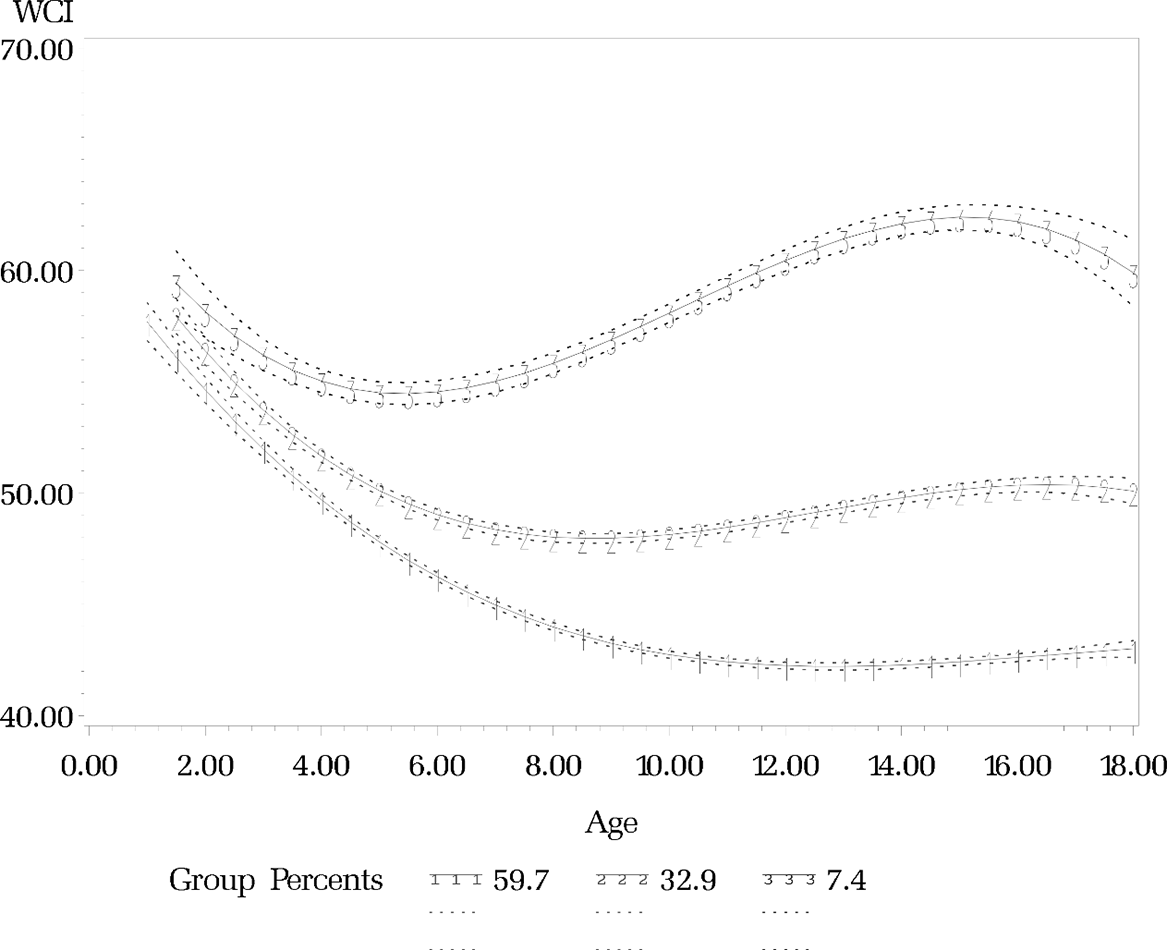
Following the criteria stated in the Methods section, we concluded that the most suitable trajectory model for the WC set was two groups of polynomial degree three (Figure 1). The low WC group (78.8%) was characterized by a relatively constant increase in WC over time, while the high WC group (21.2%) experienced a greater rate of WC growth beginning at 4 years of age. The trajectory model chosen for the WCI set was three groups of polynomial degree three. The trajectory of the low WCI group (59.3%) had a steady decrease in WCI before stabilizing around age 12. The medium WCI group (33.3%) was characterized by a shorter duration of decreasing WCI (ending at age 9), as well as a small increase at later ages. The high WCI group (7.4%) had the shortest decrease in WCI (reaching a nadir around age 5 years), before a sustained period of increasing WCI (reaching a peak around age 15). Detailed statistics and the trajectory plots are reported in Table 1 and Figure 2, respectively.
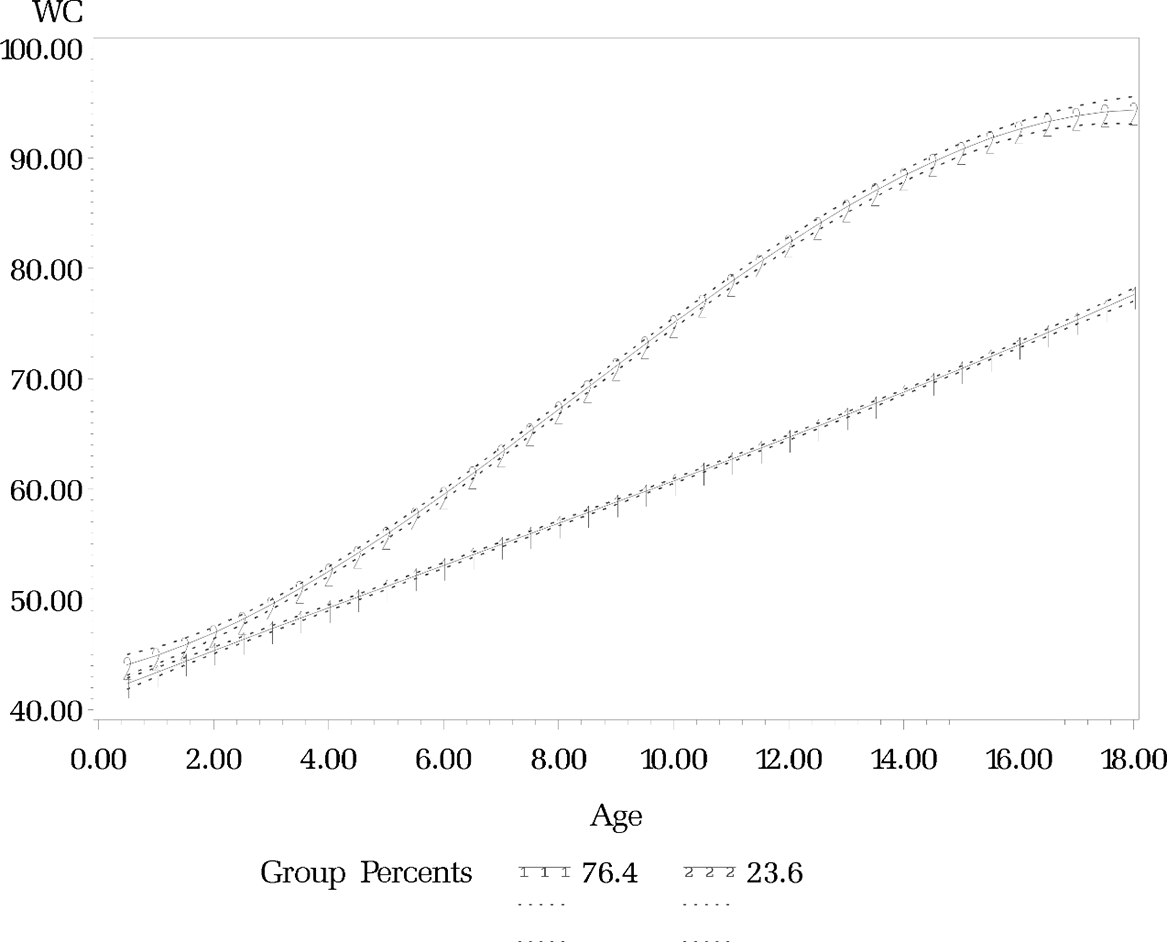
Figure 1. Predicted childhood waist size trajectories (ages 0–18) from group-based trajectory model of waist circumference. Shaded regions indicate 95% confidence intervals.

Figure 2. Predicted childhood waist size trajectories (ages 0–18) from group-based trajectory model of waist circumference index. Shaded regions indicate 95% confidence intervals.
Table 1. Estimated WC and WCI group probabilities and summaries
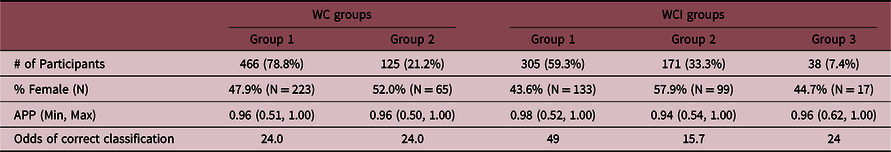
N, observed frequency; APP, average posterior probability; Mix./Max., minimum and maximum value.
Trajectory group and adult measure associations
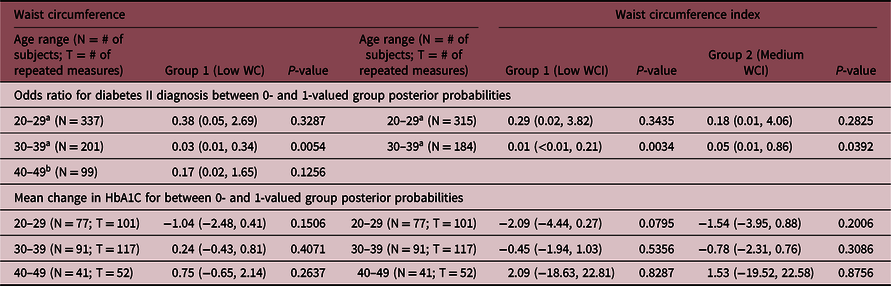
Summaries of the associations between WC and WCI trajectory groups and the adult measures are provided in Tables 2−4. For both the WC and WCI sets in the 30–39 year ranges, the odds of being diagnosed with diabetes decreased as the probability of being classified into the Low WC or Low WCI groups increased (the same results was observed for the Medium WCI group in the three-group model). Mean HbA1C levels were not significantly different at any age range between groupings for either WC or WCI.
Table 2. Adjusted regression slopes (and 95% CIs) between adult diabetes measurements and childhood waist size trajectory group posterior probabilities
All models adjusted for sex, tobacco, and alcohol use unless otherwise specified.
a Indicates model adjusted with sex, tobacco use, and alcohol use covariates.
b Indicates model adjusted with sex covariate only.
Table 3. Adjusted regression slopes (and 95% CIs) between adult blood pressure measurements by childhood waist size trajectory group posterior probabilities
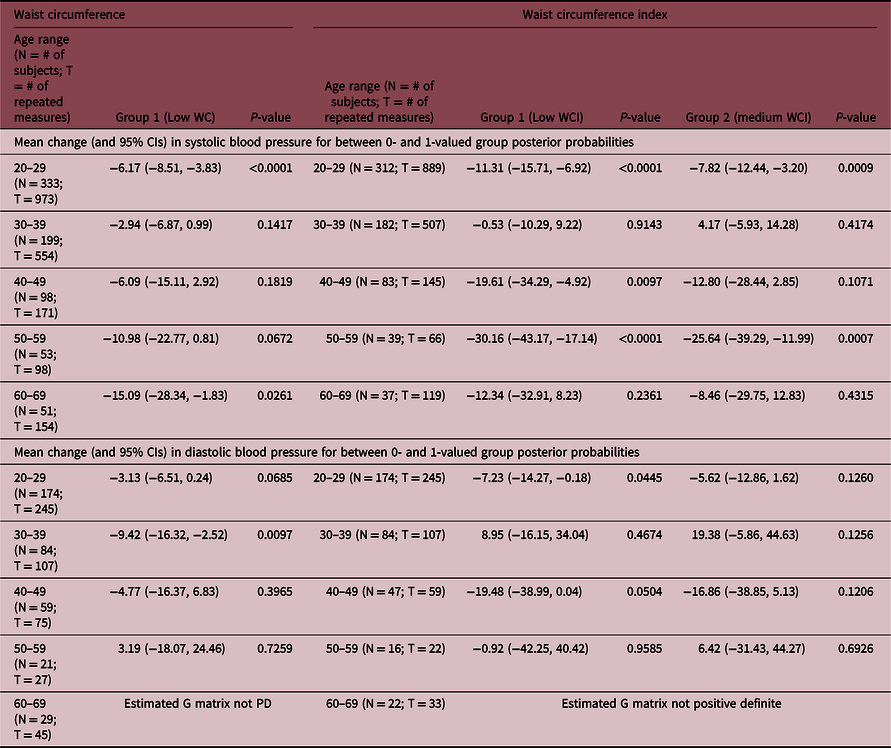
Table 4. Adjusted regression slopes (and 95% CIs) between adult anthropomorphic measurements and childhood waist size trajectory group posterior probabilities

There was evidence that the probability of belonging in the Low WC group was negatively associated with SBP at ages 20–29 and 60–69, with increasing probabilities leading to lower expected SBP. A similar observation was made for WCI, with significant negative associations in the 20–29, 40–49 and 50–59 age ranges. Probabilities for the Medium WCI were also negatively associated with SBP at ages 20–29 and 50–59. There were negative associations between DBP and Low WC probabilities between ages 30–39, and with Low WCI probabilities between ages 20–29.
Low WC group probabilities were significantly and negatively associated with every anthropometric measurement between ages 20–29 and 30–39, with increasing probabilities leading to lower expected values. Low WCI group probabilities were also significantly and negatively associated with every anthropometric measurement between ages 20–29, and were also negatively associated with BMI and WCI between ages 30–39, and with FFM between ages 40–49. Medium WCI group probabilities were significantly and negatively associated with every anthropometric measurement between ages 20–29, and were negatively associated with WCI between ages 30–39 and FFM between ages 40–49.
Discussion
We were able to identify distinct groups of children based on their childhood WC trajectories using GBTM, particularly finding groups of persistently low or persistently high WC and WCI, and possibly a group of moderate WCI. The estimated growth curves exhibited by these groups became distinguishably separate beginning at 4 years of age. We found that the probability of belong to the group exhibiting the larger waist size in childhood (as measured by both WC and WCI) was attributed a higher odds of developing T2DM from ages 30 to 39. These findings imply that children who exhibit trends of relatively larger waist size in childhood are at increased risk of developing T2DM later in life, and that these childhood trends can be distinguished from less risky trends at early ages.
In addition to our primary outcome, we also compared childhood group probabilities on adult HbA1C, blood pressure, and various anthropomorphic measurements. No age range exhibited evidence of differences in HbA1C levels based on childhood WC or WCI. Adults aged 20–29 years who were more likely classified as having higher childhood WC or WCI were likely to have higher SBP as adults than those with lower WC or WCI. Adult DBP between ages 30–39 years was greater in those who had higher childhood WC or WCI than in those with lower childhood WC or WCI. Adults with higher WC or WCI in childhood had consistently riskier levels of adulthood anthropometric measures from ages 20–29 years and 30–39 years than did those with lower WC or WCI in childhood.
The results described above are consistent with findings from previous research. Fagherazzi et al., Reference Fagherazzi, Vilier, Affret, Balkau, Bonnet and Clavel-Chapelon17 using GBTM to form trajectory groups of women’s self-reported childhood body shape, found that groups characterized by a sharp increase in body size or a consistently large body size were at greater risk of adult T2DM than those of consistently moderate body size. Zhang et al. Reference Zhang, Xu and Li18 found that the linear slopes of childhood BMI growth were not significantly associated with adult T2DM for children ages 5–9, but were for the linear slopes of adolescents ages 10–19 years. To our knowledge no previous research has been done on the relationship between childhood WC and adult T2DM. Our secondary analyses are also supported by previous studies comparing childhood BMI to adult anthropometric outcomes. Reference Péneau, Giudici and Gusto9,Reference Demerath, Reed and Choh19 Importantly, our work adds to this literature by providing evidence of groups of high and low WC growth curves throughout childhood (both with and without adjusting for height), that appear to begin as early as 4 years of age, and that are associated with increased risk of T2DM early in adulthood.
There are several strengths and limitations in this work. As an observational study based on a longitudinal cohort, our findings do not imply causality between childhood WC and adulthood T2DM, and should be viewed as speculative and in need of prospective confirmation. However, these observations are based on the FLS and provided large numbers of observations per subject, which are suitable for estimating trajectory curves and identifying childhood waist size groupings. Likewise, the life-course nature of the FLS allowed for relationships to be investigated between childhood and adulthood, with some subjects providing measures as late as 60–69 years of age. As most FLS participants are non-Hispanic whites, our study sample and evidence drawn from these analyses may not be generalizable or applicable to other races and ethnicities. One advantage of the FLS data is that study participants were not selected by any preexisting criteria. The unequal distributions and numbers of childhood measurements per participants in the FLS are mitigated by the large number of childhood observations, as well as the reliance of the GBTM on polynomial regression modeling, which does not require balanced measurements between participants.
Viewed in the wider context of health science linking childhood obesity to T2DM, the evidence presented in this manuscript suggests that the risk of T2DM in adulthood is associated with childhood WC, and that it may be possible to identify children who fit this high-risk profile at a relatively early age. The early detection of high-risk children may inform health care workers when medicinal or behavioral intervention may be appropriate, and could be used to educate parents on when to seek pediatric guidance.
Acknowledgements
None.
Financial Support
This research was supported by grant R01AG048801 from the National Institute of Aging, as well as by the Biostatistics, Epidemiology and Research Design (BERD) core of the C. Kenneth and Dianne Wright Center for Clinical and Translational Research (CTSA) award number UL1TR002649 from the National Center for advancing Translational Sciences.
Conflicts of Interest
The authors declare no conflicts of interest.
Ethical Standards
The authors assert that all procedures contributing to this work comply with the ethical standards of the Helsinki Declaration of 1975, as revised in 2008. All participants provided written informed consent to participate in this study, and all procedures were approved by the Institutional Review Boards at Wright State University and Virginia Commonwealth University.