Introduction
Human impacts on natural ecosystems are predicted to reduce biodiversity at regional scales by facilitating expansion for a few species with wide habitat requirements (generalists, ‘winners’) at the expense of species with narrow habitat requirements (specialists, ‘losers’) (Baskin Reference Baskin1998; McKinney & Lockwood Reference McKinney and Lockwood1999). Several studies suggest a relationship between climate warming and latitudinal (Parmesan & Yohe Reference Parmesan and Yohe2003; Hickling et al. Reference Hickling, Roy, Hill, Fox and Thomas2006) and altitudinal (Lenoir et al. Reference Lenoir, Gegout, Marquet, de Ruffray and Brisse2008; Parolo & Rossi Reference Parolo and Rossi2008; Bergamini et al. Reference Bergamini, Ungricht and Hofmann2009) distribution shifts of organisms of various taxa. Recent modelling predicts the cover of northern and boreal-montane lichen species will decline as a consequence of climate change in Britain (Ellis et al. Reference Ellis, Coppins, Dawson and Seaward2007). Studies of climate change effects on the distribution of alpine species typically predict range contractions at the low-altitude boundary (Giusan & Theurillat Reference Guisan and Theurillat2000). For alpine plant communities, competitive lowland species have expanded their distribution ranges during the last 50 years (Klanderud & Birks Reference Klanderud and Birks2003; Britton et al. Reference Britton, Beale, Towers and Hewison2009). Consequently, a continued climate change will progressively shrink low-temperature/ high-elevation habitats (Gottfried et al. Reference Gottfried, Pauli, Futschik, Akhalkatsi, Barančok, Alonso, Coldea, Dick, Erschbamer and Fernández Calzado2012), with negative impacts on habitat specialists due to both loss of habitat and increased interspecific competition from lowland species (Choler et al. Reference Choler, Michalet and Callaway2001; Heegaard & Vandvik Reference Heegaard and Vandvik2004).
Boreal lichen species have low photosynthesis temperature optima, and can achieve net carbon gain even at temperatures below freezing point. The key factor limiting lichen photosynthesis is often water availability (Sonesson Reference Sonesson1989; Hauck Reference Hauck2011). Projected changes in climatic conditions feature both higher annual temperatures and increased precipitation (IPCC 2007). These changes could increase overall lichen growth, alter the interspecific interactions either among lichen species or between lichens and other organisms, and introduce changes in their habitats by altering the depth and duration of snow cover (Insarov & Schroeter Reference Insarov, Schroeter, Nimis, Scheidegger and Wolseley2002).
Sulphur (S) emissions and deposition in western Europe have decreased dramatically in recent decades (Vestreng et al. Reference Vestreng, Myhre, Fagerli, Reis and Tarrason2007), with a positive impact on lichen communities in many regions (Nimis et al. Reference Nimis, Scheidegger and Wolseley2002). However, atmospheric deposition of nitrogen (N) has increased in Europe (Galloway et al. Reference Galloway, Dentener, Capone, Boyer, Howarth, Seitzinger, Asner, Cleveland, Green and Holland2004). In Norway, S deposition has decreased by 15% during the last 10 years, whilst the nitrogen deposition increased by 2% in the same period (Aas et al. Reference Aas, Hjellbrekke, Hole and Tørseth2008). Nitrogen deposition is a major driver of biodiversity change in terrestrial ecosystems (Vitousek et al. Reference Vitousek, Aber, Howarth, Likens, Matson, Schindler, Schlesinger and Tilman1997; Bobbink et al. Reference Bobbink, Hicks, Galloway, Spranger, Alkemade, Ashmore, Bustamante, Cinderby, Davidson and Dentener2010; van den Berg et al. Reference van den Berg, Vergeer, Rich, Smart, Guest and Ashmore2011). Several lichen species may experience increased growth with a moderate increase in available N (Kauppi Reference Kauppi1980; Holopainen & Kärenlampi Reference Holopainen and Kärenlampi1985; Von Arb & Brunold Reference Von Arb and Brunold1990). This could affect interspecific interactions and possibly lead to a loss of sensitive species from lichen communities (Geiser & Neitlich Reference Geiser and Neitlich2007).
Climate change and atmospheric deposition are both potential drivers of lichen community distribution and composition that act at regional and local (i.e. altitudinal) spatial scales. We therefore need studies that incorporate these spatial scales to draw general conclusions about the effects that changes in these forces will have on lichen communities (Hawksworth Reference Hawksworth, Nimis, Scheidegger and Wolseley2002). Regional differences in lichen community composition are the result of climate variables such as temperature and precipitation (e.g. Werth et al. Reference Werth, Tommervik and Elvebakk2005; Ellis & Coppins Reference Ellis and Coppins2006; Will-Wolf et al. Reference Will-Wolf, Geiser, Neitlich and Reis2006). At local scales, lichen communities are influenced more by variations in microclimate, tree age and size (Johansson et al. Reference Johansson, Rydin and Thor2007), and stand age and tree species composition (Will-Wolf et al. Reference Will-Wolf, Geiser, Neitlich and Reis2006).
This study investigated changes in community composition and abundance of dominant lichen species over 15 years in subalpine Norwegian birch forests, using repeated measurements of epiphytic lichen cover at five monitoring sites. The sites represent regional gradients in temperature and precipitation as well as in deposition of N and S compounds. Study plots within sites were located along a local climatic gradient (altitude). The study is part of the ongoing ‘Monitoring Programme for Terrestrial Ecosystems (TOV)’, financed by the Directorate for Nature Management in Norway.
We used two dominant species to investigate the hypothesized effect of human impact on generalist vs. specialist species: the generalist species Hypogymnia physodes (L.) Nyl. and the subalpine birch forest specialist Melanelia olivacea (L.) Essl. Specifically, we asked three questions. 1, Are potential changes in species composition and cover of dominant species a result of variation in large-scale climatic and pollution variables? 2, Does the generalist species H. physodes increase and the specialist M. olivacea decline in abundance over time? 3, If so, is this increase affected by local climatic gradients, that is, is the change in abundance slower in high-altitude than low-altitude plots?
Methods
Study area
Norway features large regional differences in both climate (temperature and precipitation gradients) and atmospheric deposition of S and N (Fig. 1). To cover these gradients, five monitoring sites were established between 1990-93. We selected sites in protected areas located far from local pollution sources to reduce the impact of local factors such as forestry and local pollution.
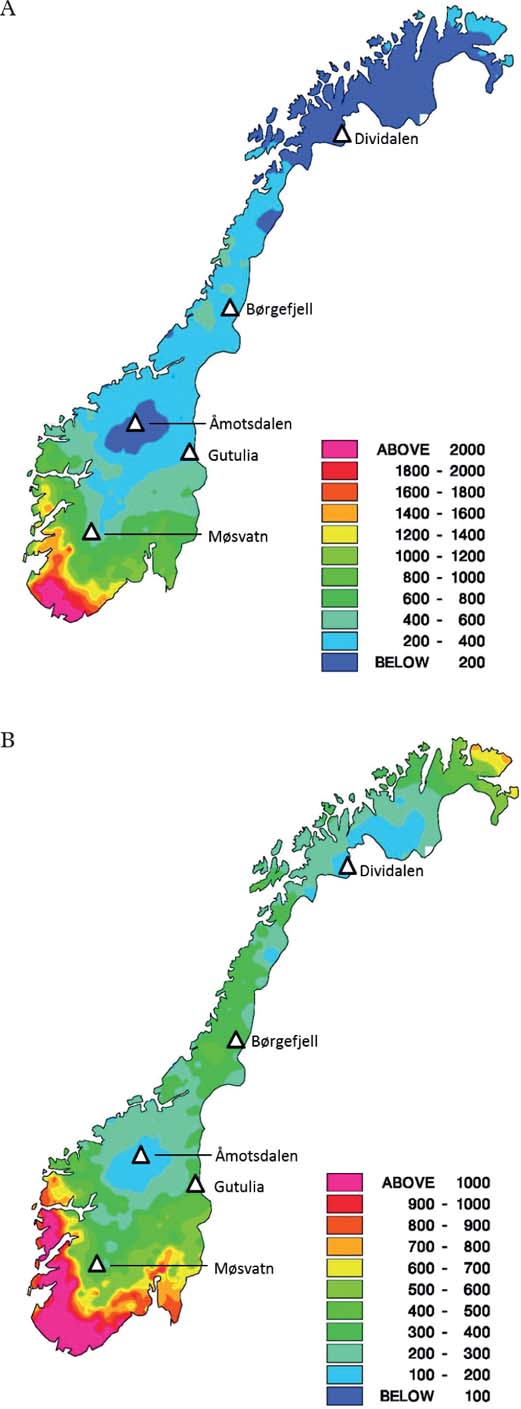
Fig. 1. Total annual deposition in the period 1988–1992 (mg m–2 yr–1) in Norway. A, nitrogen (oxidised plus reduced); B, sulphur (non-sea salt sulphate). Symbols represent locations of the five monitoring sites established in the period 1990–1993.
Each site included five study plots (six in Børgefjell). Local environmental conditions (substratum type, substratum size and stand density) were standardized by setting criteria for inclusion of plots. Plots were located in subalpine birch forests (Betula pubescens Ehrh.), with bilberry (Vaccinium myrtillus L.) dominating in the field layer. Each plot had a 10 m radius, and the centre of the plot was marked with an aluminium pole. Each study plot contained a minimum of 10 trees between 35 and 60 cm in diameter at breast height (1·3 m, dbh), without broken main branches or tops. We randomly selected seven trees and marked them with yellow paint c. 1 m above ground. Plots within sites were selected to span the altitude range at each site (Table 1). The horizontal length of study sites across their altitudinal range varied from 250 to 2000 m, thus the distance between two adjacent plots varied between 20 and 700 m.
Table 1. Study sites, sampling times, and pollution and climate variables used to characterize the conditions before first sampling time (N and S data from the period 1988–92; climate data from the 30-yr period 1961–90) and over the 5-yr intervals between sampling.
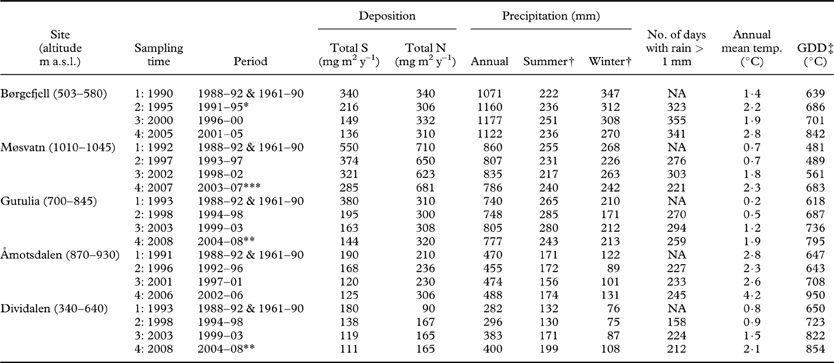
* for N and S 1992–95
** for N and S 2004–06
*** for N and S 2003–06
† Summer, June–August; winter, December–February
‡ Growing degree days: the sum of mean daily temperature >5°C
After sites were established in 1990–93 (sampling time 1), each site was visited at five-year intervals; sampling time 2 between 1995–98, sampling 3 in 2000–03 and sampling 4 in 2005–08 (Table 1). At the second monitoring event, a supplementary tree was added in each study plot to increase the number of trees investigated to eight. Trees dying between monitoring events were replaced at each census. A total of 240 different trees were included in the study: 151 trees were sampled at all four monitoring events, 43 were sampled at three events, and 26 and 20 trees were sampled twice and once, respectively.
We recorded species composition during summer months (June, July and August), using five permanent horizontal transect lines established on each trunk. The lowest line was established at 130 cm above ground level except in Børgefjell, where the lowest lines were placed at 150–190 cm (varying among plots) because of greater snow depth. The distance between lines was 10–20 cm. To record the abundance of epiphytic species, a measuring tape was stretched around the trunk at each transect line, and presence/absence of the species was recorded at each cm of the measuring tape. The cover of a species on a tree was given as the percentage of the total sum of cm recorded on the tree in which the species was present (summed over all five transect lines). Species of Cladonia, Bryoria and Usnea were determined only to genus level, and some individuals that were difficult to identify crustose lichens were also determined to genus level. Determination of species was mainly done in the field, but for species hard to identify, samples were taken outside of transect lines (and preferably not on study trees) and determined in the laboratory. Nomenclature follows Santesson et al. (Reference Santesson, Moberg, Nordin, Tønsberg and Vitikainen2004).
Study species
The generalist species Hypogymnia physodes is a circumpolar species with a wide ecological amplitude (Ahti Reference Ahti and Seaward1977; Esseen Reference Esseen1981). It is characterized as one of the most frequent and abundant epiphytic species throughout most of the boreal zone (Ahti Reference Ahti and Seaward1977), and it has high diaspore production and effective dispersal (Hilmo et al. Reference Hilmo, Holien, Hytteborn and Ely-Aalstrup2009). The specialist species Melanelia olivacea is restricted to subalpine forests, occurring mainly on birch (Esseen Reference Esseen1981). It is found both in Eurasia and America, but is particularly common in Eurasia (Ahti Reference Ahti and Seaward1977). Its vertical distribution on tree trunks is strongly related to the snow cover, as it does not tolerate extended and repeated periods of exposure to snow or ice (Sonesson et al. Reference Sonesson, Osborne and Sandberg1994).
Explanatory variables
To describe the sites, we used data from the period 1961–1990 to represent pre-study average climate; temperature [annual mean temperature, growing degree days (sum of daily temperatures >5°C)], and precipitation (annual precipitation, summer precipitation, autumn precipitation) were taken from meteorological stations close to the sites (data from The Norwegian Meteorological Institute; www.eklima.no; Table 1). In order to characterize the climate in the five-year periods between each sampling event, we constructed the following variables based on meteorological data from the July of sampling time 1 to the June of sampling time 2: total precipitation (mm), summer precipitation (June–August; mm), autumn precipitation (September–November; mm), number of days with rain >1 mm, mean annual temperature (°C), and growing degree days (°C).
Data on total deposition of S and N were provided by the Norwegian Institute for Air Research. The sea salt contribution to the S deposition was omitted. Interpolation techniques (‘kriging’) were used to estimate annual deposition in 1×1 km grid cells covering the whole of Norway. Wet deposition estimates were based on precipitation samples from c. 30 stations in Norway. Combined with precipitation level data from national meteorological stations, annual estimates of wet deposition in each grid cell were calculated (for details see Hole & Tørseth Reference Hole and Tørseth2002). Dry deposition was estimated from the seasonal mean airborne concentration and assessed dry deposition velocities. When estimating the grid cell average dry deposition, deposition was weighted on the distribution of land use types (forested, non-forested) in the individual grid cells (Hole & Tørseth Reference Hole and Tørseth2002; Aas et al. Reference Aas, Hjellbrekke, Hole and Tørseth2008). We used these data to calculate 5 yr averages of N and S deposition for each study site (Table 1).
Statistical analyses
To reveal the main gradients in the species composition, we performed unconstrained ordination by use of DCA (Detrended Correspondence Analysis; ter Braak & Prentice Reference ter Braak and Prentice1988) in parallel with NMDS (Non-Metric Multidimensional Scaling; McCune & Grace Reference McCune and Grace2002), as recommended by Økland (Reference Økland1996). Axes revealed by both methods were considered reliable gradients in species composition. Ordinations were run on two datasets: 1) the species×tree matrix collected at sampling time 1, hereafter referred to as the First-DCA/First-NMDS, and 2) the full species×tree matrix, including data from sampling times 1–4 for all five sites, hereafter referred to as the Full-DCA/Full-NMDS. Only taxa present on >10% of the trees in the full dataset (pooled over sites and years; 805 trees and 13 taxa) were included in these analyses. Similarity between pairs of DCA and NMDS axes was assessed by calculating the non-parametric Kendall's τ between tree scores. Results from NMDS were comparable to DCA results (see results section), and DCA results were chosen for further interpretation.
To test whether the same gradient in species composition was revealed in the First-DCA and the Full-DCA, we calculated the Kendall correlation between tree placement in the First-DCA and tree placement at sampling time 1 in the Full-DCA, for axes 1 and 2. To investigate change in species composition over time, we calculated the displacement along Full-DCA axis 1 from one sampling time to the next for each tree.
Ordinations were run with R v. 2.10.1, with the package ‘vegan’, DCA with standard options (detrending by segments, non-linear rescaling) and NMDS with the function metaMDS with Bray-Curtis dissimilarity index (Oksanen et al. Reference Oksanen, Blanchet, Kindt, Legendre, Minchin, O'Hara, Simpson, Solymos, Stevens and Wagner2011).
We investigated differences in community composition between sites in the First-DCA with linear mixed-effect models (LME; Pinheiro & Bates Reference Pinheiro and Bates2000) with tree score along First-DCA 1 and First-DCA 2 as response variables and climate and pollution as explanatory variables, with tree nested in plot nested in site as random factors to account for the spatial design of the study. LME models are well suited to handle spatially nested data and repeated measurements on the same objects (Crawley Reference Crawley2003).
Difference in change in species composition between sites, measured as tree displacement along Full-DCA 1, was tested with LME (site and period between censuses as fixed factors, tree nested in plot as random factor). Between-site differences in lichen cover were investigated with lichen cover as the response variable and site and time (continuous) as explanatory variables (tree nested in plot used as random factor). To evaluate the effect of climate and pollution on the lichen communities, we tested changes in species composition (displacement along Full-DCA 1), changes in lichen cover, and change in the abundance of H. physodes and M. olivacea as a function of the explanatory variables with LME models. Tree was included as a random factor to account for repeated measurements, and tree nested in plot nested in site as random factors to account for the spatial design of our study. We used forward selection of explanatory variables, and to select among competing models we used model evaluation with the AIC criterion (Crawley Reference Crawley2003). Only models with the lowest AIC for each test are presented.
Changes in the abundance of species over time along the local climatic gradient were investigated for each site. We used mixed-effect models with species abundance as the response variable, position in the altitudinal gradient (from 1 in the lowest-lying plot to 4–6 in the highest-lying plot) and time as continuous predictor variables, and tree nested in plot as random factor. We ran models including the time and altitude interaction to investigate whether there was any difference in the magnitude of abundance change in relation to the local climatic gradient.
Cover data were arc-sine transformed prior to the univariate analyses to reduce heteroscedasticity. Mixed-effect models were performed with R v. 2.10.0 (R Development Core Team 2008), package ‘nlme’ (Pinheiro et al. Reference Pinheiro, Bates, DebRoy and Sarkar2008).
Results
Composition of the lichen communities
A total of 59 lichen taxa were recorded during the study, representing epiphytic lichen communities normally referred to as oligotrophic (Du Rietz Reference Du Rietz1945; Hultengren et al. Reference Hultengren, Martinsson and Stenström1991).
A total of 21 taxa were macrolichens and 38 microlichens. Of these, 13 taxa occurred on >10% of the trees in the full dataset. Species richness was generally low (Appendix 2), ranging from 1–16 species per tree. The most frequent species were Parmelia sulcata Taylor and Parmeliopsis ambigua (Wulfen) Nyl., occurring on 90% and 83% of all trees, respectively. The species with the highest mean cover were H. physodes (25%) and M. olivacea (11%).
The first two axes of the First-DCA and the First-NMDS were strongly correlated (τ=0·875, P<0·001 and τ=0·568, P< 0·001 for axis 1 and 2, respectively), corroborating the reliability of the axes as main gradients in species composition. Similarly, the first axis of the Full-DCA and the Full-NMDS were strongly correlated (τ=0·826, P<0·001), while the second axis was weaker, but significantly correlated (τ=−0·261, P< 0·001). Environmental interpretation was restricted to the DCA ordinations.
Variation in lichen species composition between sites at the start of the study was indicated by eigenvalues of First-DCA axes 1 and 2 of 0·45 and 0·20, and axis lengths of 2·40 and 2·33 S.D. units (total inertia; TI=1·46). There was a clear regional gradient in the species composition at the start of the study (Fig. 2A). Tree placement along First-DCA axis 1 could best be explained by mean summer precipitation in the 30-year period preceding the study (t=−12·05, df=3, P=0·001). The two sites with a continental climate and low summer precipitation were centred at the right end of axis 1, whereas the more humid sites were located at the left end of axis 1. The species scores showed that H. physodes and M. olivacea were located in the left (humid) and right (dry) end of axis 1, respectively (Fig. 2A). We found no effect on tree placement along First-DCA 2 of measured environmental variables (results not shown).
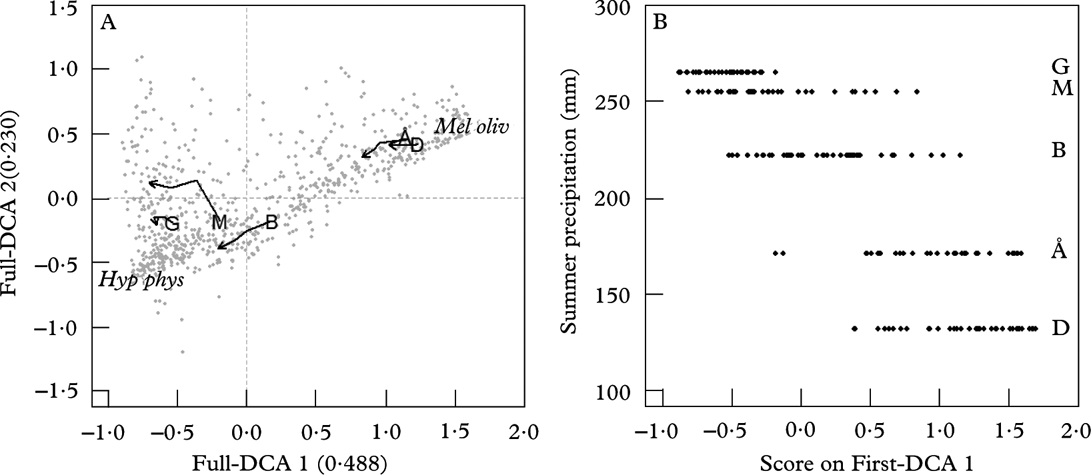
Fig. 2. A, DCA ordination of 805 trees×13 taxa in 5 sites at four sampling times (Full-DCA), with eigenvalues of axis 1 and 2 in brackets; each grey point represents a tree. The large letter represents the centroid of the site placement at time 1, and the lines show the movement of site centroids in ordination space through time. B, tree score along First-DCA 1 against mean summer precipitation (mm) in the 30-y period preceding the study. Å= Åmotsdalen, B=Børgefjell, D=Dividalen, G=Gutulia, M=Møsvatn. Hyp phys=species centroid for Hypogymna physodes at time 1, Mel oliv=species centroid for Melanelia olivacea at time 1.
Tree placement at sampling time 1 along axis 1 of the Full-DCA was highly correlated with tree placement along axis 1 of the First-DCA (τ=0·961, P<0·001), suggesting that the same gradient in environmental factors underlies the two ordinations. Axis 2 of the First- and Full-DCA were weakly correlated (τ=−0·237, P<0·001). Eigenvalues of Full-DCA axes 1 and 2 were 0·49 and 0·23, respectively, with axis lengths of 2·61 and 2·29 S.D. units (TI=1·43). The change in species composition during the study period varied between sites (Table 2). The average tree displacement along Full-DCA 1 from one sampling time to the next was largest for trees in Møsvatn, followed by Børgefjell, and was smallest for trees in Gutulia (Fig. 2, Table 2).
Table 2. LME results for change in species composition (measured as tree displacement along Full-DCA 1) as a function of site, and total lichen cover (arc-sine transformed) of epiphytic lichens as a function of site, time (continuous) and tree height. The intercept represents mean DCA displacement/mean cover in Børgefjell at time 1. Parameter estimates of random factors (tree ID, nested in plot) are not shown.
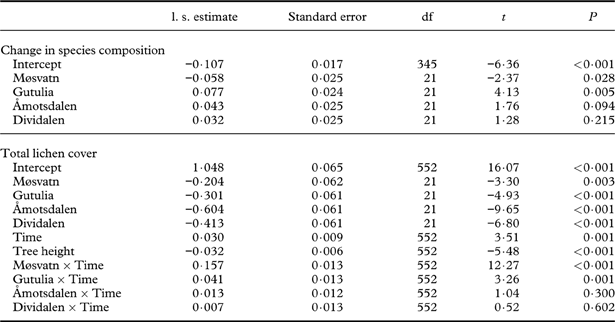
The total lichen cover (%) varied between sites, being higher in humid than in dry continental sites (Table 2, Fig. 3). Lichen cover increased over time in all sites, most in Møsvatn followed by Gutulia (significant site×time interaction; Table 2), but least in Børgefjell where lichen cover was relatively stable over time. Lichen cover was not related to tree diameter, but was weakly and negatively correlated with tree height (Table 2). The notable increase in mean lichen cover on trees in Møsvatn (from 60% in 1992 to 80% in 1997 to 95% in 2007) was partially due to a large increase in Bryoria spp.; from 2% in 1992 to above 20% in 2007.
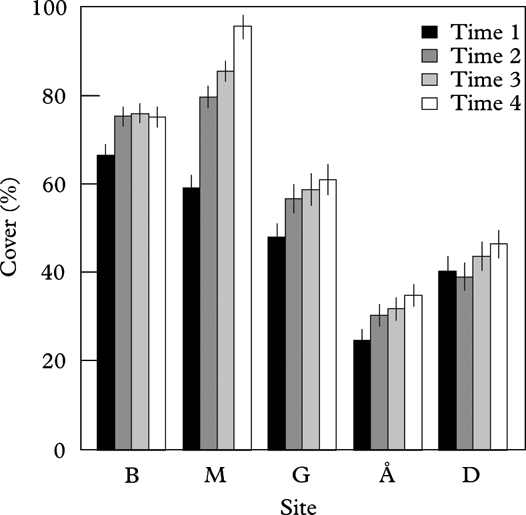
Fig. 3. Mean cover (%) of epiphytic lichens on tree trunks in each site at the four recording times. Vertical error bars represent standard error of the mean (n= 155). Sites are arranged from high to low annual precipitation. B=Børgefjell, M=Møsvatn, G=Gutulia, Å=Åmotsdalen, D=Dividalen.
The explanatory variable most strongly related to tree displacement along Full-DCA 1 was total S deposition (Table 3), and the inclusion of other explanatory variables did not improve the model fit. This result suggests that trees exposed to high levels of S deposition had the largest change in species composition. It is probably driven by the high S deposition and large reduction in S load particularly in Møsvatn, but partially also in Børgefjell, during the study period (Table 1). Similarly, change in lichen cover was positively related to total S deposition, with an additional positive response to mean summer precipitation and negative response to autumn precipitation; that is, the increase in cover on birch trunks was largest in sites with high S deposition and humid summers, but less in sites with humid autumns (Table 3).
Table 3 LME results of change in species composition (tree displacement along DCA 1) and lichen cover as a function of explanatory variables. Only the models with the lowest AIC are shown. Parameter estimates for random factors (tree ID, nested in plot, nested in site) are not shown.

Abundance change of H. physodes and M. olivacea
Abundance of H. physodes at the start of the study was positively correlated with summer precipitation (Fig. 4A). Change in the abundance of H. physodes was positively correlated with autumn precipitation as well as N deposition, with the increase largest in sites with high autumn precipitation and high N deposition (Table 4). Models with annual precipitation or summer precipitation had equal explanatory value to the model with autumn precipitation (results not shown). For M. olivacea, abundance at the start of the study was negatively related to summer precipitation (t=−4·286, df=24, P<0·001), and there was a negative relationship between the abundance of H. physodes and M. olivacea (Fig. 4B). Correspondingly, the change in abundance of M. olivacea was negatively related to N deposition and annual precipitation (Table 4).
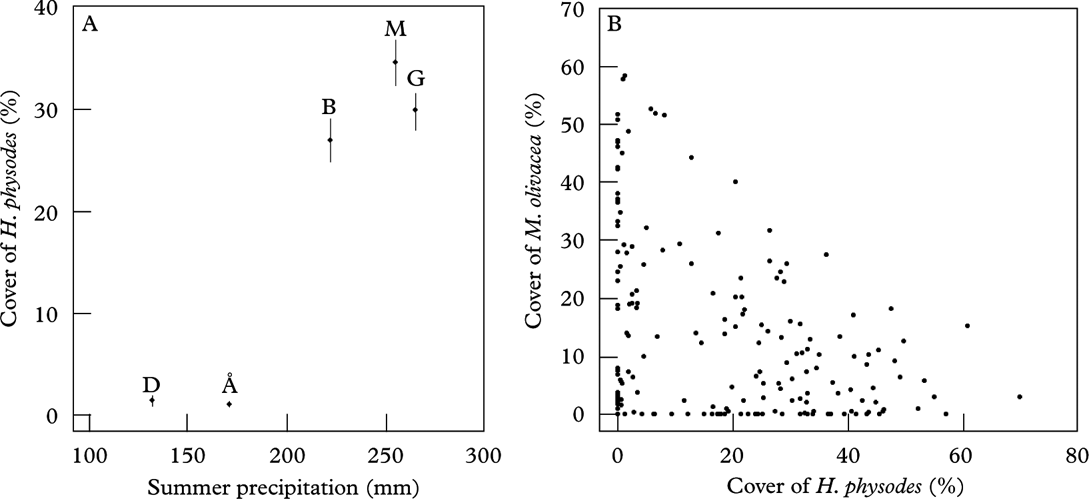
Fig. 4. A, mean site cover (vertical bars represent SE) of Hypogymnia physodes at the start of the study; B, cover of Melanelia olivacea on each tree plotted against cover of H. physodes at the start of the study (1990–93).
Table 4. LME results of abundance change of Hypogymnia physodes and Melanelia olivacea in five sites over three 5-yr intervals as a function of explanatory variables. Parameter estimates of random effects (tree ID, nested in plot, nested in site) are not shown.

In Børgefjell, H. physodes increased notably over time, but neither the distribution nor change in abundance were related to the altitudinal gradient (Table 5; Fig. 5A). For M. olivacea, the decrease in abundance was largest in the highest-lying plots (Table 5; Fig. 6A).
Table 5. LME results of abundance as a function of time and relative altitude for Hypogynmia physodes and Melanelia olivacea over four monitoring events in each of five monitoring areas. Abundance is arc-sine transformed. Parameter estimates of random effects (tree ID, nested in plot) are not shown. Sites are arranged from high to low annual precipitation.
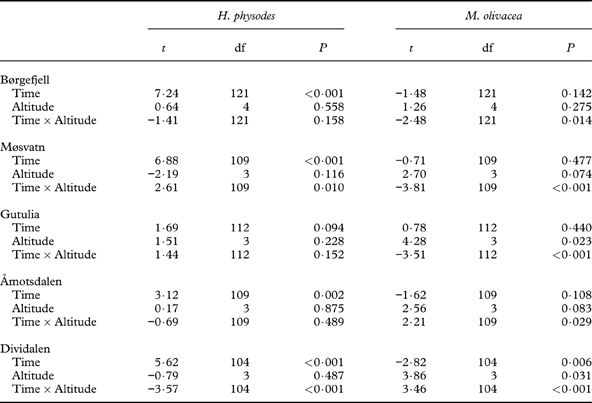
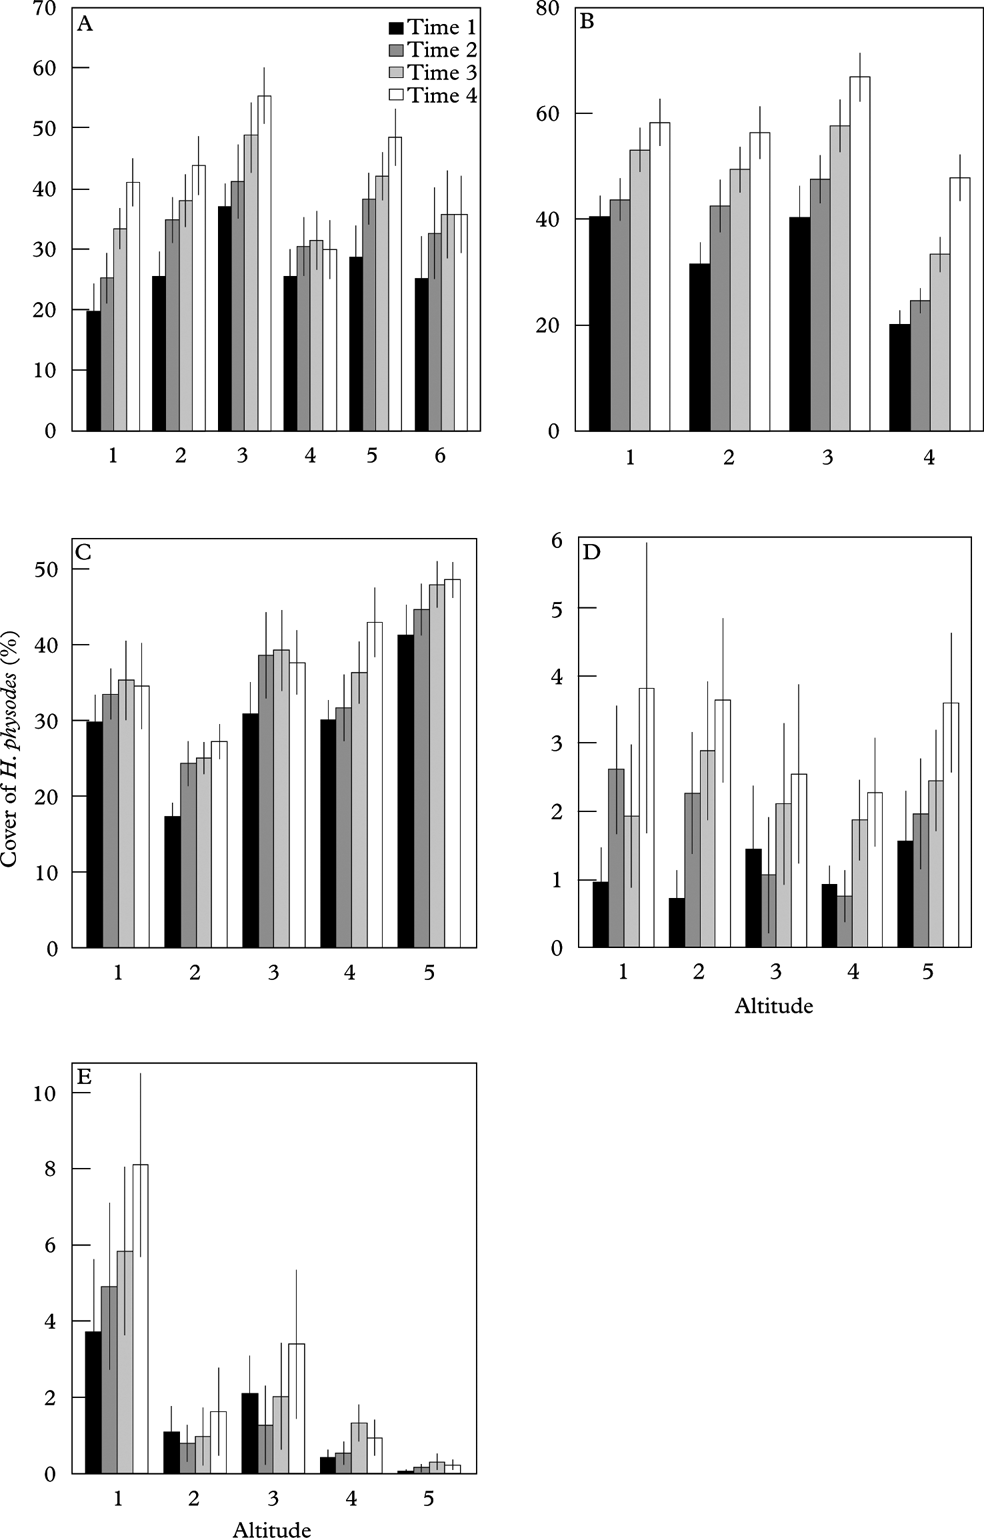
Fig. 5. Cover of Hypogymnia physodes at the four monitoring times. A, Børgefjell; B, Møsvatn; C, Gutulia; D, Åmotsdalen; E, Dividalen. Bars represent mean cover in each plot in the local climate gradient, where 1 represents the lowest-lying plot and vertical error bars represent standard error of the mean n=155. Note that the scale of the y-axes differ between plots. Sites are arranged from high to low annual precipitation.
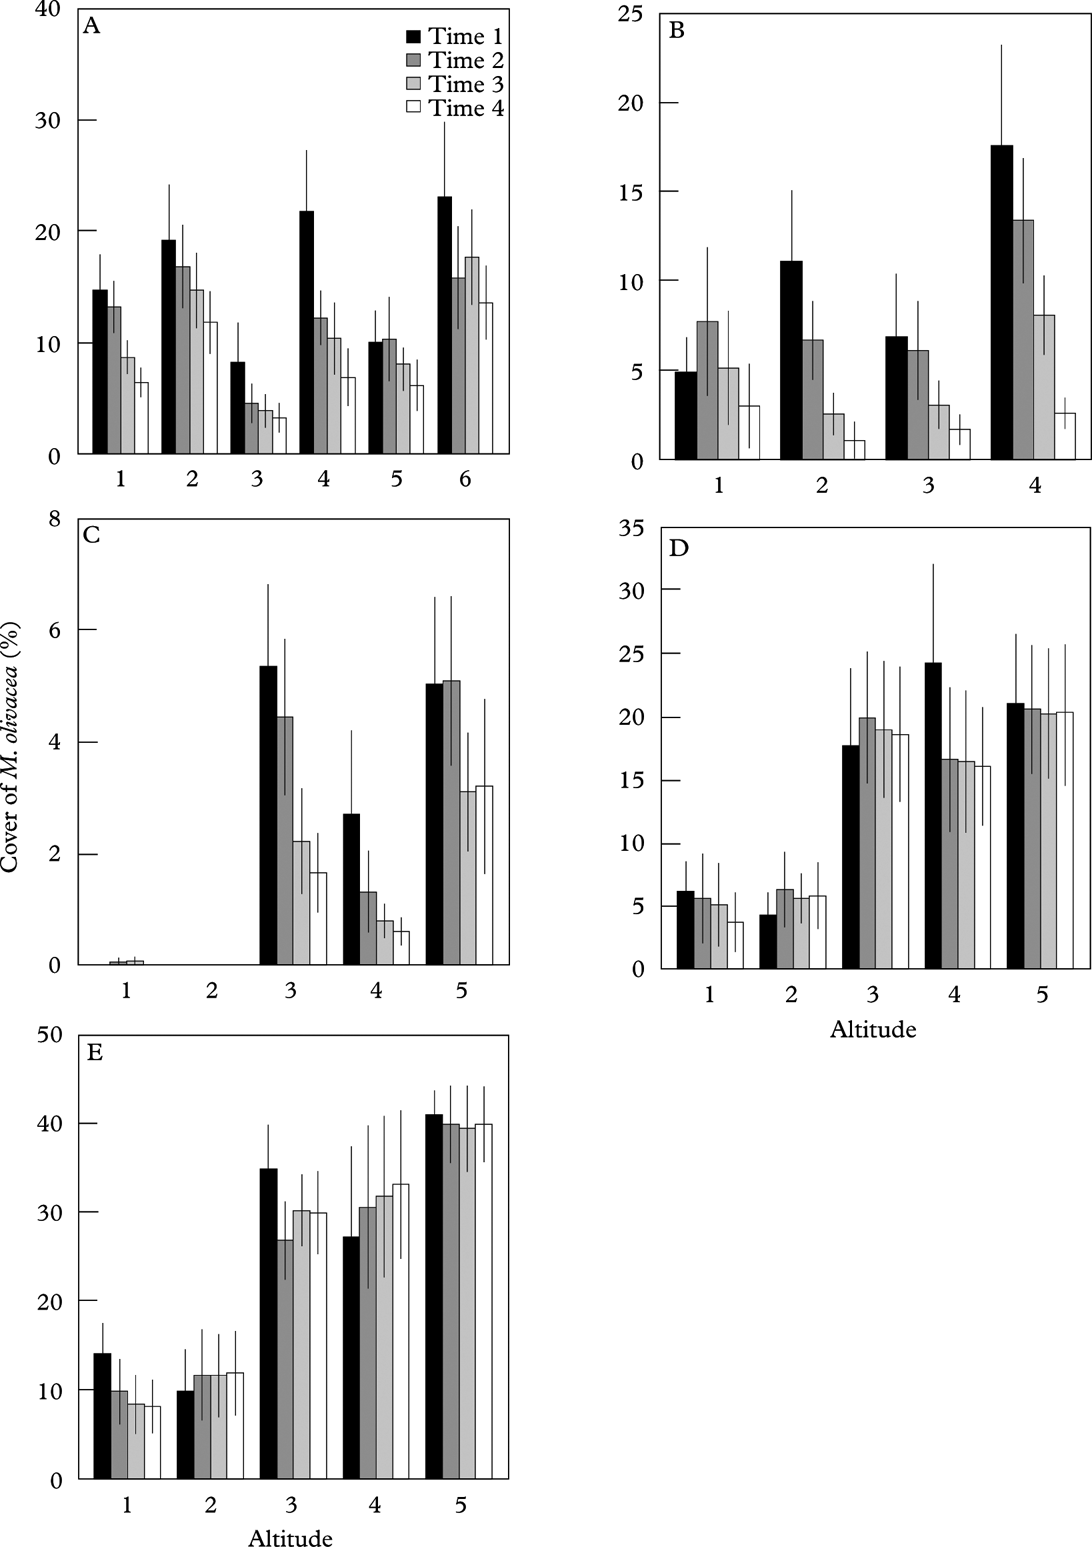
Fig. 6. Cover of Melanelia olivacea at the four monitoring times. A, Børgefjell; B, Møsvatn; C, Gutulia; D, Åmotsdalen; E; Dividalen. Bars represent mean cover in each plot in the local climate gradient, where 1 represents the lowest-lying plot, and vertical error bars represent standard error of the mean n=155. Note that the scale of the y-axes differ between plots. Sites are arranged from high to low annual precipitation.
In Møsvatn, the abundance of H. physodes increased over time. A significant time× altitude interaction reflected a greater abundance increase in the highest-lying plot in the last sampling period (Table 5; Fig. 5B). For M. olivacea, there was no general decrease in abundance over time; however, there was a significant time×altitude interaction, suggesting that there was a reduction in the abundance of this species in the highest-lying plots (Fig. 6B). However, the altitude gradient in this site was very short (Table 1).
In Gutulia, no significant effect of time or altitude on the abundance of H. physodes was found (Table 5; Fig. 5C). For M. olivacea, the abundance was significantly related to the altitudinal gradient, and a negative time× altitude interaction was significant, implying that abundance decreased more over time in the high-end of the altitudinal gradient (Fig. 6C).
In Åmotsdalen, there was a significant increase in H. physodes over time, but no relation between abundance and altitude (Fig. 5D). Abundance of M. olivacea was not significantly related to the altitudinal gradient, but a significant time×altitude interaction indicated a smaller abundance decline over time in the higher than in the lower plots (Fig. 6D).
In Dividalen, the most continental site, there was a strong altitudinal signature in the abundance of both species (Figs 5E & 6E). The abundance of H. physodes increased over time, but only in the lowest-lying plots. There was a significant decrease over time in the abundance of M. olivacea, but this decrease was found only in the lowest-lying plots (Fig. 6C).
Discussion
Natural spatial variation in lichen species cover may mask directional temporal changes (Insarov et al. Reference Insarov, Semenov and Insarova1999). Environmental variables that can affect lichen cover, such as climate and pollutants, are frequently highly correlated and make establishing causal relationships behind observed changes difficult (Nimis et al. Reference Nimis, Scheidegger and Wolseley2002). In Norway, wet deposition of N and S are far greater than dry deposition (Aas et al. Reference Aas, Hjellbrekke, Hole and Tørseth2008), implying higher deposition in regions with more precipitation and thus further complicating the interpretation of observed patterns.
We found regional differences in community change over time, linked in particular to S deposition. Effects of a change in pollution loads may depend on initial pollution levels (Seaward Reference Seaward2004). Our results showing the largest changes at the site with highest loads of pollution should probably be interpreted in the light of the large reduction in S deposition during the study period, and not just as an effect of high S levels. This reduction would increase lichen abundance in general and particularly benefit the Bryoria species, which are very sensitive to SO2 (Søchting Reference Søchting1999). In contrast, we observed the smallest change over time in lichen communities in the most northern and continental of the study areas, with the lowest precipitation and lowest pollution load.
Regional variation in species composition was mainly related to humidity (Full-DCA axis 1). Large variation in species composition was also found along Full-DCA 2; however, this variation could not be related to any of the explanatory variables recorded. Variation in species composition tended to be larger along Full-DCA 2 in the humid sites, which are often characterized by high lichen cover (Hauck Reference Hauck2011) and also had higher species richness than the dry, continental sites (Appendix 2).
Tree age affects community composition and species richness of epiphytes (Johansson et al. Reference Johansson, Rydin and Thor2007), and species composition frequently changes as succession proceeds (Ellis & Coppins Reference Ellis and Coppins2006). Tree age was not measured directly in this study, but may contribute to explaining the increase observed in cover of lichens in general and of taxa such as H. physodes and Bryoria spp. However, tree size (DBH) was not related to observed patterns of abundance change. This could be because birch trees commonly have flaking bark, which may counteract the effects of tree ageing by continually providing newly available substratum. Including several new trees during the study period also made it more difficult to assess the relative importance of tree ageing within our study's design.
The climate data indicate a considerable increase in both mean annual temperature and the length of the growing season (growing degree days; Table 1) in all sites during the study period, with mean annual temperatures being 1·3-1·7°C higher during the last sampling period compared to the 30-yr period preceding the study. Nevertheless, temperature variables were not included in any of the most parsimonious statistical models of change in lichen cover or of single species. Instead, we found that the increase in H. physodes was highest in high-precipitation areas, with an additional positive effect of N deposition. The abundance increase of H. physodes observed in this study is not strictly linked to an increased amount of precipitation. Our findings could suggest that this species may benefit from a warmer climate, provided that the conditions are humid enough, a finding that is in agreement with other European studies (van Herk et al. Reference van Herk, Aptroot and van Dobben2002; Aptroot & van Herk Reference Aptroot and van Herk2007). Studies of vascular plants show that responses to warming vary with time, location and moisture regime (Arft et al. Reference Arft, Walker, Gurevitch, Alatalo, Bret-Harte, Dale, Diemer, Gugerli, Henry and Jones1999; Walker et al. Reference Walker, Wahren, Hollister, Henry, Ahlquist, Alatalo, Bret-Harte, Calef, Callaghan and Carroll2006). Our results suggest that the largest change in subalpine epiphytic communities can be anticipated in moist sites.
Species predicted to be winners in a human-influenced world are widespread generalists with high fecundity and high dispersal capacity (McKinney & Lockwood Reference McKinney and Lockwood1999), whereas rare specialists with low fecundity and slow dispersal are predicted to be losers. Hypogymnia physodes possesses several of the traits characterizing ‘winner’ species; it is a generalist species in terms of substratum type (Kuusinen Reference Kuusinen1996), it is widespread (Ahti Reference Ahti and Seaward1977) and has a high diaspore production and effective dispersal (Hilmo et al. Reference Hilmo, Holien, Hytteborn and Ely-Aalstrup2009). In line with our predictions, we find a general abundance increase of this generalist species and an abundance decline of the specialist Melanelia olivacea over the 15-yr period. As there was a negative relationship between the abundance of H. physodes and M. olivacea at the start of the study (Fig. 5), it is not surprising that the same explanatory variables affected change in the abundance of both species. However, whether the observed decline of M. olivacea is due to competitive interactions following increased growth of H. physodes, or to changes in abiotic factors (i.e. that change in temperature or precipitation regimes, or N deposition, makes the habitat more unsuitable for M. olivacea), or the relative importance of these factors, remains to be tested. Changes in the duration and depth of the snow cover in winter could also have influenced the abundance of M. olivacea (Sonesson et al. Reference Sonesson, Osborne and Sandberg1994).
In Arctic areas, the anticipated climate change is expected to have the largest effect in the warmest sites (Walker et al. Reference Walker, Wahren, Hollister, Henry, Ahlquist, Alatalo, Bret-Harte, Calef, Callaghan and Carroll2006; Elmendorf et al. Reference Elmendorf, Henry, Hollister, Björk, Bjorkman, Callaghan, Siegwart Collier, Cooper, Cornelissen and Day2012), and in alpine sites, shrub expansion occurs predominantly at lower altitudes (Cannone et al. Reference Cannone, Sgorbati and Guglielmin2007). Consequently, the largest change in epiphyte communities within sites could be predicted to occur in the low-lying end of altitudinal gradients, reflecting mainly local gradients in temperature (Körner Reference Körner2003). Our results only partly supported this prediction; a parallel abundance increase of H. physodes and decrease of M. olivacea in just the low-altitude plots was found only in Dividalen, the most northern and continental site which also had the largest range in altitude. In the other sites, the effect of altitude seemed to vary. Altitude is an indirect measure of local climatic conditions, and may not capture all relevant differences in temperature, wind or snow cover. Furthermore, due to variations in topography, the range of the local altitudinal gradient varied greatly between sites, illustrating some of the difficulties involved when standardizing local variation between study sites.
Conclusions
We found that changes over a 15-year time period in the species composition and cover of dominant species of epiphytic lichen communities were related to pollution and climatic factors. A general increase in lichen cover over time was observed, and the increase in cover and change in species composition was larger in sites with high initial S deposition. Both precipitation and N deposition seem to favour the generalist species H. physodes, which has increased in abundance over the last 15 years in parallel with a decline of the subalpine birch forest species M. olivacea. The rate of change varied regionally, with the largest abundance increase of H. physodes at sites receiving high precipitation and high loads of N deposition. Coupled with an increase in mean annual temperature, our study suggests that a warmer, humid climate is beneficial for this generalist species.
The Monitoring Programme for Terrestrial Ecosystems (TOV) is financed by the Norwegian Directorate for Nature Management. We wish to thank Håkon Holien for help with species determination and all the people involved in fieldwork and data collection. Heidi Myklebost and Bodil Wilmann organized the data from NINA's database. Two anonymous referees and Associate Editor Susan Will-Wolf contributed valuable comments on an earlier version of this manuscript, and Erik Stange helped improve the language.

