


Introduction
Urban and industrial development impact the landscape, constituting a major challenge to biodiversity conservation (Kowarik Reference Kowarik2011). Areas housing industrial sites have a different land-use history, which may locally have given rise to ‘novel ecosystems’ (Hobbs Reference Hobbs, Arico, Aronson, Baron, Bridgewater and Cramer2006, Reference Hobbs, Higgs and Hall2013). Urban and industrial areas are potential reservoirs of biodiversity (Kowarik Reference Kowarik2011). Numerous species, including rare species, are able to colonize these urban–industrial sites just as they would in natural conditions (Eversham et al. Reference Eversham, Roy and Telfer1996).
One of the major goals of ecosystem management is to maintain native populations and functions by removing species, disturbances and conditions that lead to degradation (Grumbine Reference Grumbine1997). The fact that novel ecosystems, depending on how unique they are, may require the development of new innovative management approaches is a topical issue (Hobbs Reference Hobbs, Higgs and Hall2013). Good examples are the many novel ecosystems found along European river valleys heavily modified by human activities such as the construction of dams and dykes (Jensen et al. Reference Jensen, Trepel, Merritt and Rosenthal2006) since the nineteenth century. Yet conservation of river valleys also needs to focus on the protection or management of the new species-rich habitats created by the construction of artificial dykes and embankments, rather than only on the conservation of relict pieces of ecosystems from the past (Van Diggelen et al. Reference Van Diggelen, Middleton, Bakker, Grootjans and Wassen2006).
Conventional ways of managing biodiversity, such as grazing or mowing, can be efficient tools for these novel ecosystems, as already demonstrated for other semi-natural ecosystems (Carboni et al. Reference Carboni, Dengler, Mantilla-Contreras, Venn and Török2015). Since the 1970s, the challenge for many of these grasslands has been to institute management practices that will keep them open (Wallis De Vries et al. Reference Wallis De Vries, Parkinson, Dulphy, Sayer and Diana2007).
Grazing has been widely promoted as a form of management that can reduce the dominance of some species (Firn et al. Reference Firn, House and Buckley2010), mitigating the effects of increased soil nutrient levels (Weiss Reference Weiss1999). Its extensive use (van Wieren & Bakker Reference Van Wieren and Bakker1998, Marriot et al. Reference Marriot, Hood, Fischer and Pakeman2009) can be attributed to its traditional nature, a form of agricultural management that enhances alpha-diversity by promoting species coexistence (Barradas & Cohen Reference Barradas and Cohen1994) and beta- and gamma-diversity by generating mosaics of habitats (Rosenthal et al. Reference Rosenthal, Schrautzer and Eichberg2012).
While mowing and grazing are sometimes used together for conservation purposes (Collins et al. Reference Collins, Knapp, Briggs, Blair and Steinauer1998, Poschlod & Wallis De Vries Reference Poschlod and Wallis De Vries2002), for the majority of ecosystems, grazing is considered more likely to meet conservation objectives (Tälle et al. Reference Tälle2018). Nevertheless, some grassland ecosystems are exclusively mown (Middleton et al. Reference Middleton, Holsten and van Diggelen2006). This is not only for practical reasons, but also because mowing can sometimes be more efficient in maintaining biodiversity than grazing, depending on the grassland’s traditional management history (Stammel et al. 2003). Yet few studies have aimed to compare the two methods of grassland management, and those findings available on their respective advantages are contradictory. A recent review considering 35 studies confirmed that grazing generally has a more positive impact than mowing from a conservation perspective, depending on grassland type (Tälle et al. Reference Tälle, Deák, Poschlod, Valkó, Westerberg and Milberg2016).
Grazing as a conservation management system has been found to be more relevant after the abandonment of traditional grazing systems than mowing (Tälle et al. Reference Tälle, Deák, Poschlod, Valkó, Westerberg and Milberg2016). The regular removal of biomass by grazing might partially explain the advantage of grazing in rich or fertilized grasslands, ensuring continuous exportation during the grazing season of mineral elements, as well as indirectly providing continuous control of competition (Hautier et al. Reference Hautier, Niklaus and Hector2009). Grazing also promotes greater species richness by creating bare patches due to trampling, by exerting varying degrees of grazing pressure on micro-sites and by dispersing seeds (Cousens et al. Reference Cousens, Dytham and Law2008). Grazers, in particular horses and sheep, are highly selective due to their higher herbage intake (Duncan Reference Duncan1992), whereas mowing has a more uniform effect, which could explain the greater evenness often observed after mowing than after grazing (Tälle et al. Reference Tälle, Deák, Poschlod, Valkó, Westerberg and Milberg2016). However, stocking density and grazing regime are two major factors that, by controlling competition and vegetation cover, directly or indirectly drive richness and evenness (Rosenthal et al. Reference Rosenthal, Schrautzer and Eichberg2012). Tälle et al. (Reference Tälle, Deák, Poschlod, Valkó, Westerberg and Milberg2016) concluded that, in many cases, grazing is more beneficial in terms of biodiversity, but that the difference is small.
While numerous studies have examined how grazing or mowing can enhance the conservation value of natural and semi-natural habitats (Rosenthal et al. Reference Rosenthal, Schrautzer and Eichberg2012, Tälle et al. Reference Tälle, Deák, Poschlod, Valkó, Westerberg and Milberg2016), few have investigated the relevance of these management tools on recently developed ecosystems in an artificial context where the vegetation structure is managed primarily to meet strict safety criteria. Moreover, we wanted to test recent tools such as the vegetation index obtained from remote sensing because these are increasingly being used for conservation purposes and to complement field methods (Pettorelli et al. Reference Pettorelli, Ryan, Mueller, Bunnefeld, Bogumiła, Lima and Kausrud2011) through their application at broader scales than botanical inventories conducted on permanent plots. In this three-year study (2014–2016), we therefore examined the respective impacts of a low-intensity cattle grazing regime and a 1 cut year–1 mowing regime on the spontaneous herbaceous vegetation of artificial dykes located in the Lower Rhône valley (south-eastern France), in the industrial area of the Tricastin nuclear power station. We addressed possible year effects during the three-year survey in order to separate long-term effects of treatments from inter-annual variation due to potential changes of climatic conditions between years and their likely impacts on vegetation even if the number of cattle was conserved throughout the survey period. We also addressed the potential impacts of abiotic soil characteristics that could also explain differences between recently managed sites (1999 and 2012) and the control site that had not been managed since 1954.
We addressed the following questions: (1) How do low-stocking density grazing and 1 cut year–1 mowing modify the species richness (alpha-diversity), evenness and heterogeneity (beta-diversity) of the herbaceous plant communities of dykes compared to the absence of management? (2) Do abiotic factors such as soil characteristics help explain differences between the managed and control sites? (3) Is the Normalized Difference Vegetation Index (NDVI) a good estimator of biomass, is it indirectly related to species richness obtained from field methods and could it be used by conservation managers at the scale of the sites?
Methods
Study Site
The site (N 44°18’13.3” E 4°44’32.9”) consists of the artificial dykes of the dam and the hydro-electric power station of Donzère-Mondragon, located 180 km south of Lyon and 55 km north of Avignon in the lower course of the Rhône (Fig. 1). The local climate is Mediterranean, with two main peaks of rainfall (yearly mean: 500–700 mm), one in autumn and a lesser one in spring.
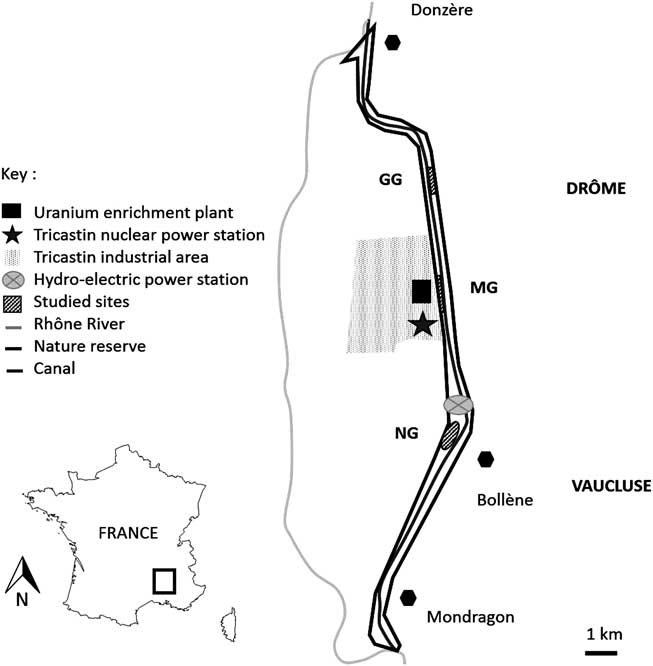
Fig. 1 Location of study site of Donzère-Mondragon in south-eastern France in the lower Rhône valley. Locations of study plots (striped black): grazed grassland (GG), mown grassland (MG) and non-grazed, non-mown grassland (NG), reserve limits (black), hydro-electric power station (light grey dot), canal (dark grey), and Rhône River (light grey).
Over the last 30 years, the mean annual temperature has been 14°C with a total rainfall of 700.9 mm year–1. We recorded only minor divergences from this during the three study years (2014–2016): mean annual temperature varied from 14.7 to 14.9°C and total annual rainfall varied from 620 to 696 mm (Table 1).
Table 1 Mean temperature (°C) and total rainfall (mm) at the study site during 2013–2014, 2014–2015, 2015–2016, over the last 30 years and during the spring seasons of 2014, 2015 and 2016

The floodway of Donzère-Mondragon was built between 1948 and 1952 and has been managed ever since by the Compagnie Nationale du Rhône (CNR). The dykes studied were built with millions of tonnes of alluvial sediments extracted from digging the canal in the alluvial plain of Tricastin (Fig. 1).
In 1954, a nature reserve covering a band 28 km long (1500 ha) was created along the dyke to favour game species and to enhance habitat diversity for flora and fauna (Roux et al. Reference Roux, Roux and Debiesse2007). Between 1974 and 1981, a nuclear complex was developed on the right bank of the floodway (Fig. 1); its area is 600 ha and it is subject to some of the most stringent security constraints in France (Supplementary Appendix S1, available online).
In 2014, we selected three sites where three different types of management were applied: cattle grazing (GG); mechanical mowing (MG); and no domestic grazing or mowing (NG) (Fig. 1). Before 1999, no conservation management treatment was applied in the sites. As a consequence, all of these sites were covered by herbaceous plant communities dominated by a tussock grass (Brachypodium phoenicoides); shrubs (Crataegus monogyna, Rubus spp., etc.) have also naturally partially colonized these areas (Moinardeau et al. Reference Moinardeau, Mesléard and Dutoit2016).
The grazed grassland (GG) consists of 130 ha on the dykes of the supply channel and surrounded by electric fences. Management there began in 1999 with a herd of Galloway cattle (105 cows, 30 bulls and 40 calves) present from mid-November to mid-July (Fig. 1), which corresponds to a very low stocking rate of 0.50 livestock units (LU; 1 LU=600 kg ha–1 year–1). Some ornamental trees were planted following the dyke construction (Roux et al. Reference Roux, Roux and Debiesse2007).
The mown grassland (MG) consists of 4 ha situated on the same dyke as GG. It initially experienced the same grazing management, which was replaced by annual summer (August) mechanical mowing in 2012 because the immediate proximity of the nuclear complex suggested that mowing was a safer option (Fig. 1). After mowing, the herbaceous biomass remained in place on the site.
The control with no management (NG) was 1 ha and was also situated on the same dyke as GG and MG and had not been grazed or mown since 1954 (Fig. 1).
Vegetation Monitoring
We monitored herbaceous plants using 4-m2 quadrats, whose size was determined by calculation of minimum areas for each species, and we measured abundance and cover using Braun–Blanquet coefficients (Guinochet Reference Guinochet1973). We also recorded vegetation height (cm), total vegetation cover (%) and bare soil cover (%) of the quadrats. Plant nomenclature follows Tison et al. (Reference Tison, Jauzein and Michaud2014).
We sampled the mown grassland (MG), an area of grassland grazed by cattle (GG) and the control without any management (NG). The quadrats were all more than 10 m apart; because the control area was too small, there were only five control quadrats.
We estimated alpha-diversity from the mean species richness per quadrat and beta-diversity by calculating the Bray–Curtis distance (Bray & Curtis Reference Bray and Curtis1957) between the quadrats in each treatment and the mean Bray–Curtis distance between treatments. We also calculated the evenness indices (Pielou Reference Pielou1969). Botanical inventories were carried out in 2014, 2015 and 2016 during the May–June period, the peak of vegetation production.
Soil Analyses
Particle size, organic matter content and nutrient concentration were assessed. Percentages of clay (<2 µm), silt (2–50 µm) and sand (50–2000 µm) were determined according to the Robinson method (Baize Reference Baize2000). The soil pH and exchangeable Ca, K and P2O5 were measured using the methods of Thomas (Reference Thomas1996), Metson (Reference Metson1956) and Olsen et al. (Reference Olsen, Cole, Watanabe and Dean1954). Organic C (Allison Reference Allison1965) and total N contents (Bremner Reference Bremner1996) were quantified using a CHN elemental analyser (ISO 10694). For each treatment, five 200-g soil samples were extracted at a depth of 0–10 cm in spring 2014. Soil samples were collected near each pair of the ten quadrats in the grazing and mowing treatments and near each of the five quadrats in the control.
Analyses were performed by the soil analysis laboratory at Institut National de la Recherche Agronomique in Arras (France).
Aerial Photographic Analysis
Multispectral photographs (red, green, blue and near-infrared) were taken by overflight of the reserve at 1050 m. We chose a high resolution (10 cm) to limit impact from spatial heterogeneity on assessment of landscape variation (Garrigues Reference Garrigues2004). Aerial surveys were realized during the second halves of May in 2014, 2015 and 2016. Images were orthorectified with hundreds of field reference points calibrated using centimetre-accurate differential GPS. The NDVI (Tucker Reference Tucker1979) was calculated with ArcGIS 10.2 (ESRI 2004); it reflects the vigour and density of vegetation (Purevdorj et al. Reference Purevdorj, Tateishi, Ishiyama and Honda1998). The NDVI can be linked to vegetation biomass (Mafhoud Reference Mafhoud2009), especially in grazed sites probably containing photosynthetically active vegetation.
Dry herbaceous aboveground biomass weight was measured in May 2016 immediately after the aerial survey. Vegetation was clipped on 50 quadrats per site (50×50 cm), oven dried at 50°C and weighed. The geographical coordinates of all the biomass quadrats were measured with the centimetre-accurate GPS (Trimble Geographic Positioning System receiver). The NDVIs of the biomass quadrats were extracted with a geographic information system (GIS). To be relevant biomass estimators, spectral indices must be able to differentiate vegetation from soil (Todd et al. Reference Todd, Hoffer and Milchunas1998). On a second occasion, all the field points (geographical coordinates of the permanent plots) were referenced with centimetre-accurate GPS in order to compare field reality (species richness measured by botanical inventories in permanent quadrats) and the NDVI extracted from aerial photograph data. To extend our results to the site scale, the evenness of distribution of NDVI values between the two management techniques was tested.
Statistical Analyses
Vegetation composition was compared between treatments using non-metric multidimensional scaling (NMDS) based on Bray–Curtis similarity (Borcard et al. Reference Borcard, Gillet and Legendre2011).
We ranked soil characteristics using principal component analysis (PCA) (Borcard et al. Reference Borcard, Gillet and Legendre2011). We compared effects of the different treatments on soil physicochemical parameters, soil particle sizes and nutrient contents via univariate analyses.
To compare soil particle size, nutrient content and vegetation parameters, we used analysis of variance tests for multiple comparisons when the data were normally distributed (Shapiro–Wilk test) and when homogeneity of variances was respected (Bartlett test). This analysis was followed by post-hoc Tukey tests when a significant difference was detected among treatments. When data were not normal, we used Kruskal–Wallis tests for multiple comparisons, followed by pairwise Mann–Whitney–Wilcoxon tests, with the value of p adjusted according to Benjamini and Hochberg (Reference Benjamini and Hochberg1995). Separate analyses of years were done to separate long-term effects of treatments (done 10–12 years ago for the GG and 3–5 years ago for the MG) from inter-annual variation due to changes of climatic conditions between years in the Mediterranean area (Caldeira et al. Reference Caldeira, Hector, Loreau and Pereira2005). This climatic inter-annual variability will influence plant productivity and then grazing impacts on vegetation, although the herd of cattle has conserved the same number of animals during the survey.
To ensure that the NDVI was a good estimator at the overall scale of the managed sites, Spearman rank correlation tests were performed between NDVI values and herbaceous biomass weight values of each plot. Spearman rank correlations between NDVI and species richness obtained through the vegetation survey were realized for each plot. Correlations were then represented by linear regression. Evenness of distribution of NDVI values between grazed and mown plots was also calculated using an evenness formula at the scale of each site.
All statistical analyses were performed with R software version 2.15.3 (R Core Team 2012).
Results
Plant Community Diversity and Structure
In total, 179 plant species were recorded (Supplementary Table S1). The most common species were B. phoenicoides, Dactylis glomerata and Catapodium rigidum, which were found in more than 90% of the 75 quadrats inventoried during the 2014–2016 period. Thirty species were recorded in only one quadrat. Only one species is protected at the European community level under a European regulation (CE No. 338/97): Himantoglossum robertianum.
The NMDS analysis (stress=0.13) of the vegetation data discriminated three different herbaceous communities. The grassland grazed by cattle (GG) was dominated by short, annual plant species such as Galium parisiense and Alyssum alyssoides (Fig. 2). The mown grassland (MG) contained more perennial species such as D. glomerata and Carlina hispanica, along with short annuals such as Euphorbia exigua and Lysimachia linum-stellatum. The control (NG) was essentially dominated by tall perennial species such as B. phoenicoides.
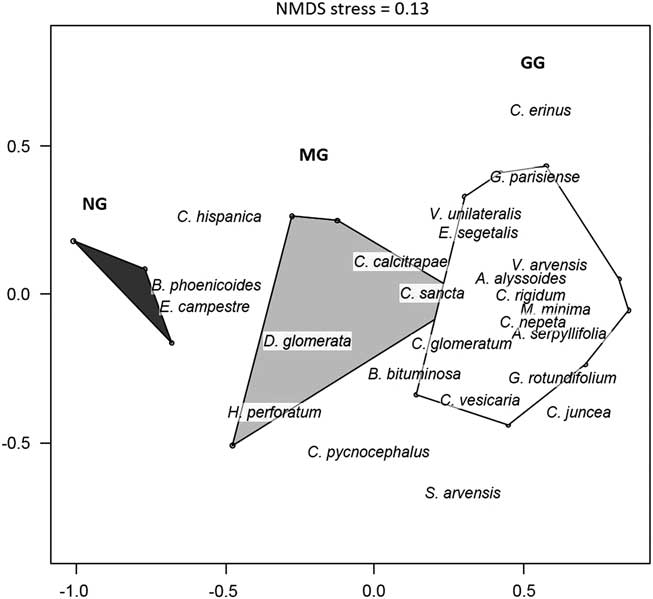
Fig. 2 Non-metric multidimensional scaling (NMDS) ordination (NMDS stress=0.13) based on 25 vegetation quadrat samples – ten in the grazed grassland (GG), ten in the mown grassland (MG) and five in the control without management (NG) – realized in May 2016 in dykes of the canal of Donzère-Mondragon in the Lower Rhône valley, south-eastern France. Polygons represent treatments; only the plant species most correlated to the two first axes are indicated (p=0.01 for both axes).
Some parameters had the same trends in 2014 as in 2015. The annual species frequency was higher for the mown treatment than for control (Table 2). Mean vegetation height was higher in control plots than MG and GG plots. Evenness was lower in control than in MG plots. Grazing had a significant impact on the dominant tussock perennial grass B. phoenicoides cover. Vegetation cover was higher in the MG treatment and control than in the GG treatment. In 2014, no significant difference was measured for species richness, whereas in 2015, species richness was higher in the MG and GG treatments than in the control.
Table 2 Results of vegetation analyses in the cattle grazed grassland (GG), mown grassland (MG) and control (NG) on dykes of the Donzère-Mondragon canal in the Lower Rhône valley during 2014–2016. Two values in the same row with a different letter are significantly different (Tukey post-hoc or Mann–Whitney–Wilcoxon tests). *p<0.05, **p<0.01, ***p<0.001

Between 2014 and 2016, grazing had a higher impact on bare soil percentage than mowing or absence of management, whereas no difference was found between mowing and absence of management.
Significant differences in Bray–Curtis indices among the three treatments from 2014 to 2016 indicated a greater heterogeneity of vegetation in the GG treatment than in the MG treatment and the control. The Bray–Curtis index was also higher for the MG treatment than for control (Table 2).
In 2016, evenness was greater in the GG treatment than in the MG treatment, which was also greater than in the control. Species richness was higher in the MG and GG treatments than in control (Table 2). In 2016, vegetation cover and mean vegetation height were significantly lower in the GG and MG treatments than in control (Table 2). No significant difference was found between the GG and MG plots in annual species frequency (Table 2). Grazing also had a significant impact on the dominant tussock perennial grass B. phoenicoides cover, which was significantly lower in the GG.
Soil Characteristics
Axis 1 of the PCA (50.99%) opposed the managed sites, the MG and the GG treatments, to the control (NG) (Fig. 3). On this axis, mown and grazed grasslands were correlated with higher coarse sand and organic matter contents (C and N). Axis 2 (25.60%) expressed some heterogeneity of coarse sand content in the soil of the GG treatment.

Fig. 3 Principal component analysis ordination based on the 15 soil samples analysed in the cattle-grazed grassland (GG, open), mown grassland (MG, light grey) and control grassland (NG, dark grey) along the Donzère-Mondragon canal in the Lower Rhône valley. Arrows represent soil variables: chemical content (K, P, CaCO3, pH, organic C, total N, C/N, Metson cation exchange capacity (CEC)) and particle sizes (clay (<0.002 mm), fine silt (0.002–0.020 mm), coarse silt (0.2–2.0 mm), fine sand (0.05–0.20 mm) and coarse sand (0.2–2.0 mm)).
The univariate analyses showed the MG samples had significantly lower fine silt, CaCO3 and P2O5 contents than the control. pH was more basic in control than in the two managed treatments. Coarse sand content was significantly higher in the GG and MG treatments than in control. MG samples had significantly more clay and coarse silt contents than GG treatments. No significant difference in clay content was detected between the MG treatment and control plots. The control had a significantly higher fine silt content than the two other treatments. No significant differences were found for the other soil parameters among the three treatments (Supplementary Table S2).
Vegetation Indices
There was a significant linear regression between biomass and the NDVI values for both treatments (Supplementary Fig. S1). The correlation was greater for the MG treatment (rho=0.74, p<0.001) than for the GG treatment (rho=0.58, p<0.01), but the statistical significance was greater for the latter.
The NDVI and plant species richness were also negatively correlated for the grazed treatment between 2014 and 2016 (p<0.05). In 2014, this coefficient was medium (rho=–0.37), but was higher in 2015 and 2016 (rho=–0.5 and –0.58, respectively; p<0.05) (Supplementary Fig. S2).
The different NDVI values for treatments GG and MG showed greater evenness of distribution for the grazing treatment (0.35±0.01) than for the mowing treatment (0.30±0.01; t=–3.42, df=3.98, p<0.05) (Supplementary Fig. S3). This trend was also observed from maps (Supplementary Appendix S2) representing NDVI values ranked in ten classes each for GG and MG treatment and for each study year. Classes 1–5 showed the lowest NDVI values and classes 6–10 showed the highest NDVI values.
Discussion
Impacts of the Different Conservation Management Treatments
After three years of monitoring, cattle grazing at a low stocking density appeared to be a more effective way to enhance plant community diversity than mowing at a rate of 1 cut year–1 or the absence of domestic grazing. Grazing lowered vegetation cover and height and the competitive ability of perennial grasses (Stephens & Krebs Reference Stephens and Krebs1986), here B. phoenicoides. It increased the proportion of bare soil, favouring the establishment of low-competitive species, mainly short, annual species (Hayes & Holl Reference Hayes and Holl2003). Evenness was significantly higher in the grazed treatment in 2016. This result is in accordance with results already obtained from previous studies that also reported an increase of evenness after re-establishment of low-density grazing in grasslands with a homogeneous vegetation structure, due to the dominance of perennial tussock grasses (Tälle et al. Reference Tälle, Deák, Poschlod, Valkó, Westerberg and Milberg2016). Some annual species are recorded as rare or very rare species of the Vaucluse département (Girerd Reference Girerd1991), such as Alyssum simplex or Anisantha lanceolatus.
Cattle grazing increased the heterogeneity of plant communities more than mowing, as revealed by Bray–Curtis indices. This may be the result of the Galloway cow trampling: these heavy herbivores could induce erosion of the finest particles at the soil surface (Mulholland & Fullen Reference Mulholland and Fullen1991). The absence of domestic grazing leads to a lower heterogeneity of plant communities and to the development of tall, perennial tussock grasses, especially B. phoenicoides, which covered at least 75% of the soil over the 2014–2016 period. No statistical difference was found in organic matter among the three treatments. The highest organic matter content may occur in ungrazed soil, which can be attributed to the accumulation of biomass and litter that are usually removed by herbivores in grazed grasslands (Sigcha et al. 2018) and in mown grasslands when hay is removed. In our case, the hay was left behind.
The NDVI was a good estimator of aboveground herbaceous biomass for the two managed sites here (Jensen Reference Jensen and Hardin2007). Yet we found significant correlations between vegetation index values and plant species richness of quadrats from the grazing treatment. The high resolution of our aerial photographs (10 cm) therefore allowed us to clearly link the results of field studies with remote sensing data. Results from aerial photographs and vegetation surveys followed the same trend: the higher and denser the vegetation patch, the lower the species richness. Thus, generalizing these results to the entire grazed site allows us to make site-scale recommendations for conservation management.
Implications for the Restoration and Management of Dyke Vegetation
Over a short time period (2014–2016), the low stocking density not only led to greater structural heterogeneity of short grasslands than without domestic grazing, but also to higher species richness and evenness than with mowing. The proportion of rare short, annual species increased after the implementation of low-density grazing. Nonetheless, the low-density cattle grazing initiated in 1999, and considered unsuitable for safety reasons, was replaced by mowing at the rate of 1 cut year–1 in 2012. Our results demonstrate that replacing grazing by mechanical mowing was not the best choice in terms of nature conservation, leading to a significant decrease in beta-diversity and poorer control of B. phoenicoides.
Several studies emphasized the relevance of satellite data in ecological studies (Turner et al. Reference Turner, Spector, Gardiner, Fladeland, Sterling and Steininger2003) and the advantages of the complementary use of remote sensing, aerial photographs and traditional methods to monitor vegetation, whether for agronomic or conservation purposes (Flynn Reference Flynn2006). Joint use of aerial photographs and of the NDVI appears particularly relevant for analysing the impacts of management at the site scale (Pettorelli et al. Reference Pettorelli, Vik, Mysterud, Gaillard, Tucker and Stenseth2005a). Here, cattle grazing was shown to be the best option for conservation, leading to the lowest NDVI values (lower biomass, lower density and leaf cover) and thus to higher species richness.
Our study adds to the evidence of how extensive grazing can help manage biodiversity on semi-natural and non-agricultural land (e.g. van Wieren & Bakker Reference Van Wieren and Bakker1998, Carboni et al. Reference Carboni, Dengler, Mantilla-Contreras, Venn and Török2015). Nevertheless, the success of grazing management will depend on the grazing pressure and period of application chosen. It will also depend on how well the person in charge of the herd applies the prescribed management. This may in turn be affected by technical and socioeconomic conditions, in addition to purely environmental or agronomic issues. At the dyke of Donzère-Mondragon, the same breeder has owned the herd since 1999 under a multi-year contract guaranteeing him a sustainable and durable livelihood and optimal conditions to manage his flock.
Financial Support
We are grateful to the Compagnie Nationale du Rhône (CNR), the owner of the site and the Office National de la Chasse et de la Faune Sauvage (ONCFS), the site manager, for their financial support. We also thank SFR Tersys for the grant awarded in 2014.
Conflict of Interest
None.
Ethical Standards
None.
Supplementary Material
For supplementary material accompanying this paper, visit www.cambridge.org/core/journals/environmental-conservation
Acknowledgements
Our thanks to Romain Brusson (CNR) and to Denis Roux (ONCFS) for facilitating access to the sites. We gratefully acknowledge the technical assistance with botanical inventories and grazing surveys received from Daniel Pavon, Loïc Willm, Alain Sandoz, Julie Chenot, Anne Aurière, Christel Vidaller, Arthur Rocher, Bénédicte Beylier, Laurent Garde, Bruna Romanini and Jean-Noël Laffite. We thank Marjorie Sweetko for English language revision. Finally, we thank the two anonymous reviewers for their useful comments.


