


Introduction
Phosphorus (P) is one of the most limiting nutrients for agricultural production in the tropics, partially because it has low natural availability in tropical soils (Pavinato et al., Reference Pavinato, Cherubin, Soltangheisi, Rocha, Chadwick and Jones2020). It is generally assumed that P use efficiency (PUE, i.e., the percentage of P from fertilizer that the plant actually absorbs) in agriculture is less than 20% (Johnston et al., Reference Johnston, Poulton, Fixen, Curtin and Sparks2014). Additionally, with P fertilization, there is a build-up of non-labile P forms in the soil, known as ‘legacy P’ which can reach up to 106 Tg by 2050 if the current rate of P application continues in Brazil (Pavinato et al., Reference Pavinato, Cherubin, Soltangheisi, Rocha, Chadwick and Jones2020). Also, P is a finite resource held by only a few countries (Cooper et al., Reference Cooper, Lombardi, Boardman and Carliell-Marquet2011). Therefore, it is necessary to implement agricultural practices that enhance the use of legacy P and PUE to promote more sustainable agriculture in Brazil (Pavinato et al., Reference Pavinato, Cherubin, Soltangheisi, Rocha, Chadwick and Jones2020).
Cover crops used in rotation or intercropped with cash crops are a strategy to increase P mobilization, its cycling, and its PUE (Baptistella et al., Reference Baptistella, de Andrade, Favarin and Mazzafera2020; Pavinato et al., Reference Pavinato, Cherubin, Soltangheisi, Rocha, Chadwick and Jones2020). Cover crops are crops planted for soil protection and improvement of the production system without the primary objective of being harvested (Soil Science Society of America, 2008). Urochloa spp. [syn (Brachiaria spp.)] is commonly used as a cover crop and pasture in the tropics and subtropics. In Brazil, Urochloa has been successfully intercropped with annual and perennial crops, promoting several benefits to the agroecosystems, such as greater soil cover protection, carbon sequestration, and nutrient cycling (Baptistella et al., Reference Baptistella, de Andrade, Favarin and Mazzafera2020).
Urochloa is adapted to low P availability and has developed mechanisms to improve P solubilization and uptake (Baptistella et al., Reference Baptistella, Llerena, Domingues-Júnior, Fernie, Favarin and Mazzafera2021). Examples of these mechanisms are root exudation of organic acids and acid phosphatase enzymes, symbiotic association with mycorrhizal fungi, and enhanced root growth for better exploring the soil (Louw-Gaume et al. Reference Louw-Gaume, Rao, Gaume and Frossard2010, Reference Louw-Gaume, Schweizer, Rao, Gaume and Frossard2017; Teutscherova et al., Reference Teutscherova, Vazquez, Arevalo, Pulleman, Rao and Arango2019). Urochloa cultivation increases acid phosphatase activity in soils (Rosolem et al., Reference Rosolem, Merlin and Bull2014) and reduces soil P adsorption capacity (Janegitz et al., Reference Janegitz, Inoue and Rosolem2013). Also, under Urochloa cultivation, increases in labile and moderately labile P fractions and reduction in non-labile P forms in the long term were observed (Almeida and Rosolem, Reference Almeida and Rosolem2016). Moreover, Urochloa species have differential responses to low P availability, which may account for the differences in P uptake and adaptability to low P availability (Baptistella et al., Reference Baptistella, Llerena, Domingues-Júnior, Fernie, Favarin and Mazzafera2021): U. brizantha and U. ruziziensis have higher exudation of root metabolites when compared to U. decumbens. U. ruziziensis shows higher relative expression of root P transporters (PHT1 gene family) than U. decumbens and U. brizantha (Baptistella et al., Reference Baptistella, Llerena, Domingues-Júnior, Fernie, Favarin and Mazzafera2021). Along with these mechanisms, the high biomass production and the deep and vigorous root system make Urochloa an interesting option for increasing PUE in the Brazilian agroecosystems (Baptistella et al., Reference Baptistella, de Andrade, Favarin and Mazzafera2020).
Biological, chemical, and physical factors control phosphorous cycling and involve the movement of P from soil to plant and back again to the soil by decomposition and mineralization processes (Liu and Chen, Reference Liu, Chen and Fath2014). P cycling is closely related to PUE and can be favored in agricultural systems that include cover crops, such as Urochloa (Baptistella et al., Reference Baptistella, de Andrade, Favarin and Mazzafera2020; Pavinato et al., Reference Pavinato, Cherubin, Soltangheisi, Rocha, Chadwick and Jones2020). As comprehensively covered by Baptistella et al. (Reference Baptistella, de Andrade, Favarin and Mazzafera2020), Urochloa can grow and absorb P through the year, cycling up to 45 kg of P ha-1 depending on the species and management system. Nevertheless, although the Urochloa root system can be deep and vigorous, it is yet unknown from which depth the accumulated nutrients were absorbed, as deeper roots could be catching nutrients inaccessible to other crops or lost in the soil profile (Baptistella et al., Reference Baptistella, de Andrade, Favarin and Mazzafera2020).
Brazil is the leading coffee producer in the world (USDA, 2020), with more than 2 million hectares occupied with this crop (CONAB, 2021). Brazilian coffee is mostly cultivated in bare soil with regular use of herbicides to control weeds (Favarin et al., Reference Favarin, Souza, Moscardini and Baptistella2018; Ragassi et al., Reference Ragassi, Pedrosa and Favarin2013). Recently, Brazilian arabica coffee (Coffea arabica L.) growers are adopting Urochloa as a cover crop in the interrows, and U. decumbens or U. ruziziensis have been the preferred species for this intercrop (Favarin et al., Reference Favarin, Souza, Moscardini and Baptistella2018). In this intercrop, Urochloa is mowed as it grows, and the residues are thrown to the coffee rows. Over time, the nutrients are released from the residues by mineralization, turning them available for the coffee plants. When compared to the conventional system, the increased adoption of this coffee-Urochloa system shows benefits such as higher soil moisture and water infiltration (Pedrosa, Reference Pedrosa2013), soil physical protection, enhanced nutrient cycling, reduced crop water stress, and a more resilient system to climate adversity (Ragassi et al., Reference Ragassi, Pedrosa and Favarin2013). Such benefits may enhance P diffusion and uptake. P cycling, which has been overlooked in this intercropping system, could supply most of the coffee demand for the nutrient.
Urochloa has deep and abundant roots and has mechanisms to mobilize and absorb P from non-readily available P fractions. Therefore, we tested the hypothesis that Urochloa decumbens can mobilize and absorb P from deep soil layers and increase overall P cycling. The objective of this study was to evaluate U. decumbens P mobilization and cycling capability from deep soil layers. First, we accessed root growth, root architecture, P mobilization, and uptake from deep layers in a greenhouse rhizotron experiment with sole U. decumbens to better understand how the plant developed in more controlled conditions; then, we installed a similar experiment to verify the results in field conditions in a U. decumbens – arabica coffee intercrop system.
Material and Methods
Rhizotron experiment
Experiment design, installation, and sampling
The rhizotron experiment was performed in a greenhouse at ‘Luiz de Queiroz’ College of Agriculture, in Piracicaba, São Paulo. Each rhizotron corresponded to an experimental plot. The rhizotrons had 2 m in height and 0.2 m in diameter, with a total volume of 62.8 dm3. We established four layers within each plot: 0.0 – 0.3; 0.3 – 0.8; 0.8 − 1.3; and 1.3 – 2.0 m. The experimental design was randomized blocks with 7 treatments (adequate P availability) and 4 plot replicates (rhizotrons), a total of 28 rhizotrons (7 x 4). Treatments consisted of adequate P availability (according to Werner et al., Reference Werner, Paulino, Cantarella, Andrade, Quaggio, Van, Cantarella, Quaggio and Furlani1997) in distinct layers of the soil profile within the rhizotrons, where U. decumbens plants were grown. Treatments were: 1 – adequate P availability from 0.0 to 0.3 m; 2 – adequate P availability from 0.0 to 0.8 m; 3 – adequate P availability from 0.0 to 1.3 m; 4 – adequate P availability from 0.0 to 2.0 m; 5 – adequate P availability from 1.3 to 2.0 m; 6 – adequate P availability from 0.8 to 2.0 m; and a control treatment with low P availability trough the profile (Figure 1a). We used soil (Ferralsol – Soil Survey Staff, 1999) with low P availability to fill the plots (Supplementary Material Table S1). For the layers fertilized with P, the amount of P applied was calculated to reach 15 mg dm-3 as recommended for adequate growth of U. decumbens (Werner et al. Reference Werner, Paulino, Cantarella, Andrade, Quaggio, Van, Cantarella, Quaggio and Furlani1997). To ensure adequate P supply to the treated rhizotron layers, we added triple superphosphate (45% P2O5) to the soil and mixed it in a concrete mixer. The rhizotrons were filled with the original soil and P-enriched soil, as shown in Figure 1a. A measurement tape was used to ensure that each layer had the proper depth. We included a 2-cm layer of washed fine sand to identify the transition between each layer. All the other nutrients were supplied at adequate levels for plant growth according to Werner et al. (Reference Werner, Paulino, Cantarella, Andrade, Quaggio, Van, Cantarella, Quaggio and Furlani1997): potassium (K) and sulfur (S) were supplied at 1.25 g plot-1 each at planting; and nitrogen was supplied at 2.5 g plot-1, split in two applications, one at planting and the other after the first shoot sampling (90 days after emergence).

Figure 1. Rhizotron experiment (a) and field experiment (b) schemes. (a) The gray color represents the soil layers where P availability for U. decumbens was adequate. Treatments description: 1 – adequate P availability from 0.0 to 0.3 m; 2 – adequate P availability from 0.0 to 0.8 m; 3 – adequate P availability from 0.0 to 1.3 m; 4 – adequate P availability from 0.0 to 2.0 m; 5 – adequate P availability from 1.3 to 2.0 m; 6 – adequate P availability from 0.8 to 2.0 m; and a control treatment with low P availability trough the profile. (b) Red arrows represent the depth of P application for each treatment.
Several U. decumbens seedlings were distributed on the top of the soil, and after germination, we maintained only three vigorous seedlings per rhizotron. Drip irrigation was installed to avoid water stress, with a humidity control of 60–80% of the water-holding capacity all over the cultivation time.
After 190 days, the rhizotrons were dismounted right after collecting the last shoot biomass. Then, the tubes were cut longitudinally in half with a power saw. Each layer could be identified because of the 2-cm sand layers, and they were separated using a camp knife (Supplementary Material Figure S1).
Assessments
Shoot, root, and soil samplings
Shoot samplings were made at 90 and 190 days after emergence. After drying at 65 ºC to obtain the shoot dry mass (SDM), the samples were ground and analyzed for shoot macro- and micronutrients concentration according to Malavolta et al. (Reference Malavolta, Vitti and Oliveira1997). Nutrient accumulation (in kg) was calculated by multiplying the total SDM by its nutrient content.
The roots were shaken to be separated from the soil. Next, roots from each layer were cleansed with running water, and a subsample (corresponding to 10% of the root fresh mass) was taken and maintained refrigerated in 30% ethanol (v/v) for root architecture analysis. The remaining roots were used for dry mass determination after drying at 65 oC. The refrigerated samples were scanned (Epson XL 1000, 400 dpi), and the images were analyzed in the Winrhizo software version 4.1c (REGENT INSTR. INC.). We selected the more important parameters for root fragments: total root length, total superficial area, average diameter and length, and superficial area by root diameter class. After this, the root fragments were dried under 65 ºC, and the dry mass was summed to the dry mass obtained with the remaining roots.
Soil sampling was made concomitantly to root sampling, collecting samples from each layer. The samples were air-dried and sieved through 2 mm for posterior laboratory analysis.
Soil P fractionation
Soil samples from each layer/replicate were used for chemical P fractionation analysis. Sequential P fractions followed Hedley et al. (Reference Hedley, Stewart and Chauhan1982) with modifications proposed by Condron et al. (Reference Condron, Goh and Newman1985). Briefly, 0.5 g of each sample were added to 15-ml centrifuge tubes and submitted to shaken end to end in a vertical agitator at 60 rpm for 16 h with the following sequence of extractants: anion exchange resin (PAER), 0.5 mol L-1 NaHCO3 at pH 8.5 (PBIC); 0.1 mol L-1 NaOH (PHID-0.1); 1 mol L-1 HCl (PHCl); and 0.5 mol L-1 NaOH (PHID-0.5). The soil was centrifugated at 3,278 xg for 20 min to collect the crystalline supernatant in each extraction. After centrifugation, 10 mL of 0.5 mol L-1 NaCl was added to the tube and centrifuged again to avoid the previous extractant residual effect; the liquid was discharged. The remaining soil was dried at 50 ºC for 72 h, grounded, and 0.1 g was digested for residual P (PRES), according to USEPA (1971). Determination of inorganic P (Pi) in extracts followed Murphy and Riley (Reference Murphy and Riley1962) procedure for the acid extracts (PAER, PHCl, and PRES). The methodology of Dick and Tabatabai (Reference Dick and Tabatabai1977) was used for the alkali extracts (PBIC, PHID-0.1, and PHID-0.5). These extracts were autoclaved at 121 ºC for 2 h with ammonium persulfate and sulfuric acid to determine the total P in each fraction. Organic P (Po) was calculated in the alkali extracts by subtracting Pi from the total P.
Soil P fractions were grouped into three categories according to their lability (Cross and Schlesinger, Reference Cross and Schlesinger1995). These categories are labile, moderately labile, and non-labile P. Labile P includes PAER and PBIC, which corresponds to the readily available P, Pi weakly adsorbed on soil matrix, and Po with low recalcitrance (Hedley et al., Reference Hedley, Stewart and Chauhan1982; Rodrigues et al., Reference Rodrigues, Pavinato, Withers, Teles and Herrera2016). Moderately labile P includes PHID-0.1 and PHCl, which corresponds to moderately labile Po associated with fulvic and humic acids adsorbed onto minerals and soil organic matter (SOM) (Linquist et al., Reference Linquist, Singleton and Cassman1997), strongly adsorbed Pi onto Fe, Al, and clay minerals (Hedley et al., Reference Hedley, Stewart and Chauhan1982), and Pi associated with calcium (Gatiboni et al., Reference Gatiboni, Kaminski, Rheinheimer and Flores2007). Non-labile P includes PHID-0.5 and PRes, which represent non-labile Po associated with fulvic and humic acids inside aggregates, more recalcitrant Pi adsorbed onto Fe, Al, and clay minerals (Condron et al., Reference Condron, Goh and Newman1985), and the residual P obtained by sample digestion (Olsen and Sommers, Reference Olsen, Sommers and Page1982). The sum total of labile, moderately labile, and non-labile P categories corresponds to the total P (PTOT).
Field experiment
Based on what we learned from the rhizotron experiment, we decided to carry out an experiment under field conditions to study Urochloa root depth and P cycling. To supply P at fixed depths, we introduced in the soil plastic pipes of different lengths in which we applied P aqueous solutions. The pipes stayed in the field through the experiment period to mark the exact position of application, so it would be possible to sample soil and roots close to the application point at the end of the experiment. To ensure that the roots in depth were active and able to absorb P, we also added rubidium (Rb) in the solution, as a tracer for measuring root activity. Using this approach, we created a similar scenario to the first experiment and studied if P cycling from depth did occur. The detailed methodology is below.
Site description and experimental design
The field study was conducted in a private coffee farm producer at Capetinga-MG, Brazil (20.65°S; 47.04°W; 830 m above sea level). Climate is CWa in Koppen classification, and soil is classified as Ferralsol (Soil Survey Staff, 1999). Supplementary Material Figure S2 shows the climate data for the site during the experiment.
Intercropping had been established 2.5 years prior to the experiment evaluation. Coffea arabica cv. Arara and U. decumbens were used in this system. Coffee plants were 2.5 years old and thus did not produce fruits yet. Coffee row spacing was 3.4 m and 0.6 m between plants within the row, which corresponds to 4,900 plants per hectare (ha). U. decumbens was kept 0.5 m distant from coffee rows to avoid competition. Considering this scenario, Urochloa occupied only 2.4 m from the interrows (3.4 m spacing minus 0.5 m distance from coffee plants on each side), resulting in a Urochloa effectively occupied area of 0.706 ha in each 1.0 ha of coffee-Urochloa intercrop. Before the beginning of the experiment, the area was managed regularly according to the coffee grower’s practice, i.e., fertilization was directed to the coffee rows exclusively, and Urochloa was mowed every time it was flowering (plants were approximately 1 m in height and cutting was done at 0.1 m above the ground), which corresponds to three to five cuts per year. Fertilization was done according to Quaggio et al. (Reference Quaggio, Mattos, Boaretto, Cantarella, Quaggio, Mattos, Boaretto and Raij2018) for nonproductive coffee plants and corresponded to 120 kg ha-1 of N each year in the form of urea (45% N), 30 kg ha-1 of P2O5 as triple superphosphate (45% P2O5), and 40 kg ha-1 of K2O as KCl (58% of K2O). Urochloa was cut 90 days before the experiment was installed because its growth was limited by the winter season. During the experiment, cuts increased as temperatures and rainfall were higher (Figure S2).
It was defined to apply P in distinct depths as treatments to test if Urochloa was able to cycle P from deep soil layers. The experimental design was randomized blocks with four treatments and five repetitions. Treatments consisted of applying P at 0.3 m (P03), 0.6 m (P06), and 0.9 m (P09) – and a control treatment with no P application (Figure 1b). Supplementary Material Table S6 shows soil chemical analysis at the time of experiment establishment.
In each experimental plot, two holes were made (0.5 m apart longitudinally in the interrow) with a root–soil probe (SONDATERRA® – stainless steel, length 1.2 m, internal diameter 0.055 m). The holes reached up to each treatment depth – 0.3 m for P03, 0.6 m for P06, and 0.9 m for P09. The sampled soil from each hole was divided into 0.3 m of depth layers, which corresponds to 0.0 to 0.3 m, 0.3 to 0.6 m, and 0.6 to 0.9 m. A 50-mm (diameter) plastic pipe was introduced in each hole to make possible P application at the correct depth and not above. The pipes were capped on both ends. The bottom of each cap had six small holes (3 mm each) to allow drainage of the nutrient solution. The top cap was used to avoid debris entry into the pipe (Figure 1b). A 1.5-liter solution containing 576 mg of P was applied slowly to permit infiltration in each experimental plot.
Evaluations and sampling
The experiment lasted for 194 days after the P application, and the area was managed according to the farmer’s practice. Urochloa was mowed on three occasions, at 60, 137, and 194 days, when we sampled the shoots for analysis. On each samplings date, 1.5 m2 of Urochloa surrounding the pipes were collected. All shoot material was dried under 65 ºC to obtain the SDM and then analyzed for nutrient concentration according to Malavolta et al. (Reference Malavolta, Vitti and Oliveira1997). Urochloa nutrient accumulation (kg) was estimated based on the total dry mass (TDM) and nutrient content, and the resulting value was multiplied by the area effectively occupied by Urochloa (0.706 ha) to obtain the nutrient accumulation and cycling by area.
Root activity
As proposed by Fitter (Reference Fitter1986), we used Rb as a tracer to measure root activity at 60 days. Briefly, a 10-ml Rb (RbCl) solution with a concentration of 0.15 mol L-1 was poured into the plastic tubes according to each P treatment depth – 0.3, 0.6, and 0.9 m. At the time of the first shoot sampling and after sample processing, as previously described, the dried shoot was submitted to nitro-perchloric digestion, and Rb was determined by inductively coupled plasma – atomic emission spectrometry (Tezotto et al., Reference Tezotto, Favarin, Azevedo, Alleoni and Mazzafera2012). Measures were taken only at 60 days because Rb was applied only at the experimental establishment, and low measurements at the following shoot sampling dates would not necessarily mean a lower root activity but a lower residual effect of Rb in soil. This method is possible due to the naturally low presence of Rb in soils and with the assumptions that the sorption characteristics of the soil are homogeneous with increasing depth and among plots (Rosolem and Pivetta, Reference Rosolem and Pivetta2017). There is no advective transport of Rb to other layers, and soil moisture and plant transpiration are the main drivers of soil solution flow to roots (Rosolem and Pivetta, Reference Rosolem and Pivetta2017), which is similar among plots as well. We used Rb to assay root activity instead of radioactive P isotopes because of its potential harm to both handler and environment.
Root and soil samplings and P fractionation
At establishment (day 0) and at 194 days, soil samples were collected with the same root/soil probe utilized to dig the holes for the treatments. Each root/soil sample was taken inside a Urochloa tussock near each treatment tube, totalizing two samples per plot. Samples were taken up to 0.9 m of depth but divided into layers of 0.3 m of depth – 0.0 to 0.3 m, 0.3 to 0.6 m, and 0.6 to 0.9 m. Each of these layers corresponds to a soil volume of 0.454 dm3. Each sample was sieved (2 mm) to separate the root fragments from the soil. The roots were conditioned in a 20% ethanol solution and refrigerated for posterior scanning analysis in the Whinrizo software. After this, root fragments were dried at 65 ºC dry mass determination. Root dry mass (RDM, in kg ha-1) was calculated by dividing the root density (g dm-3) by the soil volume of each sample layer (m3 ha-1). The soil was separated from roots at the beginning and the end of the experiment, air-dried, and sieved (2 mm) for posterior routine chemical analysis and P fractionation as described in the first experiment.
Statistical analysis
All data were submitted to tests of normality and variance heterogeneity. Data transformation to log was applied when residuals were not normal. Data were submitted to one-way ANOVA, except for RDM and soil P fractionation data that were submitted to two-way ANOVA to compare different soil layers and P availability. The means were compared using Tukey’s test at p < 0.05. Correlation among variables was done using the parametric Pearson test. All statistical analyses were done using the R software (version 3.6.1).
Results
Rhizotron experiment
Biomass and P partition data among shoot and roots of U. decumbens are presented in Figure 2. Significant differences were found for SDM, TDM, root allocation among layers, and P partition. Higher cumulative SDM was recorded for treatments with adequate P availability in the first layer (0.0–0.3 m; treatments 1 to 4) instead of control and treatments 5 and 6. The same trend was found for shoot P (Figure 2b). On the other hand, TDM, total P and root P content were lower for control and treatment 6 compared with treatment 3 only, with no differences among the other treatments (Figure 2a and 2b). RDM did not differ among treatments (Figure 2a), but, for all treatments, most roots were contained in the first layer – especially the control treatment – and the percentage of roots reduced as the soil depth increased. Adequate P availability in one or more soil layers increased root depth and root distribution through the soil profile for all treatments compared to control. However, adequate P availability throughout the whole soil profile (0.0 to 2.0 m, treatment 4) reduced root depth compared to the other treatments that had adequate P availability in only some layers (treatments 1, 2, 3, and 5). Significant differences were found for root biometric parameters but without a clear pattern (Supplementary Material Table S2). P starvation would expect to increase the specific root length, but that was not observed in this study.
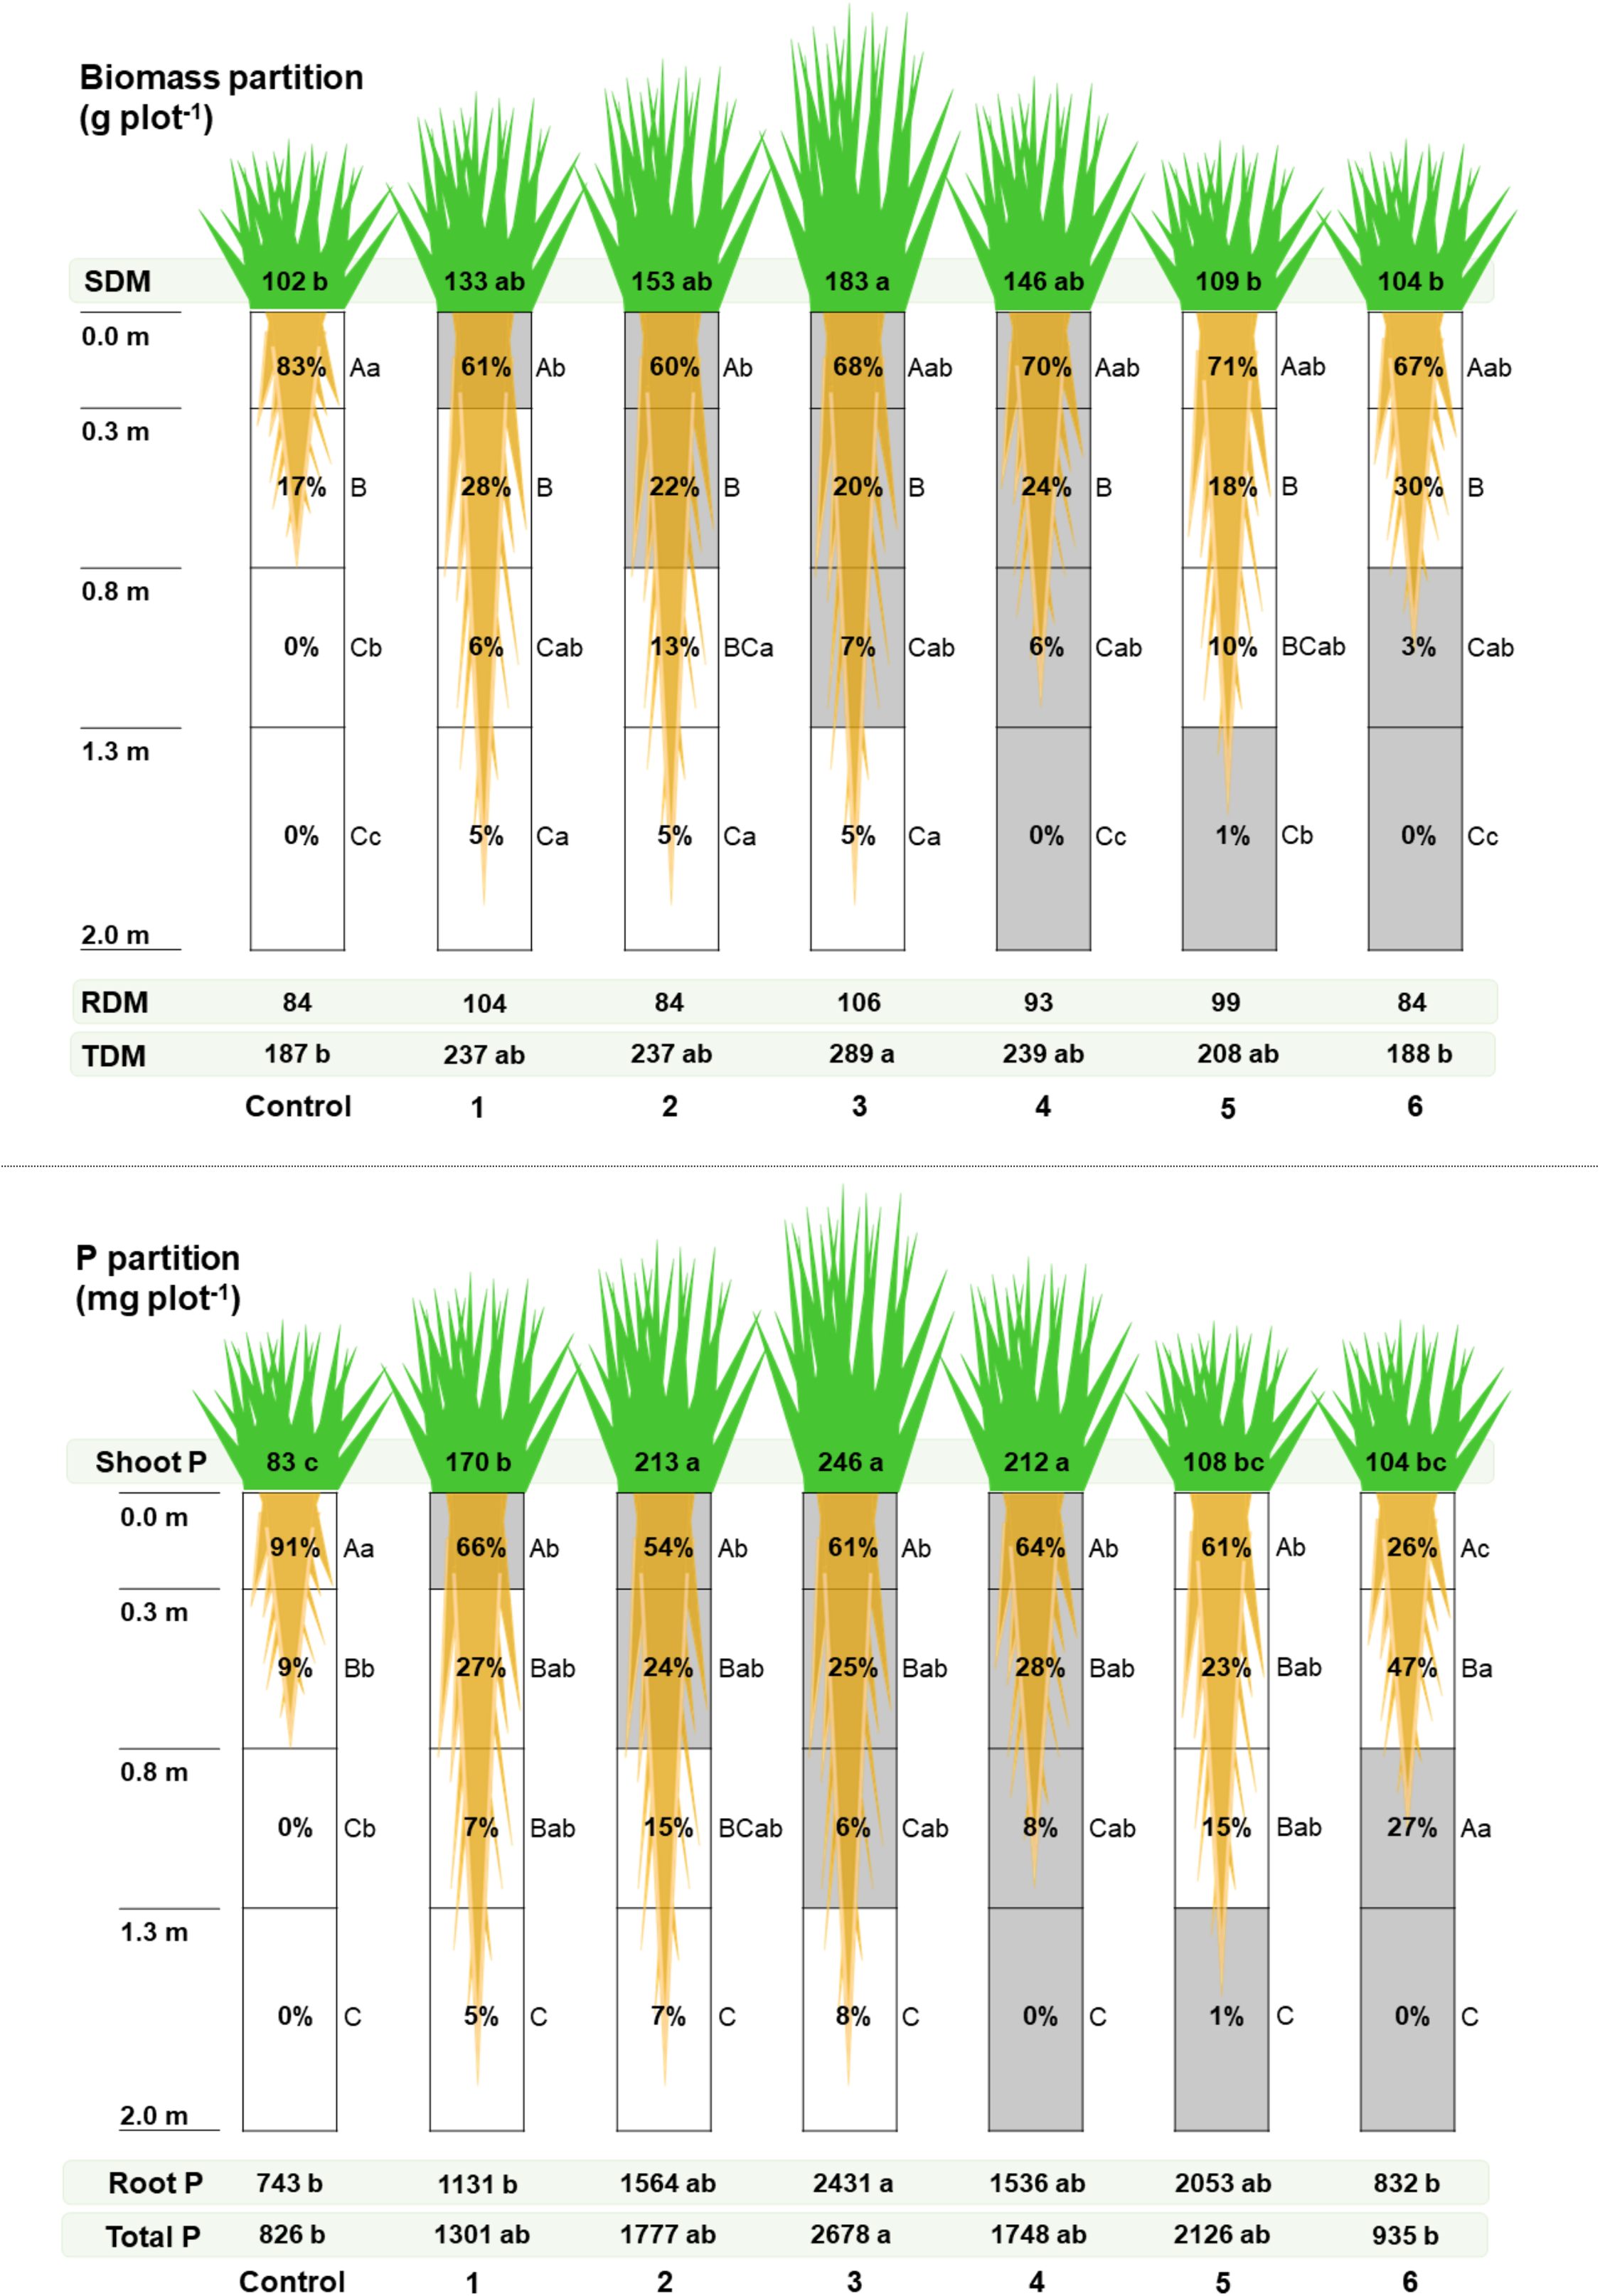
Figure 2. U. decumbens biomass and P partition among shoot and root. The gray color represents the soil layers where P availability for U. decumbens was adequate. Treatments description: 1 – adequate P availability from 0.0 to 0.3 m; 2 – adequate P availability from 0.0 to 0.8 m; 3 – adequate P availability from 0.0 to 1.3 m; 4 – adequate P availability from 0.0 to 2.0 m; 5 – adequate P availability from 1.3 to 2.0 m; 6 – adequate P availability from 0.8 to 2.0 m; and a control treatment with low P availability trough the profile. Root drawing represents the depth up to each of the roots were found at the end of the experiment. The values inside each layer of the rhizotron represent the percentage of roots and root P in each layer. Letters represent significant differences by Tukey’s test (p < 0.05). Uppercase letters denote differences among layers of each treatment; lowercase letters denote differences among treatments.
Total nutrient content on U. decumbens shoot was similar among treatments. However, significant differences were found for P (Figure 2) and K (Supplementary Material Table S4).
Soil P fractionation showed that labile P and moderately labile P levels increased in the layers where P was applied (Figure 3a and 3b). The same was observed for total P (Figure 3d). Also, although non-labile P did not change among treatments when comparing the two bottom layers, treatments that received P in the two top layers had higher values in these layers (Figure 3c). Altogether, soil P fractionation showed that the soil P in layers to which P was supplied had similar levels and dynamics independently of the treatment itself (Figure 3).

Figure 3. Soil labile P (a), moderately labile P (b), non-labile P (c), and total P (d) in mg kg-1 for the rhizotron experiment. The gray color represents the soil layers where P availability for U. decumbens was adequate. Treatments description: 1 – adequate P availability from 0.0 to 0.3 m; 2 – adequate P availability from 0.0 to 0.8 m; 3 – adequate P availability from 0.0 to 1.3 m; 4 – adequate P availability from 0.0 to 2.0 m; 5 – adequate P availability from 1.3 to 2.0 m; 6 – adequate P availability from 0.8 to 2.0 m; and a control treatment with low P availability trough the profile. Letters represent significant differences by Tukey’s test (p < 0.05). Uppercase letters denote differences among layers of each treatment; lowercase letters denote differences among treatments for each layer.
Pearson’s correlation for U. decumbens biomass production, P content, and soil P fractionation (Table 1) revealed a strong (r > 0.80) and significant correlation among SDM, labile P, and moderately labile P from 0.0 to 0.8 m; shoot P and labile P and moderately labile P from 0.0 to 0.8 m had strong and significant correlation (r > 0.90). We found a strong correlation between labile P and moderately labile P in all soil layers (Table 1). This result demonstrates the equilibrium dynamics of these two fractions as the more labile P there was, the more the moderately labile P fraction was supplied with P. It is worth mentioning that root parameters had no significant correlation with any parameter related to P cycling.
Table 1. Pearson’s correlation coefficients for the relationships among U. decumbens biomass production, P content, and soil P fractioning for the rhizotron experiment. Shoot dry mass (SDM), root dry mass (RDM), shoot P, root P, labile P on the 0.0–0.3 layer (LP0.3), labile P on the 0.3–0.8 layer (LP0.8), labile P on the 0.8–1.3 layer (LP1.3), labile P on the 1.3–2.0 layer (LP2.0), moderately labile P on the 0.0–0.3 layer (MP0.3), moderately labile P on the 0.3–0.8 layer (MP0.8), moderately labile P on the 0.8–1.3 layer (MP1.3), moderately labile P on the 1.3–2.0 layer (MP2.0), non-labile P on the 0.0–0.3 layer (NP0.3), non-labile P on the 0.3–0.8 layer (NP0.8), non-labile P on the 0.8–1.3 layer (NP1.3), and non-labile P on the 1.3–2.0 layer (NP2.0)

* Significant correlation (p < 0.05).
Field experiment
As observed in the first experiment, Urochloa RDM diminishes as soil deepens (Supplementary Material Figure S3A) for both sampling dates; also, at 0 day, there were more roots than at 194 days (Figure S3A). On the other hand, root activity differed according to depth (Supplementary Material Figure S3B). Root activity was 30% lower at 0.3–0.6 m and 65% lower at 0.6–0.9 m concerning the upper layer. Similar to the rhizotron experiment, there were no differences in root length, superficial area, or diameter (Table S6).
There were no differences among treatments in SDM within each sampling date (Figure 4) nor in the cumulative SDM (Figure 4b). P accumulation was 11.5 kg P ha-1 on average and did not differ among treatments; however, at 60 days, P accumulation was higher in the treatment that received P at 0.3 m (Supplementary Material Table S7).

Figure 4. U. decumbens partial shoot dry mass (SDM) on each sampling date (a) and cumulative SDM (b).
As expected, P levels decreased as the soil deepened (Table 2, Supplementary Material Table S9). For P applied at 0.3 m, no residual effect from fertilizer was noticed as P levels reduced between 0 and 194 days (Table 2), and there were no differences in each P fraction per se (Table S9). However, a significant increase in total P where P was applied at 0.6 and 0.9 m was found, mainly due to an increase in the residual fraction (Table S9).
Table 2. Soil P sequential fractioning according to P lability (labile, moderately labile, and non-labile) under phosphate application at distinct depths (0.3 m, 0.6 m, and 0.9 m). Field experiment. Capetinga – MG, Brazil

Letters denote significant differences by Tukey’s test (p < 0.05). Lowercase letters denote differences among sampling dates of each treatment.
Discussion
Dry mass
In both experiments, a reduction of RDM with soil depth was found. In the rhizotron experiment, the low P availability in the top layers of control and treatments 5 and 6 is responsible for the overall tendency of higher root concentration near the surface compared to the other treatments (Holanda et al., Reference Holanda, Mengel, Paula, Carvaho and Bertoni1998). Moreover, P has a role in regulating the gravitropic growth of roots, and it is specific to the plant genotype as more P-efficient genotypes tend to have shallower roots when there is low P availability (Liao et al., Reference Liao, Rubio, Yan, Cao, Brown and Lynch2001). This seems to be the case for U. decumbens as well. There were no differences in RDM among treatments, which might also be related to the low requirements of P of U. decumbens (do Valle et al., Reference do Valle, Macedo, Euclides, Jank, Resende, Fonseca and Martuscello2011; Kanno et al., Reference Kanno, Macedo and Bono1999; Rao et al., Reference Rao, Kerridge, Macedo, Miles, Maass, do Valle and Kumble1996). A 10-fold increase in P availability in hydroponic solution had little effect on U. decumbens root mass (Baptistella et al., Reference Baptistella, Llerena, Domingues-Júnior, Fernie, Favarin and Mazzafera2021). Louw-Gaume et al. (Reference Louw-Gaume, Schweizer, Rao, Gaume and Frossard2017) report that root morphological traits do not change with P supply in U. decumbens, and that the plant is little responsive to P in terms of RDM and SDM. In the field experiment, this reduction could also be a consequence of the low nutrient availability and higher aluminum saturation (m%) in these layers (Table S6). The levels of m% are harmful to Urochloa root growth (Magalhaes et al., Reference Magalhaes, Piñeros, Maciel and Kochian2018), and even though U. decumbens is tolerant to it (Arroyave et al., Reference Arroyave, Tolrà, Thuy, Barceló and Poschenrieder2013), Al availability can reduce RDM when compared to plants growing free from its presence (Furlan et al., Reference Furlan, Rabêlo, Rossi, Martinelli, Azevedo and Lavres2018). Nevertheless, roots from all layers were active and, thus, capable of nutrient uptake.
Phosphorus cycling
In the rhizotrons, interestingly, P availability through the profile did not increase biomass production, meaning that U. decumbens had all the P needed in the superficial layers, a result of its low P requirements and, consequently, low responsiveness to P (Baptistella et al., Reference Baptistella, Llerena, Domingues-Júnior, Fernie, Favarin and Mazzafera2021; do Valle et al., Reference do Valle, Macedo, Euclides, Jank, Resende, Fonseca and Martuscello2011; Louw-Gaume et al., Reference Louw-Gaume, Schweizer, Rao, Gaume and Frossard2017; Rao et al., Reference Rao, Kerridge, Macedo, Miles, Maass, do Valle and Kumble1996). Also, the strong and positive correlation among SDM, total P content, labile P, and moderately labile P in the upper layer suggest, in a practical sense, that the current recommendations to supply P at the superficial layers can produce the best results regarding total biomass production. Total biomass production of cover crop species is also the main driver of the benefits introduced by them (Mennan et al., Reference Mennan, Jabran, Zandstra and Pala2020; Osipitan et al., Reference Osipitan, Dille, Assefa, Radicetti, Ayeni and Knezevic2019).
Soil P fractionation indicates the preferential adsorption of P derived from fertilizer and the temporal dynamism among these two fractions. P derived from fertilizer is solubilized and initially adsorbed to the labile and consecutively to the moderately labile fraction; also, they keep a dynamic equilibrium, where the moderately labile fraction feeds the labile one over time (Foltran et al., Reference Foltran, Rocha, Bazani, Gonçalves, Rodrigues, Pavinato, Valduga, Erro and Garcia-Mina2019). According to Almeida and Rosolem (Reference Almeida and Rosolem2016), Urochloa can uptake P from the moderately labile fraction, increasing the labile fraction after its cultivation. We did not observe that in our study probably because of the short-time evaluation, not enough to detect changes in these fractions.
P accumulation in the field was only affected at the first sampling date (Supplementary Material Table S8) when the treatment with P supply at 0.3 m had more shoot P than the control. This may be the result of many factors. First, the reduction in RDM and root activity with depth means that there were fewer roots at depth, but these roots were less active as well, which could partially account for the lack of difference between control and P supply at depth. Second, we cannot rule out that the P rate may have been low to cause a residual effect over all the sampling dates. Unlike the first experiment, in the field experiment, we could not supply P homogenously in deep layers. Third, the high Al availability in the subsoil (Table S6) reduced P bioavailability and the effect of P supply, as can be seen in the higher non-labile P fraction in the treatments where P was applied at the depths of 0.6 and 0.9 m. Foltran et al. (Reference Foltran, Rocha, Bazani, Gonçalves, Rodrigues, Pavinato, Valduga, Erro and Garcia-Mina2019) reported an increase in the labile P fractions in the first 30 days of the experiment in a eucalyptus (Eucalyptus grandis) plantation. However, late evaluations at 180 days showed reductions in these fractions; the same may have occurred in our study. Similarly, Almeida et al. (Reference Almeida, Rocha, De Souza, Delai and Rosolem2018) reported lower P availability after U. ruziziensis rotation independently of the P rate applied during the off-season. Also, even under controlled conditions, increasing P availability from 10 to 100% had little effect on U. decumbens biomass production, shoot P, root exudation of metabolites, and root P transporter expression (Baptistella et al., Reference Baptistella, Llerena, Domingues-Júnior, Fernie, Favarin and Mazzafera2021). In the same study, U. decumbens had a lower shoot and root P compared to U. brizantha and U. ruziziensis.
Over the two experiments, we discussed steps related to P mobilization and uptake by Urochloa, but P cycling also comprehends the return of the element to the soil by decomposition and mineralization of plant residues. However, due to the high recalcitrance of these residues and environmental conditions (Momesso et al., Reference Momesso, Crusciol, Soratto, Vyn, Tanaka, Costa, Ferrari-Neto and Cantarella2019; Tanaka et al., Reference Tanaka, Crusciol, Soratto, Momesso, Costa, Franzluebbers, Junior and Calonego2019), not all shoot and root P Urochloa residues are mineralized in the short term nor synchrony with coffee demand. According to Costa et al. (Reference Costa, Crusciol, Soratto and Ferrari2016), half of the P is released after 20 days, and 90% would be released in 1 year (Costa et al., Reference Costa, Andreotti, Buzetti, Lopes, Santos and Pariz2014). Moreover, decomposition and mineralization are affected by fertilization management (Silva et al., Reference Silva, Dubeux, Silveira, dos Santos, de Freitas and de Andrade Lira2019): Urochloa residues are mowed and thrown to coffee rows, covering the soil beneath the projection of the coffee branches. As coffee fertilization is directed to the coffee rows, fertilizer inevitably lands on these Urochloa residues, which may enhance the rate of decomposition and the rate that nutrients are released.
Our results showed that U. decumbens is potentially able to cycle 11.5 kg ha-1 of P in 194 days on field conditions (average). It may seem negligible, but coffee-producing trees have a demand of 0.1 kg of P per bag of 60 kg (Malavolta, Reference Malavolta1993). For instance, average yields from the last 2 years in Brazil are 29.2 bags ha-1 (CONAB, 2021), a demand of 2.92 kg P ha-1, which U. decumbens residues would fulfill. Moreover, this amount of P would be enough to fulfill the demand for both vegetative and reproductive growth for yields up to 60 bags ha-1 (Souza, Reference Souza2018). The coffee plants of this study were not productive yet. Therefore, considering an estimated demand of 7.5 kg of P ha-1 for vegetative growth (Souza, Reference Souza2018), it would also be fulfilled by the P cycling of U. decumbens residues.
Conclusion
Both experiments showed similar results regarding the overall pattern of P cycling by Urochloa decumbens. In rhizotron conditions, P uptake and biomass production were higher where P was available in the top 0.3 m compared to other treatments; these variables were also positively correlated with the labile and moderatelylabile P fractions of the soil. In the field, U. decumbens was able to accumulate and recycle enough P in its shoot that could satisfy coffee demand for the nutrient. Therefore, Urochloa intercropped with coffee arabica can be a strategy to increase PUE even in high-yield coffee production systems. However, we know that long-term experiments are still necessary to check if P retained by soil particles at deep layers becomes available because of a more effective Urochloa root system exploration. Experiments designed for that would provide more accurate data on soil dynamics of P and cycling by Urochloa.
Supplementary Material
For supplementary material for this article, please visit https://doi.org/10.1017/S0014479722000321
Acknowledgements
JLCB thanks The São Paulo Research Foundation (FAPESP) for a student fellowship (grant 2018/02497-3), and PSP and PM thank Brazilian National Council for Scientific and Technological Development (CNPq) for research fellowships. We thank Edson Moraes for technical assistance in the greenhouse experiment, Giovane Assoni for assistance during field sampling and greenhouse experiments, and Moscardini family for the support during the field experiment.
Authors Contribution
JLCB: Conceptualization, Investigation, Formal analysis, Data curation, and Writing – Original Draft. APBT: Methodology, Visualization, and Writing – Review and Editing. JLF: Writing – Review and Editing. PSP: Conceptualization, Methodology, and Writing – Reviewing and Editing. PM: Conceptualization, Methodology, Writing – Review and Editing, and Supervision.
Financial Support
The funders had no role in the study’s design, in the collection, analyses, or interpretation of data, in the writing of the manuscript, or in the decision to publish the results.
Competing Interest Declaration
The authors declare no conflict of interest.


