


Clays are commonly used materials in ceramics (Norton, Reference Norton1970; Reeves et al., Reference Reeves, Sims and Cripps2006; Murray, Reference Murray2007) as well as in cosmetic, medical and environmental applications (Bundy & Ishley, Reference Bundy and Ishley1991; Murray, Reference Murray1991; Minato & Shibue, Reference Minato and Shibue1999; Murray & Kogel, Reference Murray and Kogel2005; Viseras et al., Reference Viseras, Aguzzi, Cerezo and Lopez-Galindo2007). Raw clays have complex chemical, mineralogical and physical properties that may be useful in manufacturing processes (e.g. Felhi et al., Reference Felhi, Tlili, Gaied and Montacer2008; Mitrović et al., Reference Mitrović, Komljenović and Ilić2009; Hammami-Ben Zaied et al., Reference Hammami-Ben Zaied, Abidi, Slim-Shimi and Somarin2015; Boussen et al., Reference Boussen, Sghaier, Chaabani, Jamoussi and Bennour2016; Milošević & Logar, Reference Milošević and Logar2017; Milošević et al., Reference Milošević, Logar, Kaluđerović and Jelić2017; Tsozué et al., Reference Tsozué, Nzeugang, Macheb, Loweh and Fagel2017, etc.). Clays often contain impurities, most commonly calcite, quartz, feldspars and iron oxides. Clay materials have been used worldwide in traditional handcrafting without chemical pretreatments. Clays that are used in the manufacture of structural bricks and tiles are often processed directly as they are dug out from the ground. In their untreated form, these raw clays are easily workable because they already contain fillers and fluxes in association with the clay minerals. In the case of ceramics and whitewares, for which the clay material should be relatively pure, the clays need to be treated to remove most impurities.
The clay deposit in the village of Dobrodo, Serbia, has traditionally been exploited by small manufacturers of ceramics for >400 years and is used in the production of the renowned Zlakusa pottery. The location of this deposit in relation to the pottery makers in the village of Zlakusa is of great importance to ethnological and archaeological research (Djordjević, Reference Djordjević2013). Nevertheless, its mineralogy, locality and application potential remain little known worldwide, especially within the scientific community. The main aim of the present study was to characterize mineralogically and determine the impurities contained within the Dobrodo raw clay deposit.
Geological and geographical setting
The Dobrodo clay deposit is located in the village of Vranjani, ~185 km from Belgrade, Serbia's capital city. It is operated by a private contractor and the clay mixture has only been used for traditional pottery-making. The clay is mined from pits that are opened afresh each year. To reach layers of high-quality clay, an overburden layer ~3 m thick must be removed because the surface water drains in the clay pit, rendering it useless until the dry summer period of the year. The deposit is mostly of Miocene age, consisting mainly of sand, clay, marl and dolomite (Fig. 1). The Miocene formations begin with sandstone or sand and conglomerate and were deposited in freshwater basins. The sediments have a thin-layered, fine, pelite structure, often with fine lamination and occasional lenses and concretions (Mojsilović et al., Reference Mojsilović, Baklajić, Đoković, Avramović and Dimitrijević1971).

Fig. 1. Location (left, black star) and geological setting of the Zlakusa clay deposit (right, black star) (Basic Geological Map of Serbia 1:100,000, Titovo Užice sheet).
Experimental
Materials
The clay was collected from exposed faces of the Dobrodo deposit, which consists of several discrete layers (Fig. 2). The thin layer of clay at the top of the deposit has a brown colour (sample 6) and contains lens-like inclusions of light beige-coloured material (sample 5). Between the upper part and the thickest light-grey layer at the bottom (sample 3) lies a thin stratum of dark-grey clay with a distinct coal-like odour (sample 4). Representative samples were collected according to their colour and depth. Approximately 1 kg of each sample (four samples in total) was dried at room temperature, crushed and homogenized without further separation or purification.
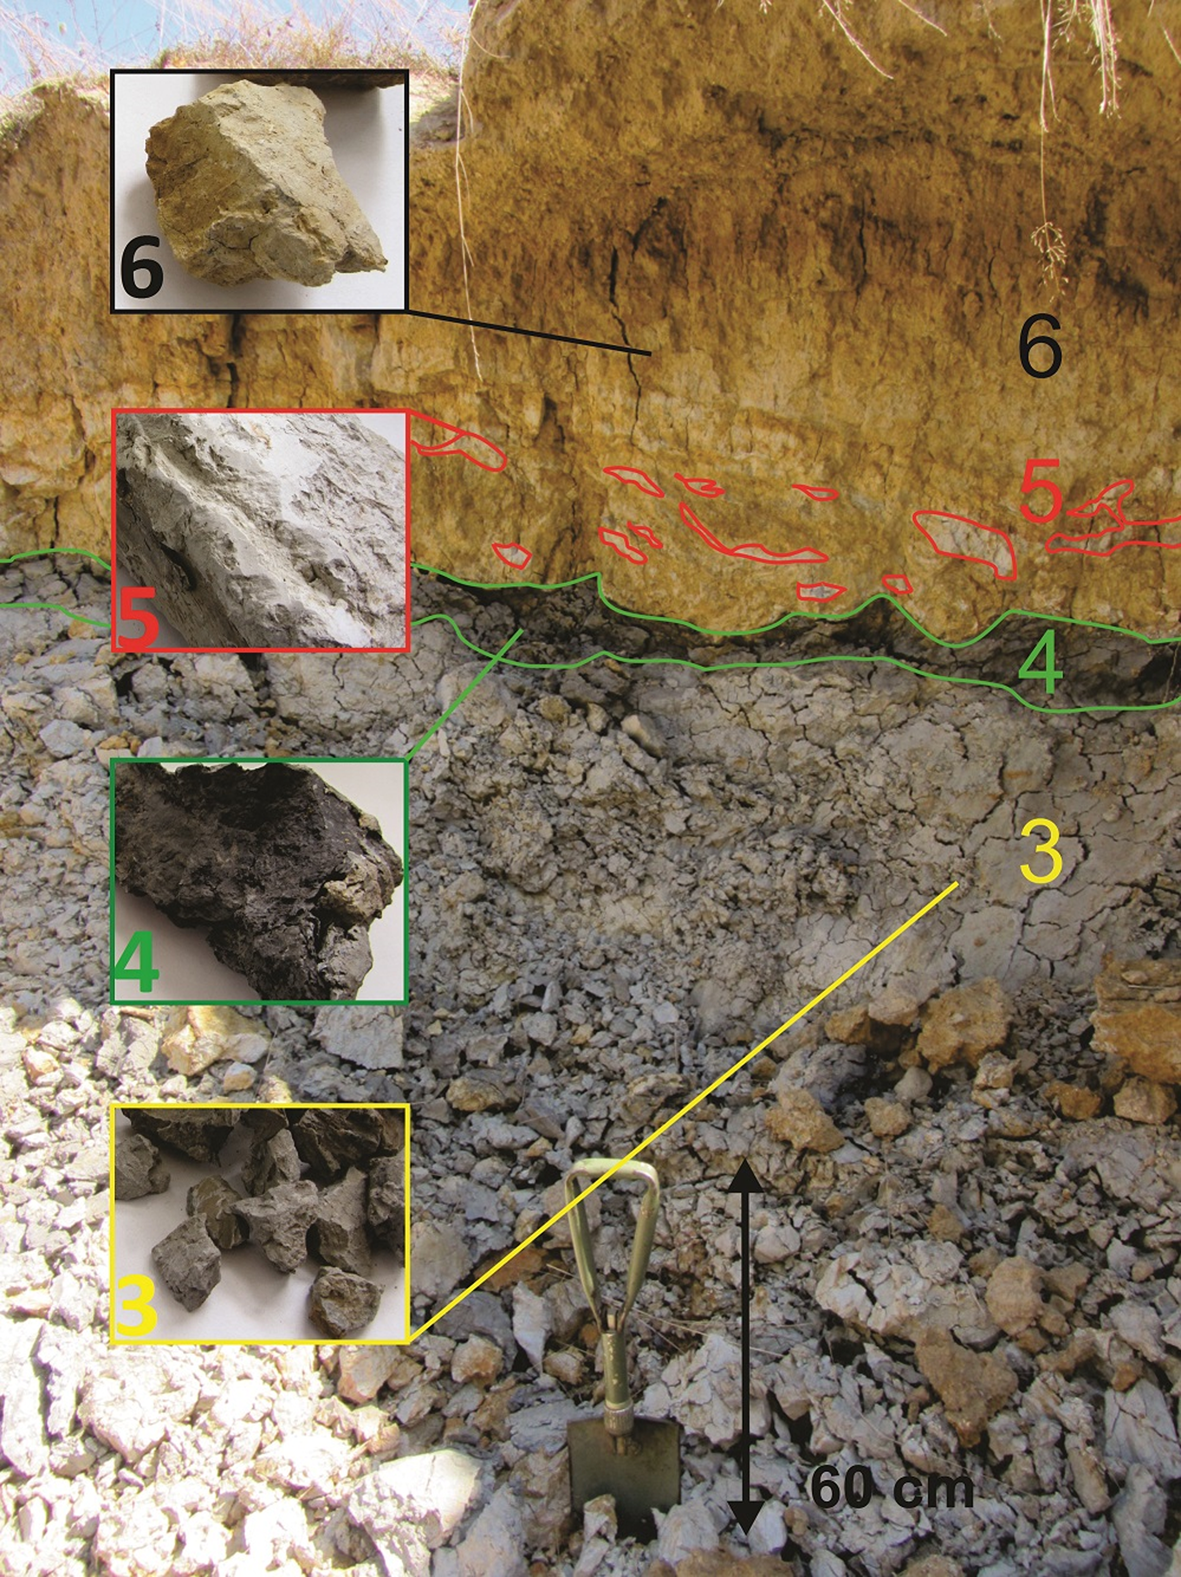
Fig. 2. Layers of the Dobrodo deposit with investigated samples and their corresponding labels.
Analytical methods
Grain-size distribution was determined by the pipette method on raw samples according to the DIN ISO 11277 (2002). The X-ray powder diffraction (XRPD) data were collected on a Rigaku SmartLab X-ray powder diffractometer at room temperature using Bragg–Brentano geometry and Cu-Kα radiation. The diffractometer was operated at 40 kV and 30 mA in the scan range of 3–70°2θ with a step size of 0.01°2θ and scanning speed of 2°2θ min–1. The XRPD experiments were carried out on powdered bulk samples and on oriented preparations that were air dried (N), solvated with ethylene glycol (EG) and heated to 550°C for 1 h (H). The mineral phases were identified using Rigaku PDXL 2 software and the PDF-2 database (International Centre for Diffraction Data). The mass ratios of the clay mineral phases present were determined with the whole-powder pattern fitting method (WPPF) using the same software.
The chemical compositions of the samples were determined by energy-dispersive X-ray fluorescence (ED-XRF) using an Oxford 2000 ED-XRF spectrometer equipped with XpertEase software. The samples (10 g) were ground in a HERZOG HSM 100H vibrational mill for 30 s to pass through a 160 μm sieve. Metal sample holders were filled with boric acid powder over which the samples were evenly distributed and then pressed (10 s) in a T-40 SPECAC press to form 40 mm pellets. The cation-exchange capacity (CEC) of the samples was determined after saturation with methylene blue solution according to ASTM C 387-99 (1984), using a uniSPEC2 spectrophotometer. Visual inspection of the sample colour was conducted using the geological rock colour chart with genuine Munsell colour chips (Geological Society of America, 2009). The dominant wavenumbers of the dry, pressed, raw powder samples before and after firing at 1100°C were measured with diffuse reflectance apparatus (400–700 nm) using a CCS200 spectrometer (Thorlabs) according to the Commission Internationale de l'Eclairage (1932).
Differential thermal analysis (DTA) was performed on a modernized ADAMEL furnace equipped with a Pt–PtRh thermocouple and BK PRECISION XLN15010 DC power supply as the heating rate controller in an air atmosphere. The heating rate was 10°C min–1 over a temperature range of 20–1100°C. Measured data were plotted relative to a baseline obtained using Al2O3 as a reference material. Particle morphology and grain-size distribution were determined by scanning electron microscopy (SEM) with a JEOL JSM-6610LV scanning electron microscope coupled with an Oxford X-Max 20 mm2 energy-dispersive X-ray spectrometer. The Atterberg limits (Atterberg, Reference Atterberg1911) were determined according to the Casagrande method (Laboratoire Central des Ponts et Chaussées, 1987).
Results and discussion
Chemical composition
Chemical analysis of the samples (Table 1) shows a relatively large abundance of SiO2 (>61 wt.%) and Al2O3 (16–19 wt.%), a total Fe2O3 content of 2–4% and a small K2O content (0.05–1.00%). The mass ratio of SiO2/Al2O3 ranges from 3.58 to 4.49, which is significantly greater than the values generally found in pure kaolinite (1.18) and pure montmorillonite (2.36) (Boussen et al., Reference Boussen, Sghaier, Chaabani, Jamoussi and Bennour2016). The high values of the SiO2/Al2O3 mass ratios are attributed to the excess of quartz and the presence of illite. The ideal composition of kaolinite is SiO2 46.5 wt.%, Al2O3 39.5 wt.% and H2O 13.96 wt.% (Newman, Reference Newman and Newman1987), which confirms that the studied samples have greater SiO2 contents. The loss on ignition of the samples is associated with the presence of hydroxides, organic matter and clay minerals (Baccour et al., Reference Baccour, Medhioub, Jamoussi and Mhiri2009), which is confirmed by DTA. The small amounts of Ca and Mg oxides indicate the lack of carbonate minerals. Hence, the samples may be regarded as carbonate-free and SiO2-rich, which makes them suitable for ceramic products. The low abundance of K2O and Na2O might indicate further the presence of kaolinite minerals in the samples that naturally contain a small amount of flux materials (Monterio & Vieira, Reference Monterio and Vieira2004; Celik, Reference Celik2010). Samples 3 and 4 contain the smallest amounts of K2O + Na2O (0.13 and 0.40 wt.%, respectively), indicating a greater degree of kaolinization (Sikalidis et al., Reference Sikalidis, Kafritsas and Alexiades1989; Kamseu et al., Reference Kamseu, Leonelli, Boccaccini, Veronesi, Miselli, Giancarlo Pellacani and Chinje Melo2007). Fe2O3, TiO2 and Na2O are more abundant in the uppermost sample (#6) than in the lowermost sample (#3; Table 1).
Table 1. Chemical analysis of the samples (wt.%).

a Total Fe as Fe2O3.
LOI = loss on ignition (950°C).
Iron-bearing phases were not detected unambiguously by XRPD analysis in most samples, indicating that Fe may be present in an amorphous form. Titanium precipitates quickly in situ (Bain, Reference Bain1976). The TiO2 content does not exceed 0.90% in any of the samples, and the corresponding minerals detected by SEM were needle-like crystals of rutile (Fig. 3), indicating slight weathering of the soil (Sherman, Reference Sherman1952).

Fig. 3. SEM images of rutile minerals, with insert showing corresponding energy-dispersive X-ray spectra.
Mineralogy
The mineral phases identified in the XRPD traces are smectite (International Centre for Diffraction Data #01-073-6746), kaolinite/halloysite (01-078-2110), mica/illite (01-078-5138), quartz (01-085-0930), paragonite (01-075-1202) and Na-feldspar (albite) (01-076-0803). Kaolinite/halloysite and mica/illite minerals were identified by the reflections at 7.2 and 10 Å, respectively, in the bulk XRPD traces (Fig. 4) and are not affected by EG solvation (Fig. 4). The intensity of the kaolinite 001 reflections decreased after heating (Fig. 4). Swelling minerals, such as smectite, exhibit their 001 reflection in the <7 Å region, which shifts to lower angles after EG solvation (Fig. 4).
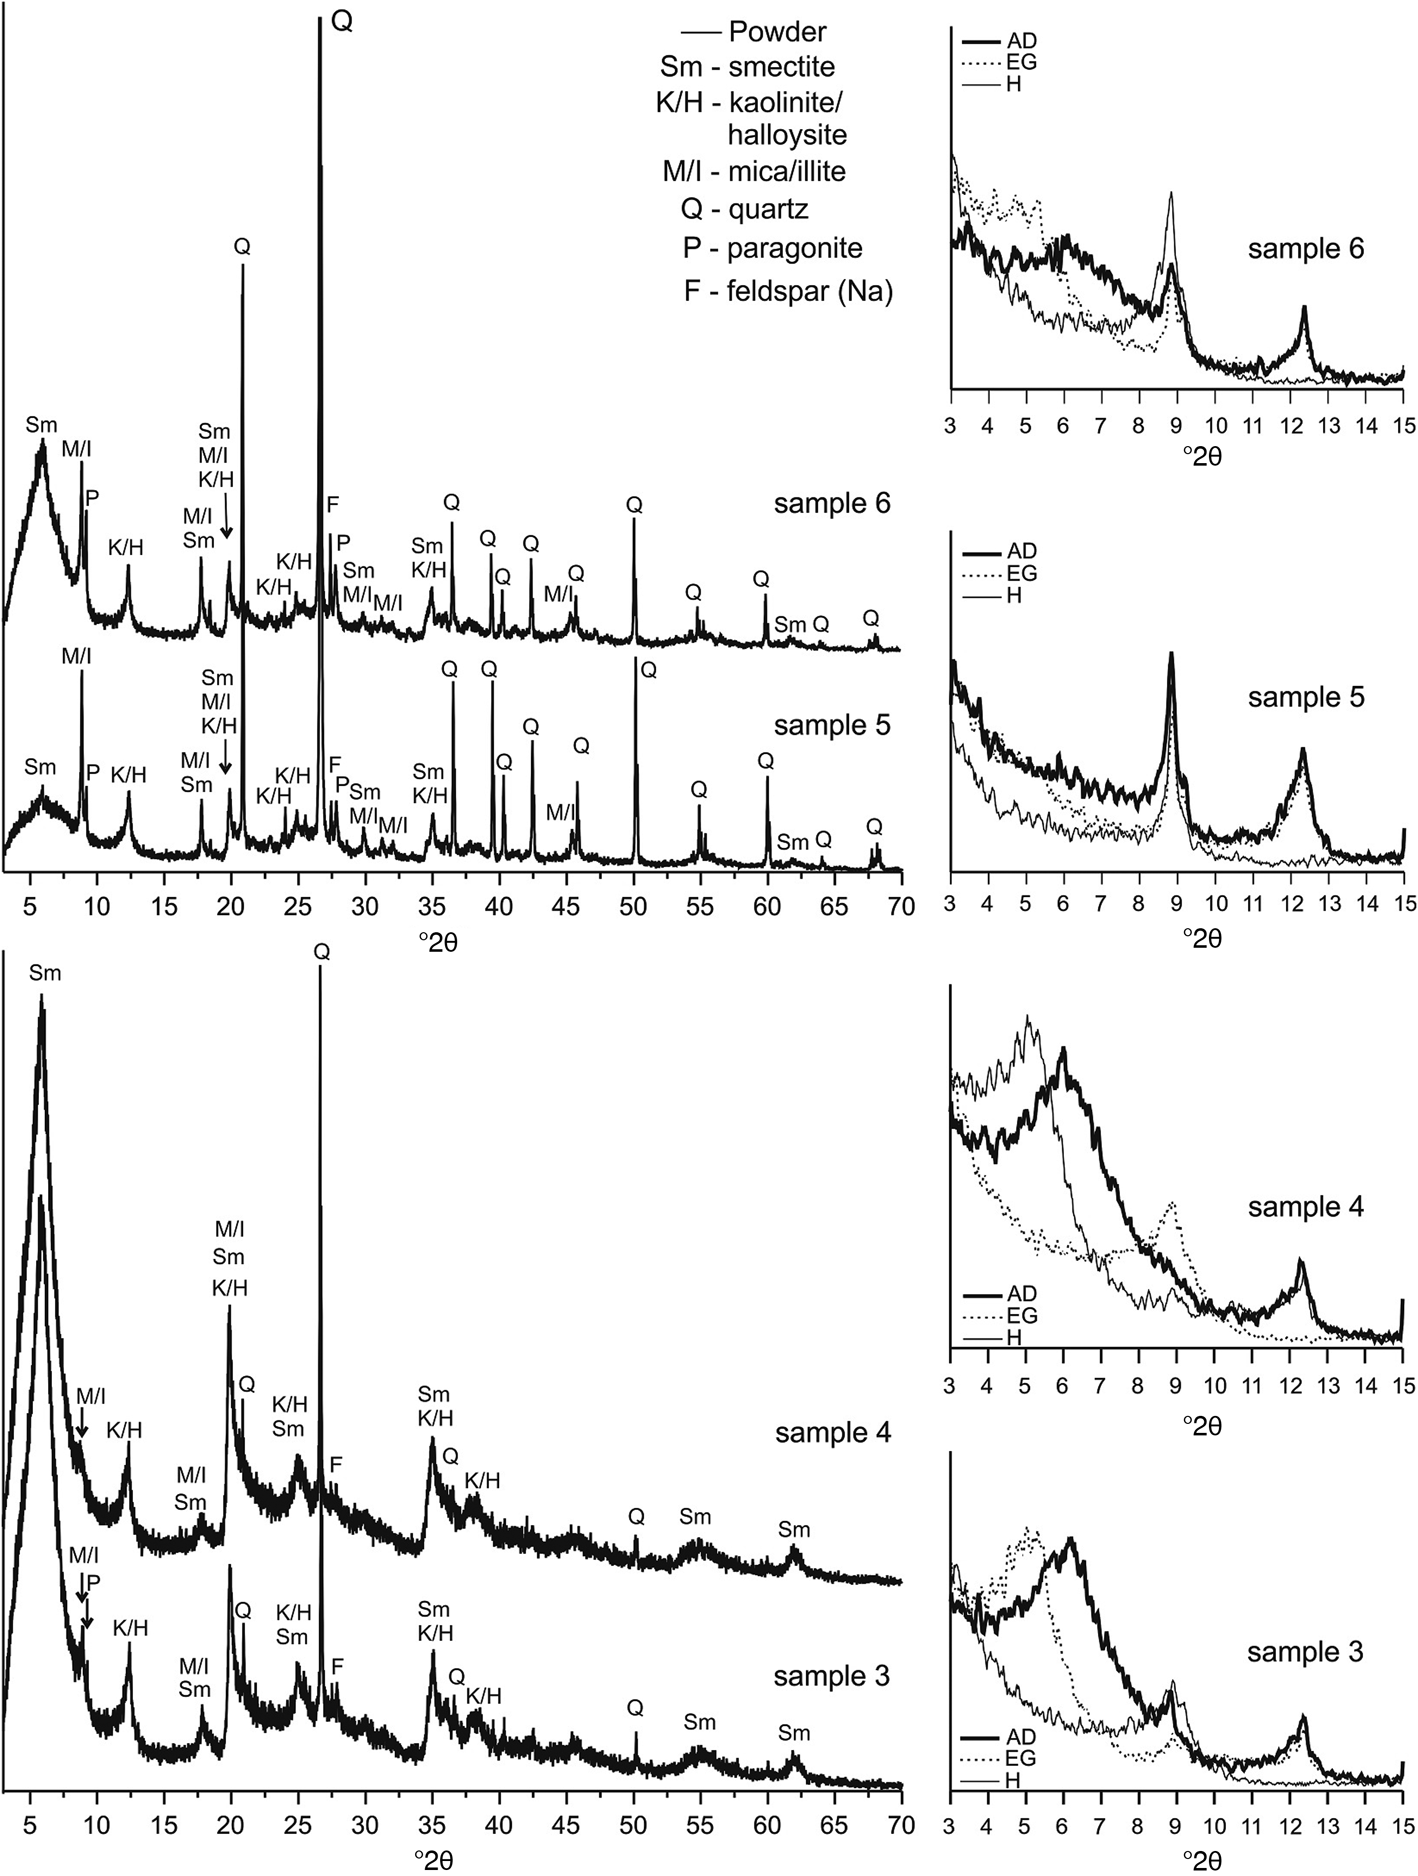
Fig. 4. XRPD traces of the raw samples (left) and oriented clay fractions of the samples (right).
Semi-quantitative estimates of the mineral phases present are shown in Table 2. The dominant mineral phases in samples 3 and 4 are smectite and kaolinite (Fig. 4, Table 2). Illite is present in small amounts when compared to smectite and kaolinite (Table 3). Minor phases are quartz, Na-feldspar and accessory paragonite. In samples 5 and 6 the dominant phase is quartz (Fig. 4, Table 2). Other phases are clay minerals, Na-feldspar and paragonite. Among the clay minerals, kaolinite is the most dominant phase (~70 wt.%). Sample 5 has the smallest amount of smectite compared to the remaining samples. The illite content is virtually constant among the clay minerals (11–18 wt.%), being greatest in sample 5. The abundance of Na-feldspars decreases slightly with depth, being greatest in sample 6 and smallest in sample 3 (Fig. 4).
Table 2. Relative contributions of phases obtained by the WPPF method.

+++ = dominant; ++ = moderate; + = small amount; * = accessory.
Table 3. Mass ratios of the clay mineral phases obtained by the WPPF method.

The mass ratios of the present clay mineral phases normalized to 100 wt.%, as obtained by the WPPF method, are shown in Table 3. These results separate samples 6 and 5 with a greater kaolinite content from samples 3 and 4, which are dominated by smectite.
Particle-size distributions
The particle-size distribution of clay plays an essential role in defining the properties of suspensions (plasticity, viscosity) and green pastes during drying and firing (Rivi & Ries, Reference Rivi and Ries1997), with particular attention given to the finer fraction (<2 μm) for ceramic products (Mahmoudi et al., Reference Mahmoudi, Srasra and Zargouni2008). The tested samples contained 60.2–87.1 wt.% clay, 10.9–26.1 wt.% silt and 1.2–25.6 wt.% sand fractions. Samples 3 and 4 are rich in fine particles (87.0 and 87.1 wt.%, respectively), while sample 5 contains more coarse particles (25.6 wt.% between 2.00 and 0.06 mm). The proportions of clay, silt and sand fractions were plotted on a ternary diagram (McManus, Reference McManus and Tucker1988; Strazzera et al., Reference Strazzera, Dondi and Marsigli1997) to evaluate sample permeability (Fig. 5). Samples 3 and 4, which have the highest percentages of clay fractions, have high porosity and very low permeability. In addition, samples 5 and 6, which are classified as sandy clay and silty clay, respectively, have low porosity and low permeability. High permeability leads to low cohesion and implies difficulties in the extrusion processes (El Ouahabi et al., Reference El Ouahabi, Daoudi and Fagel2014).

Fig. 5. Ternary diagram of the samples showing the relationship between clay, silt and sand (after McManus, Reference McManus and Tucker1988; Strazzera et al., Reference Strazzera, Dondi and Marsigli1997).
Scanning electron microscopy
The SEM images of the samples show that kaolinite occurs as lamellar hexagonal flakes of 2–10 μm in diameter with broken edges (Fig. 6), occasionally forming booklets. Tubular crystals 2–7 μm long are common, confirming the presence of halloysite (Fig. 6). The morphology of a tubular halloysite may result from alteration of platy kaolinite particles or be derived from feldspars and micas (Singh & Gilkes, Reference Singh and Gilkes1992; Joussein et al., Reference Joussein, Petit, Churchman, Theng, Righi and Delvaux2005). Tubular particles are relatively Fe- and Ti-poor, while larger amounts of Fe form a platy halloysite morphology (Joussein et al., Reference Joussein, Petit, Churchman, Theng, Righi and Delvaux2005). The morphology of the samples studied suggests that the second major clay mineral is montmorillonite. Montmorillonite consists of thin, crumbled plates 2–20 μm in size with undefined outlines and large aggregates with a significant surface area. A small quantity of illite appears in the form of fibres and laths, suggesting precipitation from formation waters in sandstones (Güven, Reference Güven2001).

Fig. 6. SEM images of the investigated samples, with inserts of energy-dispersive X-ray spectra.
The Ti-bearing phase in the studied samples is rutile, consisting of elongate and needle-like crystals 2–20 μm long. The rutile has a small Fe content (Fig. 3). The abundance of rutile is greatest in sample 6 and only a couple of grains were observed in sample 3, which is in accord with the TiO2 contents obtained by XRF analysis. A few irregular Fe oxide grains of rounded shape have also been observed in sample 4.
Thermal analysis
The DTA curves of all of the clay samples show distinct endothermic peaks (Fig. 7). The first endothermic event between 100 and 200°C corresponds to the loss of adsorbed and interlayer water (Greene-Kelly, Reference Greene-Kelly and Mackenzie1957; Földvári, Reference Földvári2011). In samples 3 and 4, this band is broad and covers a region between 50 and 300°C, indicating the presence of several layer silicates – illite, kaolinite, halloysite and montmorillonite (Földvári, Reference Földvári2011). The endothermic peaks at ~350 and 450°C correspond to the dehydration of goethite (Grim & Rowland, Reference Grim and Rowland1944) and probably of halloysite (Norton, Reference Norton1939; Grim & Rowland, Reference Grim and Rowland1944). The exothermic peak at ~400°C corresponds to the development of α-Fe2O3 from ‘protohematite’ (Földvári, Reference Földvári2011) and/or the presence of organic matter (Yariv, Reference Yariv and Ikan2003). Kaolinite dehydroxylates to metakaolinite at 500–600°C. Halloysite also has a characteristic endothermal reaction due to dehydroxylation to metahaloysite (530–590°C) and illite dehydroxylates at 550°C (Norton, Reference Norton1939; Speil et al, Reference Speil, Berkelhamer, Pask and Davies1945; Földvári, Reference Földvári2011). The endothermic peaks at 650–700°C correspond to Ca-montmorillonite, hydromuscovite/illite and pyrophyllite. The broad endothermic peak at ~820°C indicates deconstruction of the silicate lattice and suggests the presence of a mixed-layer component in the clay sample, such as illite-smectite (Earnest, Reference Earnest1991). Structural decomposition of Ca-montmorillonite and crystallization of mullite, Mg-spinel and cristobalite occur at >850°C (Földvári, Reference Földvári2011) in the form of a doublet of endo-exothermic reactions. The new crystalline phase in the samples at ~950°C is primary mullite or pseudomullite with a Si-Al spinel structure and amorphous SiO2 + γ-Al2O3 (Speil et al., Reference Speil, Berkelhamer, Pask and Davies1945; Földvári, Reference Földvári2011). The presence of ferric oxides on the surfaces of the particles reduces the size and intensity of this band.

Fig. 7. DTA curves of the investigated samples.
Specific surface area and CEC
The CEC is defined as the amount of exchangeable cations, and it represents important information in evaluating the quality of clays (Burrafato & Miano, Reference Burrafato and Miano1993). The CEC of the samples varied between 12 and 52 mmol 100 g–1, while specific surface area (SSA) ranges from 94 to 410 m2 g−1 (Table 4). Greater CEC values (80–150 mmol 100 g–1; Grim, Reference Grim1953) indicate greater swelling capacity, which is typical of the smectite group of minerals. The kaolin minerals have CEC values in the range of 3–15 mmol 100 g–1; hence, sample 5 might be described as a predominantly kaolinite clay (Grim, Reference Grim1953). Samples 3, 4 and 6 do not follow the CEC limits set by Grim (Reference Grim1953). When compared to mixtures of clay minerals in previous studies (Arab et al., Reference Arab, Araújo and Pejon2015), an obvious pattern is observed (Table 4). Samples with smaller CEC values contain more kaolinite. Moderate amounts of kaolinite and smectite yield larger CEC values compared to pure kaolinite, but lower CEC values than bentonite clays (>70 mmol 100 g–1).
Table 4. CEC and SSA values of the studied samples compared to mixtures of clay minerals according to Arab et al. (Reference Arab, Araújo and Pejon2015).

a Values obtained from Arab et al. (Reference Arab, Araújo and Pejon2015).
Plasticity and toughness
The liquid limit (LL) of the samples varies from 32.4% to 53.6% and the plastic limit (PL) varies from 13.8% to 30.2%. Clays with a plasticity index (PI) <10% are not appropriate for building-related products and those with a plasticity index >34% would be difficult to extrude (Barnes, Reference Barnes and Wesley2014). Projection of the samples onto the diagram of Holtz & Kovacs (Reference Holtz and Kovacs1981) (Fig. 8) shows that the PI varies from 11.7% to 23.4%. Samples 3 and 4 are classified as very plastic clays, sample 6 as moderately plastic and sample 5 is a low-plasticity clay. The presence of smectite, even in small amounts, may significantly affect plasticity.

Fig. 8. Holtz & Kovacs (Reference Holtz and Kovacs1981) diagram of the studied samples. LL = liquid limit; PI = plasticity index.
The PI/LL ratio is highly correlated with toughness (kJ m–3), which represents the ability of clay to be deformed (Moreno-Maroto & Alonso-Azcárate, Reference Moreno-Maroto and Alonso-Azcárate2018). Toughness refers to the work per unit volume required to cause deformation on the sample when it is rolled (Barnes, Reference Barnes2009, Reference Barnes2013a, Reference Barnes2013b; Moreno-Maroto & Alonso-Azcárate, Reference Moreno-Maroto and Alonso-Azcárate2018). According to their maximum toughness (T max) values, samples can be divided into two groups (Barnes, Reference Barnes2009, Reference Barnes2013a, Reference Barnes2013b). Samples 3, 4 and 5 have T max values of 13, 11 and 9 kJ m–3, respectively, and may be classified as moderately tough, and sample 6 may be considered as a highly tough and plastic clay with a T max value of 25 kJ m–3.
Colour properties
The colour properties include observed colour (Munsell colour chart), colour values (nm) and purity of the colour (%) for raw and fired samples (1100°C). The colour of the raw clay is determined by the mineralogical composition and its position in the stratigraphic sequence. The colour of sample 6 from the uppermost horizon is greyish–yellow (5Y8/4), sample 5 is moderately orange–yellow (7.5YR7/8), sample 4 is greyish–brown (5Y3/2) and sample 3 is moderately yellowish–brown (10YR5/4). The dominant wavelengths of the original samples and in the samples after firing at 1100°C are shown in Table 5. Colouration is not due solely to the Fe2O3 content, as other constituents such as MnO and TiO2 may also modify the final colour of the product (Kreimeyer, Reference Kreimeyer1987; Celik, Reference Celik2010; Dondi et al., Reference Dondi, Raimondo and Zanelli2014; Boussen et al., Reference Boussen, Sghaier, Chaabani, Jamoussi and Bennour2016).
Table 5. Dominant wavelength (nm) and purity of the colour (%) of raw samples and samples after firing.

The purity of the colour is greater after firing of the samples (Table 5). In addition, samples have a significantly darker colour after firing compared with their raw counterparts. Samples containing 1–5% Fe2O3 would acquire a light-brown colour after firing (Murray, Reference Murray2007). Colour changes to darker shades upon heating treatment due to the formation of hematite. The colour of the fired bodies depends on the Fe oxide content, and the limit of 3 wt.% of Fe2O3 has been found to be the value that separates light from dark firing bodies (Dondi et al., Reference Dondi, Raimondo and Zanelli2014).
Summary and conclusions
The clay samples from the Dobrodo deposit consist mainly of smectite, kaolinite/halloysite and illite. Quartz, feldspars, minor goethite and acicular rutile are present as non-clay minerals. The tested samples contained between 60.2 and 87.1 wt.% clay, between 10.9 and 26.1 wt.% silt and between 1.2 and 25.6 wt.% sand fractions. The sample colour ranges from greyish-yellow to moderately yellowish-brown, although after firing the colours become considerably darker. The clays are relatively rich in SiO2 and Al2O3, with SiO2/Al2O3 mass ratios ranging from 3.58 to 4.49 wt.% due to the presence of excess quartz in the samples. The Fe2O3, TiO2 and Na2O contents are increased in the uppermost layers of the deposit (sample 6) compared to the lowermost layers. The samples consist mostly of kaolinite flakes, tubular halloysite, minor illite and smectite. The CEC values of the samples vary between 12 and 52 mmol 100 g–1, while the SSA ranges from 94 to 410 m2 g–1. Regarding plasticity, samples 3 and 4 may be described as very plastic and moderately tough clays, sample 6 as a moderately plastic and highly tough clay and sample 5 as a moderately tough and low-plasticity clay.
The most suitable application of the clay from Dobrodo deposit is the manufacture of pottery. Further research and additional fieldwork should be extended to other areas of the Dobrodo deposit to explore clay-rich zones and to investigate the possibilities of the commercial applications of these raw clays.
Acknowledgements
The present study was supported by the Ministry of Education, Science and Technological Development of the Republic of Serbia, Project no. 176010. The authors acknowledge the SEM laboratory at the University of Belgrade, Faculty of Mining and Geology, Department of Mineralogy, Crystallography, Petrology, and Geochemistry.


