


 O
OINTRODUCTION
Aquatic animals occur in a wide range of sizes spanning some 12 orders of magnitude from the smallest metazoans (2 µg) to the blue whale weighing in excess of 100,000 kg. While each species has its own particular size-range and some aquatic phyla, such as Bryozoa, have a size-range of only two or three orders of mass, other invertebrate groups, such as the Crustacea and Mollusca, include species and individuals that are hugely variable in size (see Seibel, Reference Seibel2007). Within the Mollusca, the Gastropoda encompass a weight-range between <0.0001 g and about 18 kg for some trumpet shells (Yonge, Reference Yonge and Moore1960; Wilson et al., Reference Wilson, Wilson and Baker1994).
The scaling of metabolic rates as a function of body size has been of keen interest to scientists for decades (Kleiber, Reference Kleiber1932; Zeuthen, Reference Zeuthen1949; Hemmingson, Reference Hemmingson1960; Peters, Reference Peters1983; Schmidt-Neilsen, Reference Schmidt-Nielsen1984; Holker, Reference Holker2003). Recent work, and controversy, surrounding scaling laws and the potential role of universal scaling rules has brought this area of research to the forefront again (e.g. West et al., Reference West, Brown and Enquist1997, Reference West, Brown and Enquist1999, Reference West, Woodruff and Brown2002; Seibel, Reference Seibel2007). Scaling and scaling laws are now seeing an explosion of interest across biology (Niklas et al., Reference Niklas, Cobb and Spatz2009) and a reinvigorated debate about the validity of metabolic scaling laws as drivers of other allometric patterns (Ginzburg & Dalmuth, Reference Ginzburg and Dalmuth2008). This research has resulted in the new, and contested (e.g. O'Connor et al., Reference O'Connor, Kemp, Agosta, Hansen, Sieg, Wallace, McNair and Dunham2007; Martínez del Rio, Reference Martínez del Rio2008) metabolic theory of ecology (Brown et al., Reference Brown, Gillooly, Allen, Savage and West2004), including debate regarding its application to different types of organisms, especially endotherms (Anderson & Jetz, Reference Anderson and Jetz2005 and many others). Recent research by Glazier (Reference Glazier2005, Reference Glazier2006) and Seibel (Reference Seibel2007) in particular, has challenged the notion of a universal scaling law (3/4-power law), and especially its application in aquatic invertebrates. It is therefore timely to undertake a comprehensive analysis of metabolic scaling of metabolic rates within the Gastropoda, one of the largest groups of benthic marine invertebrates.
Gas exchange mechanisms are relatively well known in aquatic gastropods where the shell effectively reduces the available surface area for gas exchange. Some gastropods have no shell and may have specialized gills and lungs, and others use devices such as air bubbles (Lindberg & Ponder, Reference Lindberg and Ponder2001). Many gastropods effectively shut down in adverse conditions and have special physiological mechanisms, which allow them to tolerate hypoxic conditions. The relationship between oxygen uptake and body size (R = aW b where R = oxygen uptake, W = dry tissue body mass and b = weight exponent) has been described for numerous organisms, starting with the pioneering research by Zeuthen (Reference Zeuthen1949), who determined this relationship across a size-range both within a single species and between species of different adult sizes. This early research has been followed by others (e.g. Hemmingson, Reference Hemmingson1960; Phillipson, Reference Phillipson, Townsend and Callow1981; Peters, Reference Peters1983; Schmidt-Nielsen, Reference Schmidt-Nielsen1984; Elgar & Harvey, Reference Elgar and Harvey1987; Sims, Reference Sims1996; Gillooly et al., Reference Gillooly, Brown, West, Savage and Charnov2001; Dolnik, Reference Dolnik2002; Savage et al., Reference Savage, Gillooly, Woodruff, West, Allen, Enquist and Brown2004). Values for the weight exponent, b, generally range between 0.6 and 0.8 and similar values have been found for tissue slices and homogenates (Newell & Pye, Reference Newell and Pye1971 and others).
Size affects all bodily functions and scaling describes the structural and functional consequences of body size (Schmidt-Nielsen, Reference Schmidt-Nielsen1984) and allometric analysis is widely used in both ecology and physiology (Kemp & Bertness, Reference Kemp and Bertness1984; Peters et al., Reference Peters, Cabana, Choulik, Cohen, Griesbach and McCanny1996; Gillooly et al., Reference Gillooly, Brown, West, Savage and Charnov2001; Lindstedt & Schaeffer, Reference Lindstedt and Schaeffer2002). For oxygen uptake, the mass exponent, b, will have a characteristic value, close to 1.0 if oxygen uptake increases directly in proportion to body mass. The value of b, is however, usually less than this and within many taxa the b value for basal metabolic rate is 0.75 (Newell, Reference Newell1979; Withers, Reference Withers1992; Wilmer et al., Reference Wilmer, Stone and Johnston2005).
The scaling of metabolism has been intensively studied because the metabolic rate can affect food intake, excretion, growth and many other physiological functions. In allometric studies it is important to minimize variation in oxygen uptake due to internal factors, activity, nutritional level and external factors such as temperature, salinity or oxygen tension (Dickens & Neil, Reference Dickens and Neil1964; Kinne, Reference Kinne and Kinne1970; Newell, Reference Newell1979; Bridges & Butler, Reference Bridges and Butler1989). The many different approaches and experimental designs have meant that it has not been possible to extract existing oxygen data for a comparative study of gastropods from the literature (see Glazier, Reference Glazier2006). The Gastropoda, the largest class of the Mollusca, provide an opportunity for exploring the relative roles of morphology, physiology and mode of life on the basic metabolic rate of benthic organisms.
Metabolic rates of invertebrates will depend on activity levels and respiratory structures and not all aquatic organisms are expected to be able to regulate their oxygen uptake in response to changes in partial pressures of oxygen (Wood & Lenfant, Reference Wood and Lenfant1979). While aquatic animals are usually described either as oxyconformers or oxyregulators, many species appear intermediate between the two extremes and the response patterns contain elements of both. Responses to declining oxygen may depend on body size, mass and body shape and whilst most gastropods have a hard shell, this may be reduced or absent in more derived gastropods. The quantity of respiratory tissue, the morphology of respiratory structures, respiratory pigments and the ability for anaerobic respiration could also determine the responses to lowered oxygen levels. Mangum & van Winkle (Reference Mangum and van Winkle1973) investigated the relationship between the rate of oxygen uptake and declining oxygen availability in a variety of invertebrates. They showed that this relationship followed a quadratic model and where the quadratic coefficient B2 is negative, it indicated a regulatory response. Our research tested whether benthic gastropods were able to regulate their oxygen uptake in the presence of declining oxygen conditions and whether this relationship followed the Magnum & van Winkle (1973) model.
In recent years there have been few comparative metabolic studies on aquatic invertebrates and most measurements on oxygen consumption have been undertaken on single or a few species, and often do not use the full size-range of animals within a species or group. New textbooks continue to refer to classic studies undertaken in the 1930s. Since this time the basic techniques have remained much the same and the results from older studies remain valuable today. Because trends in comparative physiology have changed, and such large studies may not be done in the future, we felt that a data set collected in 1977 by one of us (S.E.S.) was an excellent opportunity for further analysis. The aims of the original study were to compare the resting oxygen uptake in 32 species of British gastropods using as large a size-range as possible for each species. These were all measured using closed chamber respirometry in standard seawater at 10°C. In addition, the responses of each species to declining oxygen levels were recorded to examine if the response was similar in different species given their quite different sizes, habitats and modes of living. These data were collected by a single investigator using the same techniques and are therefore directly comparable. Examination of these data will allow us to explore evolutionary and phylogenetically determined patterns of scaling in aquatic gastropods. Because the habitats and biology of many of the species are well known, it is also possible to test whether animals with different lifestyle strategies, and in particular trophic modes (grazers, herbivores and carnivores) differ in their metabolic allometric relationships.
MATERIALS AND METHODS
Study species
The 32 species of gastropods were collected between January and April 1977 from five locations in the British Isles (Table 1) and included a representative size-range of common species from different habitats, depth-range and feeding type. The traditional classification system of the gastropods into Prosobranchia, Opisthobranchia and Pulmonata is no longer accepted. Recent phylogenetic work based on morphology, ultrastructure, and life history and developmental characteristics (Ponder & Lindberg, Reference Ponder and Lindberg1997) as well as recent molecular work (synthesized in Ponder & Lindberg, Reference Ponder and Lindberg2008), appears to have reached a consensus on the phylogenetic relationships among the gastropods. Two groups were separated, the Eogastropoda (patellogastropods and their ancestors), which are usually considered basal, with a true limpet form, and the Orthogastropoda, which includes the rest of the gastropods; these have a hypobranchial gland, a propodium, anterior pedal gland, paired jaws and reduction of the pallial nerves. The success of the Orthogastropoda is attributed in large part to the evolution of a flexoglossate radula with a longitudinal bending plane and specialized teeth. Although many groups show an evolutionary trend toward reduced tooth number (e.g. Littorinidae), in many groups the marginal teeth in particular are modified to form a variety of tools which have been adopted for new functions such as shearing, sweeping, stabbing and harpooning (Guralnick & Smith, Reference Guralnick and Smith1999). The species selected for the study were mostly caenogastropods (which comprise 60% of all gastropods) with representative asiphonate and siphonate species, including whelks (Table 4).
Table 1. Species names; C, code number for analyses; Feeding type; Depth; Habitat; L, collecting locations: A, Anglesey; D, Dundee; I, Irish sea; P, Plymouth; O, Oban. Information from Bruce et al. (Reference Bruce, Coleman and Jones1963); Eales (Reference Eales1967); Fretter & Graham (Reference Fretter and Graham1962); Gosner (Reference Gosner1971); Morton (Reference Morton1979); Howson & Picton Reference Howson and Picton1997; ETI, macrobenthos of the North Sea and own information. Tidal levels abbreviations as in Lewis (Reference Lewis1961), from extreme high water springs (EHWS) to extreme low water springs (ELWS).

Experimental procedures
HOLDING CONDITIONS
Molluscs were held in running seawater aquaria at the Marine Sciences Laboratory, Menai Bridge University of Wales at 10 ± 0.1°C and a salinity of 32 psu for at least 2 weeks prior to experimentation and were not fed during this acclimation period.
OXYGEN UPTAKE
The standard (resting) metabolic rate was measured for between nine and 25 individuals of each species using closed chamber techniques at an exposure temperature of 10°C (Crisp et al., Reference Crisp, Davenport and Shumway1978; Shumway, Reference Shumway1981). The volume of the chamber depended upon mollusc size and ranged from 30 ml to 2 l. The gastropods were allowed to settle within a flow through system. It was then closed off and oxygen concentration measured continuously over a 2 hour period using a radiometer electrode and a chart recorder. The controls were the same vessels without snails measured at the same time as the other recordings. At the end of the experiment the tissue dry weights (dried at 60°C for three days) were determined for each individual and the rate of oxygen consumption calculated as
![]() O2 per hour.
O2 per hour.
O2 UPTAKE IN RESPONSE TO DECLINING OXYGEN TENSION
The same experimental chambers used for the oxygen uptake experiments were used to measure the effects of declining oxygen tension (Shumway, Reference Shumway1981). Measurements were made on up to 11 individuals from each species across a representative size-range.
Weight-specific oxygen consumption (ml O2 g−1 dry weight hr−1) for each individual was plotted against values of oxygen tension. The responses of individual species were compared by the method described in Mangum & Van Winkle (1973), using a polynomial equation. To allow the curves from individuals of different weight to be compared, the reduction in oxygen consumption was calculated relative to the rate in fully saturated oxygen conditions.
Data handing and analysis
The relationship between log
![]() O2 and log dry tissue mass for each species was investigated using regression analyses, using ordinary least squares (OLS) and standard major axis (SMA) analyses. Both methods were included because OLS has been the usual method of analysing data in this type of research and allows comparison with previous research and SMA is the accepted procedure used in more recent research on biological scaling. Equations describing the relationship were computed for each species and the slopes of the regression lines were tested for homogeneity following the methodology described in Sokal & Rohlf (Reference Sokal and Rohlf1981) using the statistical package Statistica 7. The slopes of the lines were also compared to the 0.75 scaling exponent proposed for ectothermic organisms. Appropriate post-hoc tests were used to identify cases that were significantly different.
O2 and log dry tissue mass for each species was investigated using regression analyses, using ordinary least squares (OLS) and standard major axis (SMA) analyses. Both methods were included because OLS has been the usual method of analysing data in this type of research and allows comparison with previous research and SMA is the accepted procedure used in more recent research on biological scaling. Equations describing the relationship were computed for each species and the slopes of the regression lines were tested for homogeneity following the methodology described in Sokal & Rohlf (Reference Sokal and Rohlf1981) using the statistical package Statistica 7. The slopes of the lines were also compared to the 0.75 scaling exponent proposed for ectothermic organisms. Appropriate post-hoc tests were used to identify cases that were significantly different.
To compare oxygen uptake between groups, the elevations of the OLS regression lines were compared using analysis of covariance (ANCOVA) to test the effects of taxonomic group, feeding type and water depth on the metabolism and size relationships (Snedecor & Cochran, Reference Snedecor and Cochran1989). There is no generally accepted equivalent to ANCOVA for analysis using SMA regression.
Mean values were calculated to examine the effects of declining oxygen tension on oxygen consumption. The responses for the different gastropods were compared by plotting oxygen uptake as a proportion of the value in fully saturated oxygen conditions. The relationship between oxygen uptake and reduced oxygen tension was investigated by examining the relative fit of linear, log and first order polynomial equations to the data. All statistical comparisons were done using Statistica 7.
RESULTS
Effects of body size
For the 29 molluscan species investigated there was a significant increase in resting oxygen uptake with increased body mass (Table 2) following the equation
![]() O2 = aW
b
, where a is the intercept and b is the slope or scaling exponent. The combined results (Figure 1) define the general relationship for gastropods
O2 = aW
b
, where a is the intercept and b is the slope or scaling exponent. The combined results (Figure 1) define the general relationship for gastropods
![]() O2 = 0.1305W0.58 (r = 0.92, N = 488 (OLS), and
O2 = 0.1305W0.58 (r = 0.92, N = 488 (OLS), and
![]() O2 = 0.158W0.62 (r = 0.94, N = 488 (SMA)), spanning six orders of magnitude of body mass, but where the majority of gastropods ranged between 0.01 and 1 gm dry weight. The value of the slope 0.6 calculated using the two methods of regression analysis was similar and was significantly lower than the universal scaling exponent of 0.75 (F = 151.93, P < 0.001).
O2 = 0.158W0.62 (r = 0.94, N = 488 (SMA)), spanning six orders of magnitude of body mass, but where the majority of gastropods ranged between 0.01 and 1 gm dry weight. The value of the slope 0.6 calculated using the two methods of regression analysis was similar and was significantly lower than the universal scaling exponent of 0.75 (F = 151.93, P < 0.001).
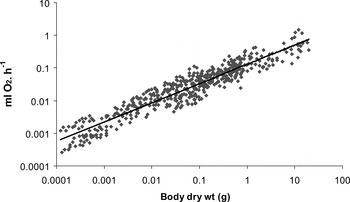
Fig. 1. Oxygen uptake (ml O2. h−1) plotted against dry body mass (W) for the complete gastropod data set (N = 488)
![]() O2 = 0.1304W 0.59 where r = 0.94 (P < 0.001) using OLS and 0.158W0.62 using standard major axis regression.
O2 = 0.1304W 0.59 where r = 0.94 (P < 0.001) using OLS and 0.158W0.62 using standard major axis regression.
Table 2. Regression statistics using ordinary least squares (OLS) and standard major axis (SMA) relating
![]() O2 .h−1 to body dry mass in 29 species of British gastropods; N, number of points; a, regression constant or intercept; b, scaling exponent; r, correlation coefficient. All the regression lines are significant P < 0.05.
O2 .h−1 to body dry mass in 29 species of British gastropods; N, number of points; a, regression constant or intercept; b, scaling exponent; r, correlation coefficient. All the regression lines are significant P < 0.05.

The OLS comparison of the slopes of the regression lines indicated that one species had a higher slope value than the others, Neptunea antiqua (b =1.05) and was responsible for the significant differences between slopes for the combined species (ANCOVA F = 1.90, df = 28:430, P = 0.004). When this species was removed from the OLS analysis, the slopes for the different gastropod species were similar (ANCOVA F = 1.48, df = 27:415, P = >0.05). Using the SMA analyses for individual species, as expected, the calculated slope value was higher than that found for the OLS method (Table 2).
When grouped by taxon (Figure 2; Table 3), most of species within each major grouping exhibited slope values that were similar (OLS and SMA) and these values were significantly less than 0.75 (SMA). The OLS analysis highlighted two groups (hypogastropods and neogastropods) within which individual species had significantly different slope values. There was considerable variation in the amount of oxygen consumed between species and significant differences in the intercept values within all of the major taxonomic groupings. Oxygen uptake was similar for the five neogastropod species, three limpets, and two rissoaceans (Table 4). The level of oxygen uptake in whelks, topshells and limpets was higher than slugs (Figure 3).

Fig. 2. Comparison of respiration rates (ml O2. . h−1) in different gastropod species. (A) Patellogastropoda (limpets); (B) Vestigastropoda (slit limpets, topshells); (C) Caenogastropoda–asiphonate group; (D) Caenogastropoda–siphonate group; (E) Heterobranchia (slugs). The ordinary least squares and standard major axis regression information for each species is included in Table 2 and the comparisons of the regression lines (analysis of covariance) within and amongst groups included in Tables 3 & 4.
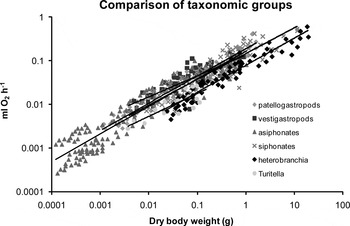
Fig. 3. Effects of body size on the oxygen consumption in different taxonomic groups of gastropods. The ordinary least squares (OLS) mass exponent b is 0.62 for patellogastropods, 0.48 for vestigastropods, 0.63 for asiphonates, 0.59 for siphonates, 0.62 for heterobranchia and 0.52 for Turitella. All of the OLS regression lines were significant P < 0.05. Comparisons of the regression lines (analysis of covariance) within and amongst groups included in Tables 3 & 4.
Table 3. Analysis of covariance ordinary least squares comparison of the mass exponent (slopes of regression lines) of different taxonomic groupings. N, the number of species per group; F statistic; df, degrees of freedom; P, probability; NS, non-significant.

Table 4. Analysis of covariance comparing the intercept values of regression lines calculated by ordinary least squares relating
![]() O2 to dry tissue mass (g) of 28 species of British gastropods (Neptunea removed) according to taxonomic group. N, the number of species included in taxonomic group; F statistic (elevation); df, degrees of freedom; P, probability; SG, number of species groupings; HGp, results of Tuckey post-hoc tests for species that are grouped together; numbers in parentheses are the code numbers for species in the same group.
O2 to dry tissue mass (g) of 28 species of British gastropods (Neptunea removed) according to taxonomic group. N, the number of species included in taxonomic group; F statistic (elevation); df, degrees of freedom; P, probability; SG, number of species groupings; HGp, results of Tuckey post-hoc tests for species that are grouped together; numbers in parentheses are the code numbers for species in the same group.

Mass-specific respiration
Although the pattern of mass-specific respiration across taxa was somewhat variable with body size, consistent with some other studies, the highest mass-specific respiration rates were recorded in the smallest littorinid species, Melarhaphe neritoides and the lowest rates in the larger species including the whelk Buccinum undatum and the nudibranch, Tritonia hombergii. Some species, notably the sea slug Archidoris pseudoargus, and topshells, Osilinus linealis and Gibbula umbilicalis appear to have higher rates than expected from their average weight values.
Effect of feeding types and habitat depth
While the relationship between body size and oxygen uptake was similar for all feeding types (OLS, Fslope = 2.13, df = 3:463, P > 0.05), there were differences in the intercept values, and therefore the level of oxygen uptake consumed (Figure 4A). Fifteen non-predators were represented which were further divided into macroalgal feeders and small particle feeders (microalgal feeders, detritivores and microbial feeders). Feeding type significantly influenced the amount of oxygen consumption (Table 5) and herbivores had higher oxygen uptake than all other groups (Felevation predators = 36.8; Felevation detritivores = 75.6; Felevation suspension feeder = 23.8). It follows that the weight-specific respiration for herbivores was on average 30% higher than that of microbial detritivores.

Fig. 4. (A) Effects of trophic mode and (B) habitat (water depth) on size-related respiration in gastropods. All of the regressions were significant P < 0.05 and the mass exponents (ordinary least squares) are shown next to the legends. Comparisons of the regression lines (analysis of covariance) within and amongst groups are included in Table 5.
Table 5. Analysis of covariance comparing the intercept values (elevation) of regression lines (ordinary least squares) relating
![]() O2 to dry tissue mass (g) of 28 species of British gastropods (Neptunea removed) according to their feeding type. N, the number of species included in the feeding type; F statistic; df, degrees of freedom; P, probability; SG, number of species groupings; PHT, results of Tuckey post-hoc tests for species that are grouped together; numbers in parentheses are the code numbers for species in the same group; OL, overlapping species groups; diff, indicating species that are different.
O2 to dry tissue mass (g) of 28 species of British gastropods (Neptunea removed) according to their feeding type. N, the number of species included in the feeding type; F statistic; df, degrees of freedom; P, probability; SG, number of species groupings; PHT, results of Tuckey post-hoc tests for species that are grouped together; numbers in parentheses are the code numbers for species in the same group; OL, overlapping species groups; diff, indicating species that are different.

The effect of habitat depth on the oxygen uptake was assessed by grouping the species into those that were intertidal zone only (6 species), those that were from subtidal habitats only (2 species) and the remaining 20 species that have been recorded from both intertidal and subtidal habitats. The slope, b, for the intertidal only species (b = 0.51; Figure 4B) was significantly shallower than the other two groups (b values = 0.63 and 0.95; F slope = 27.6, df = 2:467, P < 0.001).
Declining O2
None of the gastropods were able to regulate fully their aerobic metabolism in response to declining oxygen pressures, and oxygen consumption was reduced in response to reductions in oxygen partial pressures. The mass-specific respiration rate curves of gastropods (Figure 5) varied in shape amongst individual species. Some species appeared to show limited regulatory ability, especially at the highest oxygen partial pressures.

Fig. 5. (A & B) Oxygen uptake of gastropods in response to declining oxygen conditions. Each trace is for an individual gastropod with the species arranged in alphabetical order.
By combining the data from the 28 species tested, the general response to declining oxygen conditions followed the linear equation:
 $$\eqalign{&\hbox{Relative } \dot{\hbox{V}}\hbox{O}_2 = 0.164 + 0.00831\, \hbox{Oxygen saturation}\cr &\lpar \hbox{r} = 0.91\comma \; \hbox{N} = 1940\comma \; P \lt 0.001\rpar }$$
For the majority of gastropods, the predicted rate of oxygen consumption following exposure to 30% and 90% O2 saturation would be 0.42 and 0.92 of the rate in fully saturated oxygen conditions. The average values for relative weight-specific respiration plotted against partial pressure of oxygen for each species (Figure 6) decreased regularly with reductions in partial pressure of oxygen and there appeared to be no consistent differences related to taxonomic group.

Fig. 6. Comparison of the effects of declining oxygen tension on the oxygen uptake of gastropods from different taxa. The code numbers refer to the species listed in Table 6 and the bars show the standard error. For the Heterobranchia results were from a single individual (species codes 2, 13 and 29).
Although there was good fit for the linear relationships, most of the data also significantly fitted the second order polynomial equation (Table 6). The constant B2 values (Mangum & van Winkle, Reference Mangum and van Winkle1973) ranged from –0.05 in Calliostoma zizyphinum to +0.06 in Rissoa parva and Crepidula fornicata. The species that deviated most from the predicted curvilinear relationship was Calliostoma zizyphinum (SN7) and nine other species shared a B2 value of –0.2. Most of the B2 values were close to zero with 11 species having positive values = or > 0.3. A topshell, Calliostoma zizyphinum, identified by its high B2 constant was able to regulate its oxygen consumption at partial pressures between 80 and 50% oxygen saturation, maintaining oxygen uptake at approximately 70% of that in fully oxygen saturated conditions. The B2 values did not correspond to particular habitat groupings or body size.
Table 6. Correlation coefficients (r) for linear and quadratic equations and regression constant B2 ( × 103) of quadratic equation relating
![]() O2 g−1 h−1 to declining oxygen tensions for 32 species of British gastropods. C, code number of species used in analysis; N, number of individuals.
O2 g−1 h−1 to declining oxygen tensions for 32 species of British gastropods. C, code number of species used in analysis; N, number of individuals.

When the species were grouped by average weight (<0.01 g, <0.1 g, <1 g and >1 g), differences were found in the slopes of the regression lines. The smallest weight group had an almost direct relationship with partial pressure throughout the saturation range with the extrapolated regression line passing through the x axis at a value close to zero. Calculations from the regression equations confirm that, when exposed to oxygen partial pressures of 20%, individuals in the smallest weight group respire at approximately 25% of their values in 100% saturated conditions (Figure 7), contrasting with larger weight species (<0.1 g to 1 g) where the rates were approximately 35% of the maximal value.

Fig. 7. Mass-specific respiration rates (calculated from ordinary least squares regressions for the average weight of gastropod for each species) arranged with the smallest species at the bottom of the figure.
DISCUSSION
Not surprisingly, the resting rate of metabolism for gastropods was related to body mass. This relationship has been confirmed for most animals including ectotherms and endotherms. While many studies have attempted to explain differences in the scaling of the metabolic rate according to levels of activity, more recent studies stress the importance of a combination of both internal and external factors (Suarez et al., Reference Suarez, Darveau and Childress2004; Glazier, Reference Glazier2006). This study has confirmed that the effects of body size on the oxygen uptake of gastropod molluscs and their responses to declining oxygen are quite similar and conserved across species; however, there is variation, which can be explained within a phylogenetic, evolutionary and habitat framework. These results are not affected by the new taxonomic classification of gastropods and results are robust among lower and higher levels of classification.
Allometric relationships
Aerobic metabolism depends both upon how oxygen passes into the body and on the diffusion limits of oxygen uptake (Hughes, Reference Hughes1963). In this study, the value of 0.6 (which has high degree of certainty) determined for the mass exponent in gastropods is low compared with some molluscs, other invertebrates and lower vertebrates (Nakaya et al., Reference Nakaya, Saito and Motokawa2003). Scaling values close to 0.75 (the universal scaling factor: Hochachka, Reference Hochachka2002) have been recorded for some molluscs ranging in size from about 1µg to more than a kilogram (Glazier, 2005, Reference Glazier2006). These values include the scaling value for aquatic respiration in oysters (Shumway, Reference Shumway1982; Bougrier et al., Reference Bougrier, Geairon, Deslouspaol, Bacher and Jonquieres1995; Haure et al., Reference Haure, Penisson, Bougrier and Baud1998), whelks (Bayne & Scullard, Reference Bayne and Scullard1978), limpets (Davies, Reference Davies1966; Branch & Newell, Reference Branch and Newell1978), tropical gastropods (Lewis, Reference Lewis1971) and siphonariid limpets (Innes et al., Reference Innes, Marsden and Wong1984). The most important question raised by the present study is whether the recorded weight exponent (0.6) is low or is it the typical value for gastropods?
In this study, respiratory rates were recorded from inactive animals and are considered as normal, resting or routine rates of oxygen uptake. Individuals were stored for two weeks without food, which could lower the metabolic rate. If the starvation effects are size specific, the weight exponent may also change. Low weight exponents (0.34 to 0.55) have been found previously for aquatic gastropods, including littorinids (Toulmond, Reference Toulmond1967a, Reference Toulmondb; Newell & Roy, Reference Newell and Roy1973). In low shore limpets, Patella cochlear (Branch & Newell, Reference Branch and Newell1978), the b value was 0.66 and for the low shore Patella aspera it was 0.65 (Davies, Reference Davies1966). For marine pulmonates b values were 0.63 for the high shore species Behamina obliquata (Innes et al., Reference Innes, Marsden and Wong1984) and 0.43 for Amphibola crenata at 10°C (Shumway, Reference Shumway1981; Shumway & Marsden, Reference Shumway and Marsden1982). While many allometric studies have been based on few species and limited numbers of individuals of a narrow size-range (see critique in Glazier, Reference Glazier2005), the present study comprises a range of species of a wide size-range. The major finding from the present study is that a weight exponent of close to 0.6 is the rule for routine metabolism of marine gastropods.
Origins and evolution
Gastropods are found in numerous marine and freshwater habitats, and they have benthic as well as pelagic lifestyles. For all of the benthic gastropods studied here, oxygen uptake increased with increasing dry mass but the quantity of oxygen consumed at any particular weight varied between species. For closely related species however, the oxygen consumption was similar.
Gastropods have retained an ancestral creeping foot and are highly cephalized. With changes in the positioning and size of the mantle cavity the gastropods show evolutionary adaptations in their patterns of water circulation, and in the structure and the functioning of their respiratory structures (Ponder & Lindberg, Reference Ponder and Lindberg1997). It is therefore of interest to examine if more efficient mechanisms of oxygen uptake have resulted in increased aquatic oxygen uptake in more advanced gastropod groups.
The basal gastropods are the patellogastropods and vetigastropods, which commonly inhabit intertidal rocky reefs. Their size relationships with oxygen uptake are quite similar despite differences in the respiratory structures in the group. Most gastropods are caenogastropods where the gills have become monopectinate with the gill axis attached directly to the mantle wall. The littorinids which are typical of this group are found primarily in rocky habitats and the weight relationships with oxygen uptake are fairly similar amongst species. In siphonate caenogastropods, including the neogastropods, there are further anatomical advances of the respiratory system; however, these are not reflected in markedly increased respiratory rates. In the heterobranchs, one of the most derived gastropod groups, there is a loss or reduction of the mantle cavity and the development of the pulmonate lung. The present data set did not include any pulmonate gastropods, but literature values for selected species suggest that the weight exponents in pulmonates are similar to gastropods from this and other studies (see Innes et al., Reference Innes, Marsden and Wong1984 for other values).
Trophic mode
Gastropods exhibit all types of feeding modes including herbivory, carnivory, scavenging and suspension feeding, and the shape and size of the radula reflects the diet. Great diversity in feeding habits occurs in gastropod groups, especially in the caenogastropods and heterobranchs, and while such differences do not affect the weight exponent, b, of respiration, they could account for the higher metabolic rate recorded here for some species. Littorinids are grazers or herbivores and while some are generalist feeders, others have distinct preferences (Shumway et al., Reference Shumway, Lesser and Crisp1993) and some graze on macrophytes while others feed on microalgae. They are found in habitats where the food resources can be either abundant or scarce and nutritional values vary greatly. Branch & Newell (Reference Branch and Newell1978) investigated limpets from different shore levels and concluded that the metabolic strategies reflected food availability and accessibility rather than a direct relationship with tidal level. The particular energy strategy depended on a combination of factors including competition, which determined either an exploitative or a conservationist strategy. The differences in metabolic rates found amongst herbivorous gastropods in the present study might therefore be expected.
Predatory molluscs depend on specialized morphological adaptations and complex behavioural techniques, using a variety of strategies to capture food, depending on prey availability and access to the food resource. Rates of oxygen uptake varied amongst the predatory species investigated in this study, which identified two species, Cadlina laevis and Tritonia hombergii, which differed from the others. In terrestrial arthropods, sit and wait predators have a lower respiratory rate than more active predators (Lighton & Felden, Reference Lighton and Felden1995). Little is known about the energetic costs of finding food in gastropods although the predatory behaviour and prey selection has been widely investigated (Burrows & Hughes, Reference Burrows and Hughes1991; Morton, Reference Morton2006). Whelks require time to bore into the shells of hard-shelled prey (molluscan or crustacean prey including barnacles) and these gastropods require a flexible feeding strategy (Crisp, Reference Crisp1978). This may explain the similarity in the respiratory rates for whelks in the present study.
Crepidula fornicata was the only suspension feeding gastropod included in the study and the results for this species were similar to the other gastropods. Numerous studies have investigated the effects of body size on marine bivalves, but comparisons for respiration at temperatures close to 10°C suggest slope b values for bivalves usually lie within the range 0.71 and 0.84 for mussels, oysters and clams (Bayne et al., Reference Bayne, Thompson, Widdows and Bayne1976; Bricelj & Shumway, Reference Bricelj, Shumway and Shumway1991; Marsden, Reference Marsden1999).
Habitat—intertidal versus subtidal
Intertidal habitats are often considered as more extreme or stressful habitats than subtidal habitats, where organisms are less exposed to air, desiccation stress and extremes of temperature (Newell, Reference Newell1979). Many high intertidal zone gastropods feed on microalgae, are generally small and have morphological, physiological and behavioural mechanisms assisting survival. This may explain the low metabolic rates in such species, which can remain in an inactive state for long periods (Branch & Newell, Reference Branch and Newell1978).
In the mid and low tide, intertidal gastropod grazers also live on and amongst macrophytes and food resources for herbivores can be more abundant than at higher tidal levels. In subtidal habitats there may be an abundant food supply and herbivores are generalist feeders. There is often high interspecific competition, predation pressure is more intense and predators are more likely to be specialist feeders. In the present study the respiration rates of predators did not differ significantly from other feeding types perhaps illustrating the complex relationships between food choice, consumption, assimilation and growth.
Declining oxygen levels
Several theoretical models and mechanisms have been used to describe the responses of aquatic invertebrates to declining oxygen conditions (Mangum & van Winkle, Reference Mangum and van Winkle1973; Bayne et al., Reference Bayne, Thompson, Widdows and Bayne1976; Spicer & Stronberg, Reference Spicer and Stromberg2003; Alexander & McMahon, Reference Alexander and McMahon2004). In the present study, a linear model described quite accurately the responses of most gastropods. This model was rejected by Mangum & van Winkle (Reference Mangum and van Winkle1973), who investigated patterns in six invertebrate phyla, and concluded that the best fit was from a quadratic model:
Oxygen uptake = B0 + B1 + B2 X 2 where the value B2 if negative, indicated departure from a linear response and confirming a regulatory response.
In the present study and also in Mangum & van Winkle (Reference Mangum and van Winkle1973) the B2 values did not follow the ecological divisions of the habitat. They suggest however, that this might have been an oversight because few detailed measurements have been made in close association with animals' microhabitats. They indicated that the major patterns in B2 were phylogenetic; however, the molluscs were presented as a ‘mixed bunch’ with values ranging from –0.228 for the bivalve Modiolus demissus to #x002B; 0.0489 (Lunatia heros) and –0.1180 for Urosalpinx cinerea. In the present study only one of the gastropod species (Calliostoma zizyphinum) had a negative B2 coefficient suggesting some regulatory ability in its oxygen consumption with declining oxygen tension. This species is found on soft bottoms and so there is some evidence of habitat related adaptation. Species that occur in such habitats may have increased tolerances of hypoxia and this tolerance may not be related to body size (Holmes et al., Reference Holmes, Miller and Weber2002).
An alternative method for comparing the ability of animals to regulate oxygen consumption is to plot the ratio of PO2/
![]() O2 against PO2. Bayne (Reference Bayne1971a, Reference Bayneb) used the intercept value divided by the slope to give an index of respiratory independence. Newell et al. (Reference Newell, Johnston and Kofoed1977) found a high degree of respiratory independence in Crepidula fornicata at 16.2oC compared with temperatures above 20°C. These results, which differ from the present study, suggest that the response to declining partial pressures of oxygen can be altered by acclimation and also be related to the degree of hypoxia experienced in the natural environment. Newell (Reference Newell1979) suggested that tropical bivalves from high shore levels, where they experience low oxygen tension, were better able to regulate respiration than subtidal bivalves that rarely experience reduced oxygen availability. In the present study, there was some indication of regulation in several species, including Calliostoma and Hydrobia, which occur in estuaries. In general, the gastropods showed little ability to regulate and this suggests that they do not possess the physiological mechanisms (such as ventilatory compensations, heart rates or changes in extraction efficiencies) that occur in bivalves (Alexander & McMahon, Reference Alexander and McMahon2004).
O2 against PO2. Bayne (Reference Bayne1971a, Reference Bayneb) used the intercept value divided by the slope to give an index of respiratory independence. Newell et al. (Reference Newell, Johnston and Kofoed1977) found a high degree of respiratory independence in Crepidula fornicata at 16.2oC compared with temperatures above 20°C. These results, which differ from the present study, suggest that the response to declining partial pressures of oxygen can be altered by acclimation and also be related to the degree of hypoxia experienced in the natural environment. Newell (Reference Newell1979) suggested that tropical bivalves from high shore levels, where they experience low oxygen tension, were better able to regulate respiration than subtidal bivalves that rarely experience reduced oxygen availability. In the present study, there was some indication of regulation in several species, including Calliostoma and Hydrobia, which occur in estuaries. In general, the gastropods showed little ability to regulate and this suggests that they do not possess the physiological mechanisms (such as ventilatory compensations, heart rates or changes in extraction efficiencies) that occur in bivalves (Alexander & McMahon, Reference Alexander and McMahon2004).
In addition, size has been suggested as a factor that might affect the shape of the oxygen response based on diffusion limitation and surface area relationships (Crisp, personal communication). The theoretical basis of this argument suggests that small specimens may show a regular linear decline with reducing oxygen tensions, but that larger individuals show a more rapid decline at lower oxygen tensions. We found some evidence to support this notion in the present study where larger species were better able to regulate their oxygen uptake at relatively low partial pressures of oxygen.
Conclusions
The metabolic scaling coefficient for gastropods at rest (0.6) is more similar to the basal metabolism of mammals than it is to previous records from ectothermic invertebrates (0.75). Some species however, show higher b values and these characteristically occur in subtidal organisms. The research presented here suggests that the coefficient is similar between and within taxonomic groups and that this may be a very successful phylogenetic characteristic.
While in gastropods the metabolic scaling coefficient is similar in most groups, the mass-specific oxygen consumption rate varies widely between species. These differences are not easy to interpret without a detailed knowledge of the biology of individual species and their growth and energetic strategies. Apart from certain larger species, gastropods are generally unable to regulate their oxygen consumption in response to declining oxygen conditions. This most likely reflects the evolutionary history of the group where most of the species are found in well oxygenated clear waters. Those species that display better regulation are able to colonize soft substrates where they can utilize unexploited food resources.
Finally does size matter and is size really important in determining the metabolic patterns of gastropods? Our research clearly shows that the effects of size on the respiration of aquatic gastropods are predictable and that molluscs are able to compensate for increasing body size. This is probably due to morphological adaptations of the respiratory system and physiological adaptations allowing some gastropods to live in and on soft sediments. There has also been selection for a benthic lifestyle involving the interaction between morphological, physiological, behavioural, ecological and evolutionary factors.
Hochachka et al. (Reference Hochachka, Darveau, Andrews and Suarez2003) and Suarez et al. (Reference Suarez, Darveau and Childress2004) discuss an allometric cascade and the need to investigate the underlying assumptions of such models in mammals. We would like researchers to challenge some of the basic features regarding allometric relationships in aquatic molluscs. Pörtner (Reference Pörtner2002), in a comparison between squid and a sipunculid worm, points out that the survival strategies involve balancing the use of aerobic and anaerobic respiration. For cephalopods, Seibel (Reference Seibel2007) demonstrated wide variation in the slopes of the metabolic scaling curves and related these to water depth and locomotory capacity. These combined studies suggest that physiological adaptations, neural and endocrine processes, as well as external environmental factors act in combination to affect the mass exponent of basal metabolism.
Our research investigated the effects of body size on the routine or standard metabolic rate in benthic gastropod molluscs. We cannot predict what changes might occur in the active rate but we would expect different allometry for functions such as excretion, filtration rates, accumulation, or elimination rates for toxins. It is also known that numerous factors affect the metabolic rate of ectotherms and these include temperature, the time of the year, tidal level, respiratory medium, oxygen availability and internal factors such as starvation, sex, activity and nutritional condition (Crisp et al., Reference Crisp, Davenport and Shumway1978; Newell, Reference Newell1979; Angilletta & Dunham, Reference Angilletta and Dunham2003; Peck et al., Reference Peck, Buckley and Bengtson2005). If size affects any of the above variables, or if there are interactions between these environmental and internal variables, then we would expect changes in allometric scaling. Our gastropod data do not support the existence of a 0.75 universal scaling coefficient and we hope this provides the impetus for new research on this very old question.
ACKNOWLEDGEMENTS
This paper is dedicated to Dennis Crisp, Charlotte Magnum and Richard Newell, all of whom provided inspiration and guidance for this study, forging the way in invertebrate physiology. We would like to thank our colleagues at the University of Connecticut and elsewhere for sharing their thoughts on metabolic patterns in gastropods. We thank Helene Hegaret and Michael McCann for assisting with the data analysis. S.E.S. and D.K.P. would like to acknowledge support from NSF awards IOS 0920140 and IOS0920032. D.K.P. would also like to acknowledge the Helen Riaboff Whiteley Center at the Friday Harbor Laboratories. I.D.M. thanks the University of Canterbury for study leave which allowed time to undertake this study.


