


The global technically recoverable reserves of shale oil and shale gas are ~3.45 × 10¹¹ barrels and 7.795 × 1015 ft3, respectively (US Energy Information Administration, 2013). These reserves represent greater resources than other unconventional oil and gas reservoirs. However, wellbore instability (Laffer et al., Reference Laffer, Posner and Quirk1966; O'Brien & Chenevert, Reference O'Brien and Chenevert1973; Bol et al., Reference Bol, Wong, Davidson and Woodland1994) and reservoir damage (Jones, Reference Jones1964; Pittman & King, Reference Pittman and King1986; Wilson & Wilson, Reference Wilson and Wilson2014) caused by clay hydration and swelling make it more difficult to exploit shale oil resources, leading to significant economic losses. Therefore, inhibiting clay swelling is crucial to ensuring the smooth progress of drilling processes (Ren et al., Reference Ren, Zhai, Wu, Zhou, Qin and Wang2021).
An effective method to ensure wellbore stability is adding clay-swelling inhibitors to the drilling fluid (Zhang et al., Reference Zhang, Xu, Christidis and Zhou2020). Many efficient water-based drilling fluids with various compounds have been developed and applied with varying levels of success to control clay swelling (Villabona-Estupiñán et al., 2017; Ni et al., Reference Ni, Jiang, Li, Yang, Li, Wang and Deng2019). Since the 1960s, many high-molecular-weight amine compounds have been used as clay-swelling inhibitors, such as polyether amine, hyperbranched melamine and polyethylenimine (Zhang et al., Reference Zhang, Qiu and Huang2015; Tang et al., Reference Tang, Qiu, Zhong, Zhang and Zhang2016). With increasing drilling depth, the complexity of drilling formations is also increasing. Some researchers have begun to realize that the smaller the molecular weight of the treating agent, the better its water solubility (Jiang et al., Reference Jiang, Qi, An, Huang and Ren2016; Ahmed et al., Reference Ahmed, Kamal and Al-Harthi2019), and so the easier it is to control the rheological properties of the drilling fluid (Zhao et al., Reference Zhao, Qiu, Zhang, Zhong, Huang and Tang2017; Liu et al., Reference Liu, Zhang, Yan, Luo, Dong and Sun2021). Therefore, various small-molecule clay-swelling inhibitors have been synthesized by researchers. Among them, N1,N1'-(ethane-1,2-diyl)bis(N1-(2-aminoethyl)ethane-1,2-diamine) (NETS; Huang et al., Reference Huang, Xie, Luo, Deng and Wang2020), 2-({2-[bis(2-hydroxyethyl)amino]ethyl}(2-hydroxyethyl)amino)ethan-1-ol (Du et al., Reference Du, Wang, Chen, Zhang and Slaný2020) and 3,3-bis(2-aminoethyl)-1,5-pentanediamine (Xie et al., Reference Xie, Luo, Deng, Su, Wang and Gong2017), among others, have shown good clay-swelling inhibition in experimental studies and engineering applications. It is speculated that both the spatial and energy matching of the inhibitor molecular structure on the surface of the clay minerals are the main reasons for the ability of these agents to control clay swelling. However, the microscopic adsorption mechanism of this kind of treatment agent is unclear.
Molecular dynamics (MD) simulations can provide information regarding molecular structures and dynamics processes, allowing the detailed study of the interaction of research objects at the molecular level. This technology has proven to be a powerful tool for studying the molecular microstructures, interactions and dynamics of clay–water-treatment agent systems (Chávez-Páez et al., Reference Chávez-Páez, Van Workum, De Pablo and De Pablo2001; Frenkel & Smit, Reference Frenkel and Smit2001; Hensen et al., Reference Hensen, Tambach, Bliek and Smit2001). Camara et al. (Reference Camara, Liao, Xu, Zhang and Swai2019) found through MD simulation that poly(N-vinyl caprolactam) (PNVCL) had an excellent swelling-inhibitory ability for Na-montmorillonite (Mnt) by hindering the migration of interlayer particles, and these authors predicted the stability of PNVCL's response at high temperatures. Zhou et al. (Reference Zhou, Wang, Alcântara and Ding2022) found that sepiolite-adsorption capacities for gases decreased in the order SO2 > H2S > NH3, and the diffusion coefficients were affected by the number of gas/water molecules. Parameters such as diffusion coefficient and atomic residence time have been calculated by Peng et al. (Reference Peng, Wang, Qin, Luo, Min and Zhu2020), demonstrating that NH4+ remains for longer than Na+ on the hexagonal pores on the surface of Mnt, forming a more stable hydration layer under low-hydration conditions. The addition of amine compounds such as polyacrylamide reduced the mobility of Mnt interlayer particles (Zhang et al., Reference Zhang, Rivero and Choi2007, Reference Zhang, Li, Huang, Zhao and Zhang2022), and these compounds relied on electrostatic forces to adsorb onto the Mnt surface. Of these compounds cationic polyacrylamide showed the greatest adsorption level and bridging stability (i.e. the ability of compounds to adsorb between Mnt layers). In addition, other studies have shown that molecular simulations are beneficial in studies of the microscopic properties of alkylamines and alcohols intercalated within Mnt (Liu et al., Reference Liu, Lu, Wang, Zhou and Xu2007; Zhang et al., Reference Zhang, Mao and Jin2021). To our knowledge, the effects of temperature and molecular conformation on the adsorption properties of amine compounds on the Mnt surface have not been investigated previously. At present, most studies on the inhibition of Mnt hydration and swelling by small-amine molecules are still based on macro-experimental means (Theng et al., Reference Theng, Greenland and Quirk1967; Döring & Lagaly, Reference Döring and Lagaly1993), and the lack of micro-mechanism interpretations limits the development of high-performance water-based drilling fluids.
Understanding the interactions between amine molecules and Mnt is significant for developing highly effective clay-swelling inhibitors. Herein, the adsorption mechanism of NETS on the Mnt surface was studied for the first time using the MD method. Furthermore, the interaction mechanism between NETS and Mnt was investigated in detail, and the effects of molecular conformation, temperature and other factors on the adsorption capacity of NETS were determined. This work provides important insights into the adsorption performance of NETS on the Mnt surface.
Methods
Modelling
In this study, a 6 × 4 × 1 supercell of Mnt was constructed using GROMACS (Plimpton, Reference Plimpton1995) following Loewenstein's rule (Loewenstein, Reference Loewenstein1954). The Wyoming-type clay model proposed by Skipper (Reference Skipper1995) was adopted for the Mnt crystal cell. The structural formula of Mnt in the anhydrous state is Na0.75[Si7.75Al0.25][Al3.5Mg0.5]O20(OH)4. Due to isomorphous substitution (Rengasamy, Reference Rengasamy1975), the Mnt layer carried 18 negative charges. Therefore, 18 Na+ were added randomly into the system to maintain charge balance. Finally, 1429 water molecules and one NETS molecule were added into the system. The molecular weight of NETS is 232 (Fig. 1b), the size of the simulated system was 31.2 × 36.0 × 50.0 Å (Fig. 1c) and the NETS concentration was 0.9 wt.%.

Fig. 1. Molecular model for the Mnt–NETS system: (a) Mnt layer, (b) NETS and (c) Mnt–NETS system.
Force field
In the CLAYFF (Cygan et al., Reference Cygan, Liang and Kalinichev2004) force field, the total energy of the simulated system is defined by two categories. One type is bonded interactions, including bond stretching and bond angle-bending terms. The other type is non-bonding interactions and includes short-range interactions and long-range electrostatic interactions. The total system energy (E total; kJ mol–1) is depicted as in Equation 1:

where E bond stretch and E angle bend are the bond-stretch and angle-bend interaction energies, respectively (in kJ mol–1), and E Coulomb and E vdW are the short-range interactions and long-range electrostatic interactions, respectively (in kJ mol–1).
The expressions for bonded interactions are given in Equations 2 & 3:


where kr and ${\rm k}_{\rm \theta }$ are stress constants, r 0 and θ0 are equilibrium bond lengths and angles, respectively, and the subscripts i, j and k denote the different atoms i, j and k, respectively.
E Coulomb and E vdW among the non-bonded interactions are shown in Equations 4 & 5:


where ${\rm \varepsilon }_ 0$ is the permittivity (F m–1), e is the electronic charge, q is the atomic charge, ${\rm \varepsilon }$
 is the potential well depth (1 × 10–19 J) and σ is the atomic distance resulting when the potential energy takes its minimum value (nm). E vdW, which is represented by the Lennard‒Jones (LJ) function, can be used to express the potential energy for interactions between electrically neutral molecules or atoms (Autumn, Reference Autumn, Liang, Hsieh, Zesch, Chan and Kenny2000). The LJ potential is a potential function of the van der Waals (vdW) force.
The flexible SPC model (Mizan et al., Reference Mizan, Savage and Ziff1994; Cygan et al., Reference Cygan, Liang and Kalinichev2004) in the CLAYFF force field was adopted for water molecules. NETS was described using the OPLS-AA force field.
Simulation details
GROMACS was used to implement the entire MD simulation process. Visual MD (Humphrey et al., Reference Humphrey, Dalke and Schulten1996) was used to present the simulation process. First, energy minimization was performed to balance the interaction forces between atoms in the system as much as possible. Then, a 1 ns simulation under the NVT ensemble was simulated at 300 K to reach an equilibrium temperature. Finally, 1 and 10 ns NPT simulations were performed at 300 K and 1 bar to balance the pressure and to analyse the simulation results statistically. The same simulation conditions were used for the pure-water system. In addition, simulations were performed at temperatures of 350, 400, 450, 480, 500 and 520 K.
The Coulomb and vdW potentials were calculated using the particle-mesh Ewald method (Darden et al., Reference Darden, York and Pedersen1993) and the LJ potential, respectively. The cut-off distance was 12 Å and the time step was set to 1 fs. The temperature and pressure were controlled using a Nosé–Hoover thermostat (Nosé, Reference Nosé1984) and a Parrinello–Rahman barostat (Parrinello & Rahman, Reference Parrinello and Rahman1981) with relaxation times of 2 and 1 ps, respectively.
Results and discussion
Adsorption of NETS molecules
Atomic-density distribution of the system
The system's atomic-density distribution (Fig. 2) provides information on each atom's spatial distribution during the simulation. It was possible to observe whether NETS was adsorbed onto the Mnt surface. The distribution of water molecules on the outer surface of Mnt was the same as that described by Rotenberg et al. (Reference Rotenberg, Marry, Malikova and Turq2010) and constituted three layers of water molecules (Li et al., Reference Li, Chen, Song, Yuan, Zhang and Liu2020). This indicated that a stable hydration layer was formed on the outer surface of the Mnt and that the simulated system reached equilibrium. The negative charge of Mnt attracted Na+ to form an inner sphere complex adsorbed on the surface of the Mnt, resulting in a density peak for Na+. The density peaks of NETS indicated that NETS was attracted by Mnt and adsorbed stably onto the surface during the simulation.

Fig. 2. Atomic density distribution along the z-coordinate.
Diffusion coefficient
The diffusion coefficient (D, nm2 s–1) can measure the ability of particles to move. The D values of NETS in pure water and the Mnt system were calculated from the mean square displacement (MSD), as shown in Equation 6:

where |r(t) - r(0)|2 is the MSD of the centre of mass of the molecule (nm2) and t is the time of the simulation (s).
The diffusion coefficient (Fig. 3) of NETS in the pure-water system fluctuated widely, with an average value of 0.5806 × 10⁻³ nm2 s–1, while in the Mnt system it was stabilized at ~0.2075 × 10⁻³ nm2 s–1. In the simulated system presented here, the Mnt interlayer provided sufficient motion space for NETS without restricting the movement of NETS molecules. However, compared with the pure-water system, the diffusion coefficient of NETS was still decreased significantly. This was because NETS interacted strongly with Mnt, which marked it as being adsorbed and bound tightly on the surface of the Mnt.

Fig. 3. Diffusion coefficient (D) of NETS in pure water and the Mnt system.
Conformation and conformational analysis of NETS during adsorption
Conformational changes of NETS
The simulated trajectories indicate that the amine groups in NETS were adsorbed above the hexamer rings on the Mnt surface (Fig. 4) but did not fully occupy the central position. NETS formed two adsorption conformations on the Mnt surface. The conformation shown in Fig. 4a was planar adsorption and the conformation shown in Fig. 4b was cross-adsorption. In most cases, NETS was adsorbed on the Mnt surface in a plane state. When NETS rotated, it changed from the conformation shown in Fig. 4a to that shown in Fig. 4b. This phenomenon caused some amine groups to separate and move away from the Mnt surface during the simulation, reducing the adsorption strength of NETS.
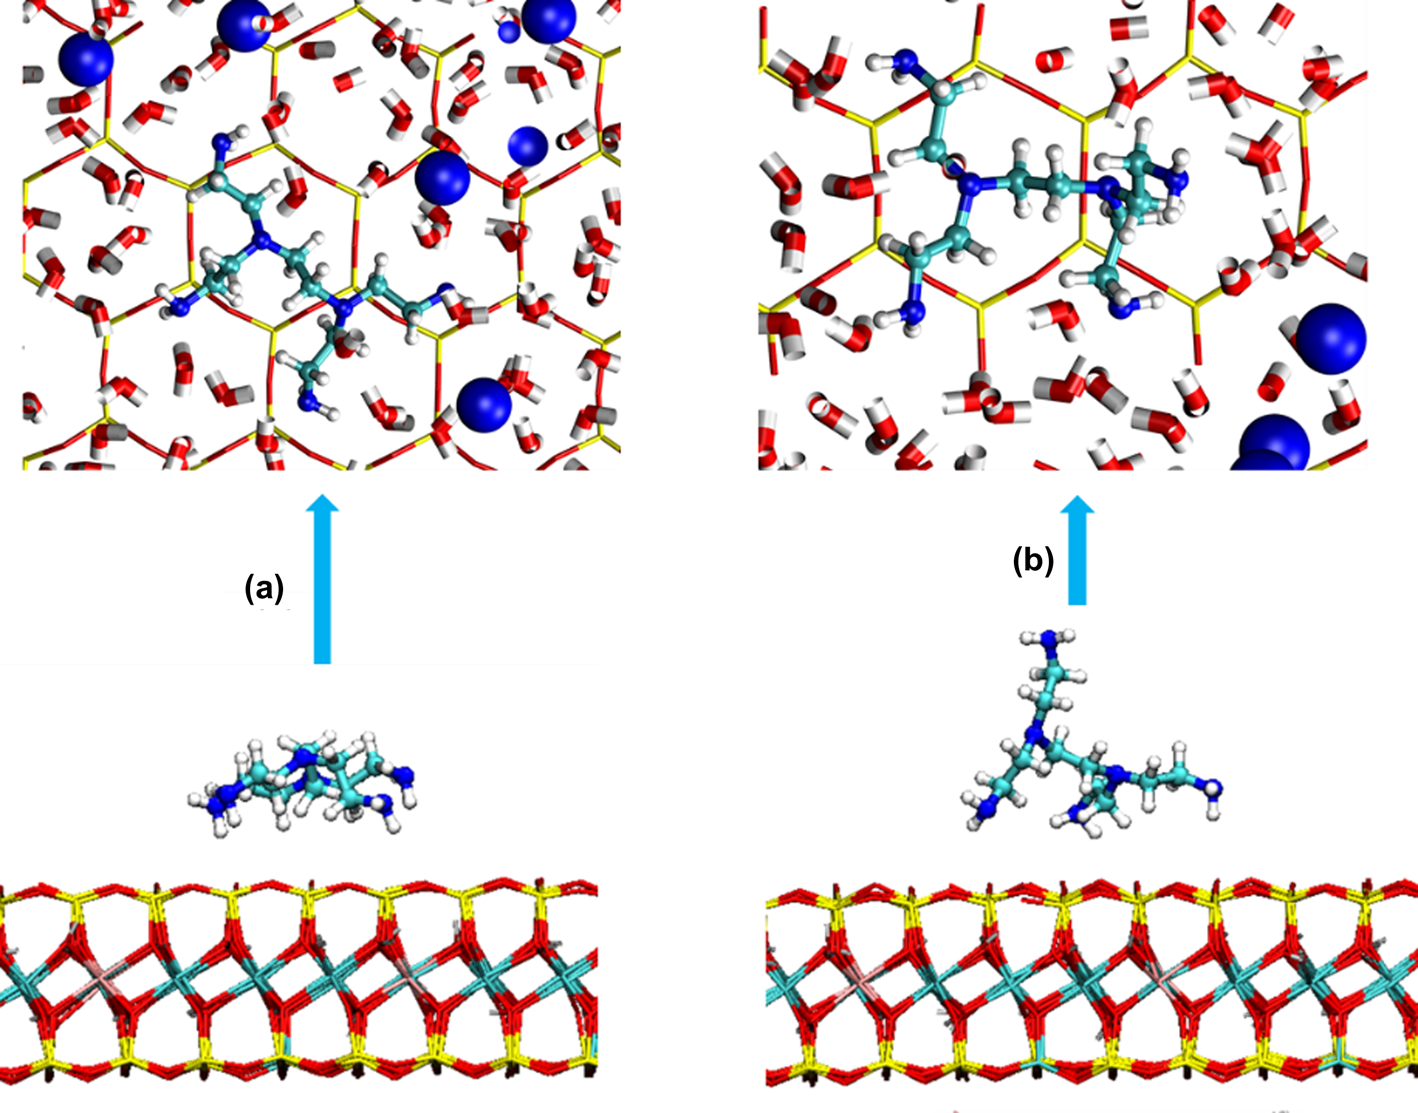
Fig. 4. Adsorption conformation of NETS on the surface of Mnt: (a) NETS planar conformation and (b) NETS cross-conformation.
The effect of molecular conformation on adsorption was further investigated regarding the NETS dihedral angle. The two N at the end of NETS and the two N on the main chain were defined as a dihedral angle N1–N2–N2`–N3 of NETS (Fig. 5b). The average dihedral angle for NETS in pure water remained at ~55°, while in the Mnt system the average dihedral angle of NETS remained at ~35°.

Fig. 5. Changes in the dihedral angles of NETS in various systems: (a) NETS simulation in pure water; (b) NETS cross-conformation and N1–N2–N2`–N3 dihedral angle diagram; and (c) variation trend for the moving average dihedral angle of NETS in pure water and the Mnt system.
The adsorption area of NETS on the Mnt surface can be calculated from the solvent-accessible surface area of the molecule. First, the radial distribution function (RDF) for N at the ends of NETS and O on the surface of Mnt was calculated. The minimum spacing (Fig. 6a) between NETS and Mnt was 0.3 nm. The probe radius was then set to half the minimum spacing. The solvent-accessible surface areas of Mnt, NETS and both together were calculated separately and noted as SA Mnt, SA NETS and SA M–N, respectively. Finally, the adsorption area S was then expressed as in Equation 7 (this calculation only represents the number of monolayer probes that can be accommodated between NETS and Mnt and does not represent the actual adsorption area):


Fig. 6. (a) The RDF for N at the end of NETS and oxygen on the surface of Mnt at 300 K. (b) Changes in adsorption area during NETS molecular simulations at 300 K. NOP = number of monolayer probes.
When S (Fig. 6b) was 0, NETS was free in the aqueous phase; when S was >0, NETS adsorbed onto the Mnt surface in a different conformation. NETS finally adsorbed stably on the Mnt surface in a planar state (the conformation shown in Fig. 4a) at 300 K.
Restrictive dynamics simulations were performed by limiting the dihedral angles of NETS to 10°, 30°, 60° and 90°. Other simulation details were consistent with those for the MD simulations. As the dihedral angle increased, the maximum adsorption area peak for NETS shifted to the left and decreased gradually. In addition, when NETS molecules were adsorbed on the surface of the Mnt due to a reliance on the two terminal amine groups (Fig. 7b), a peak for the adsorption area was also formed, and this peak increased with increasing dihedral angle. This result confirmed that NETS tends to adsorb on the Mnt surface in a planar state (the conformation shown in Fig. 4a). However, it can rotate around the central N–C–C–N chain during the simulation process, increasing the probability of lateral adsorption and reducing the total adsorption area and adsorption strength.
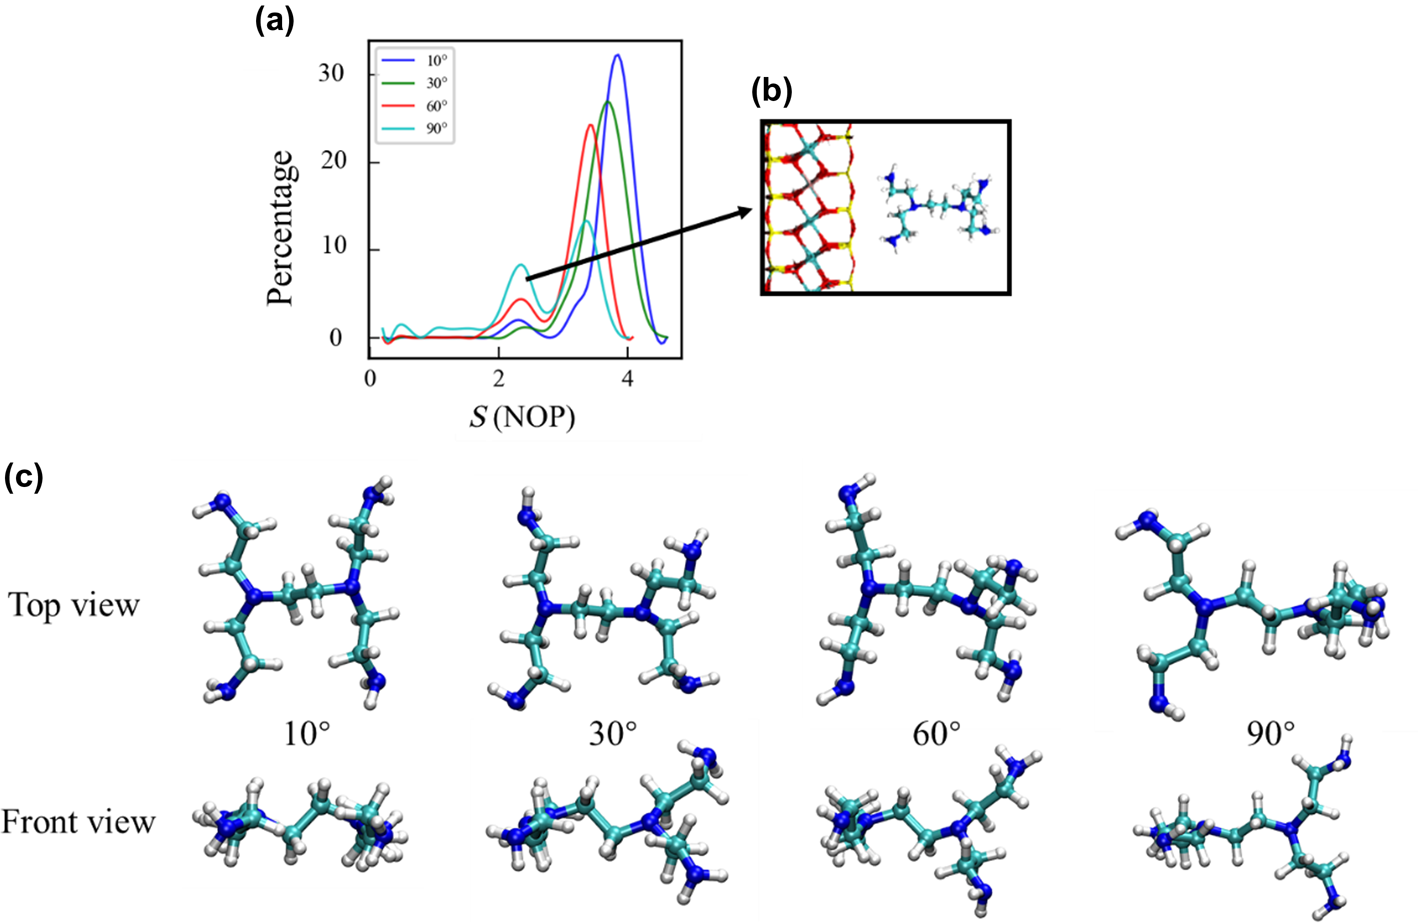
Fig. 7. (a) Changes in the NETS adsorption area at various angles. (b) NETS lateral adsorption status. (c) Top and front views of the adsorption configuration at various angles. NOP = number of monolayer probes.
Cation coordination adsorption
The RDF can reflect the distribution of other particles around the target particle. In this analysis, the water oxygen atom and NETS nitrogen atom are symbolized by Ow and N, respectively. The main peak location of Na+–Ow in water attributed to the first hydration shell appears at ~2.4 Å (Fig. 8). In addition, the main peaks of Na+–Ow and Na+–N in the Mnt were also located near 0.25 nm, indicating that NETS participates in the formation of the Na+ hydration layer.

Fig. 8. The RDF for Na+ and various atoms.
The RDF relationship between Na+ and NETS suggests that cations may affect the adsorption of NETS on the Mnt surface. Ten NETS molecules were added to the Mnt system, and simulations were performed under the same conditions to investigate further the effects of cations on the adsorption of NETS.
The abscissa of the coordination-number curve at 2.4 Å represents the Na+ coordination number (Fig. 9a). The average coordination number of Na+ in pure water is ~5 (coordination of cations with water molecules is due to the hydration of the ions, which are bound to each other by electrostatic interactions and form a hydration layer). However, when NETS was present, the coordination number of Na+ with Ow was ~3, and the coordination number with N was ~2. From this, it can be inferred that amine groups in the first hydration layer of Na+ replaced two water molecules. This close relationship of the amine groups and Na+ led to the formation of the Na+–NETS complex (Fig. 9b), and the adsorption stability of NETS was enhanced further by complexing Na+ ions and due to the reliance on the interaction force between Na+ and Mnt to enable adsorption onto the Mnt surface.

Fig. 9. (a) Coordination numbers between Na+ and various atoms. (b) Top view of binding by NETS and Na+ on the Mnt surface. (c) Front view of binding by NETS and Na+ on the Mnt surface.
Interaction energy
Mnt can form hydrogen bonds with NETS. The N–H⋅⋅⋅O hydrogen bond has a truncation radius of 3 Å and an angle of 150° (Dingley et al., Reference Dingley, Cordier and Grzesiek2001). At most, four hydrogen bonds were formed between Mnt and NETS, but only one to two hydrogen bonds (Fig. 10) existed stably, and with a maximum lifetime of 0.11 ns. With the rotation of the primary amine groups in NETS, hydrogen bonds were formed close to the Mnt surface and broken upon it moving far from the Mnt surface. Therefore, although the presence of hydrogen bonds promoted the adsorption of NETS, this was not the main driving force of NETS adsorption.

Fig. 10. Lifetimes of hydrogen bonds formed between NETS and Mnt.
The interaction energy between NETS and Mnt can be calculated in GROMACS software. The interaction energy reflects the strength of the interactions between two molecules. If the interaction energy is negative, this indicates that the whole process is spontaneous. If it is positive, then the opposite is the case (Rudin & Choi, Reference Rudin and Choi2012). The greater this value, the stronger the interaction between the two molecules. After the adsorption of NETS at 300 K, the LJ interaction energy stabilized at approximately –40 kJ mol–1, and the Coulomb interaction energy stabilized at approximately –60 kJ mol–1. A low interaction energy allows for the maintenance of only a small adsorption area, and the interaction energy increases linearly with increasing adsorption area (Fig. 11). This indicated that NETS relied on mainly the interaction energy to adsorb onto the Mnt surface.

Fig. 11. Relationships between the adsorption area of NETS and the interaction energy at 300 K (the ordinate is the absolute value of energy). (a) Relationship between the LJ interaction energy and the adsorption area. (b) Relationship between the Coulomb interaction energy and the adsorption area. NOP = number of monolayer probes.
Effect of temperature on the adsorption of NETS
Two peaks were seen for the adsorption area (Fig. 12) of NETS on the surface of Mnt at various temperatures. As the temperature increased, the maximum peak for the adsorption area decreased gradually, and the trend for the minor peak was the opposite of that for the maximum peak. The effect of temperature on the adsorption area of NETS was consistent broadly with the trend shown by the restrictive MD simulations described earlier. Therefore, it can be surmised that temperature affected adsorption mainly by promoting changes in the dihedral angles of the molecule itself. In addition, the maximum adsorption area decreased to a lesser value after the temperature was increased to 500 K, and it no longer decreased with further temperature increases. This shows that NETS has a good adsorption capacity at <500 K.

Fig. 12. Changes in the NETS adsorption area at various temperatures.
As the temperature increased, the peak in the energy curve (Fig. 13) for interactions between NETS and Mnt decreased gradually and the interaction energy weakened. Nevertheless, the trends for the LJ interaction energy and the Coulomb interaction energy with increased adsorption area were the same, indicating that the temperature increase did not change the effects of interaction energy on adsorption.

Fig. 13. Changes in the interaction energy between NETS and Mnt at various temperatures and the relationship with adsorption area. (a) Changes in LJ interaction energy; (b) changes in Coulomb interaction energy; (c) relationship between LJ interaction energy and adsorption area; and (d) relationship between Coulomb interaction energy and adsorption area.
Finally, the mean diffusion coefficients and dihedral angles of NETS were calculated for various temperatures. The diffusion coefficient and dihedral angle for NETS increased with increasing temperature (Fig. 14). When the temperature was <350 K, NETS adsorbed stably onto the surface of Mnt; when the temperature was >350 K and <450 K, the diffusion coefficient and dihedral angle increased gradually and desorption occurred; when the temperature was >450 K, the diffusion coefficient and dihedral angle increased further. The same trend was observed for the diffusion coefficient in the x–y direction. However, there is a lack of direct binding to Mnt in the x–y direction, so NETS exhibited a greater diffusion coefficient than that in the vertical direction. In summary, increasing temperature affected directly the change in molecular conformation and reduced the adsorption performance of NETS.

Fig. 14. Variations in the diffusion coefficients and dihedral angles of NETS at various temperatures. (a) Diffusion coefficient perpendicular to the surface of Mnt; (b) diffusion coefficient parallel to the surface of Mnt; and (c) changes in the N1–N2–N2`–N3 dihedral angle.
Conclusions
(1) The conformation of NETS had a significant influence on adsorption. NETS uses preferentially the terminal primary amine group and cationic coordination to adsorb onto the Mnt surface in a planar configuration. An increase in the dihedral angle pushes the amine groups away from the Mnt surface, which increases the probability of lateral adsorption, reduces the number of adsorption groups and reduces the adsorption strength.
(2) vdW and Coulomb potentials were the main driving forces of adsorption. Conformational changes made the hydrogen bonds more vulnerable to disruption, so hydrogen bonding promoted adsorption but was not the main driving force of adsorption.
(3) Increases in temperature weaken the adsorption strength of NETS. This was because the increases in temperature promoted conformational changes in NETS, which affected adsorption.
This work provided a new approach for studying the interactions of small-amine molecules with Mnt and for the molecular design of drilling-fluid inhibitors, which could help to improve the temperature resistance of wellbore drilling fluids. However, Mnt hydration also involves osmotic and surface hydration. Therefore, in addition to the interactions of treatment agents on the Mnt surface, the interfacial behaviours of amine inhibitors in Mnt interlayers require further investigation.
Financial support
This work was supported by the National Natural Science Foundation of China (51874343) and Shandong Provincial Key Laboratory of Oilfield Chemistry.
Conflicts of interest
The authors declare that they have no conflicts of interest.


