1. Introduction
Tourmaline is the principal boron-bearing mineral associated with S-type granites and pegmatites, and may contain important information pertaining to the petrogenesis of these rocks. The isotopic fractionation among the two isotopes of B (11B and 10B) in melt-fluid-crystal systems, reflected in the B-isotopic composition of tourmaline, is a powerful tool for constraining magmatic–metamorphic–hydrothermal processes (Henry & Guidotti, Reference Henry and Guidotti1985; Bebout et al. Reference Bebout, Ryan and Leeman1993, Reference Bebout, Ryan, Leeman and Bebout1999; Henry & Dutrow, Reference Henry, Dutrow, Grew and Anovitz1996; Shaw, Reference Shaw, Grew and Anovitz1996; Slack, Reference Slack, Grew and Anovitz1996; Jiang, Reference Jiang2001; Pesquera et al. Reference Pesquera, Torres-Ruiz, Gil-Crespo and Jiang2005; Marschall et al. Reference Marschall, Altherr and Rüpke2007; Pal et al. Reference Pal, Trumbull and Wiedenbeck2010; da Costa et al. Reference Da Costa, Mourão, Re´cio, Guimarães, Antunes, Ramos, Barriga, Palmer and Milton2014; Drivenes et al. Reference Drivenes, Larsen, Muller, Sorensen, Wiedenbeck and Raanes2015; Duchoslav et al. Reference Duchoslav, Marks, Drost, McCammon, Marschall, Wenzel and Markl2017). Boron isotope is also a good tracer to understand the sedimentary source, thus making it extremely efficient to reconstruct the parent source of the S-type granites (Swihart et al. Reference Swihart, Moore and Callis1986; Ishikawa & Nakamura, Reference Ishikawa and Nakamura1993). In the past few decades, the tourmalines in different granitic–pegmatitic rocks have been studied extensively and a plethora of different ideas have emerged about their formation in granitoid systems (Smith & Yardley, Reference Smith and Yardley1996; Trumbull & Chaussidon, Reference Trumbull and Chaussidon1999; Roda-Robles et al. Reference Roda-Robles, Pesquera, Gil, Torres-Ruiz and Fontan2004; Černý & Ercit, Reference Černý and Ercit2005; Maner & London, Reference Maner and London2017).
Tourmalines in S-type granitoids/pegmatites can preserve the record of the evolution of boron in a magmatic–hydrothermal system. Previous studies have documented contrasting results on the fractionation of B-isotope in tourmaline during the magmatic–hydrothermal processes. Some studies report strong fractionation of 11B and 10B between the tourmalines in granite and evolved pegmatites (Trumbull et al. Reference Trumbull, Beurlen, Wiedenbeck and Soares2013), whereas some report relatively small to no change at all (Tonarini et al. Reference Tonarini, Dini, Pezzotta and Leeman1998).
In this study, I investigate the chemistry and B-isotope composition of tourmalines in granitoid rocks from the Gangpur Schist Belt (GSB) in eastern India. These chemical and isotopic data for tourmaline in S-type granites and pegmatites associated with the metasediments are used to put constraints on petrological processes operating during magmatic to hydrothermal evolution of the granite–pegmatite system. The GSB rocks are ideally suited for this purpose as tourmaline is a ubiquitous phase in S-granitoids and related pegmatites, which indicates that the rocks have high boron content and may have been derived from B-rich sedimentary sources. The Gangpur Schist Belt has undergone polyphase deformation-metamorphism events (Chakraborty et al. Reference Chakraborty, Upadhyay, Ranjan, Pruseth and Nanda2019), which may have been responsible for several hydrothermal processes affecting the granitic body and leading to the formation of different pegmatite-forming veins. Because of its robust nature, tourmaline is expected to preserve some of the magmatic–hydrothermal history of the granite–pegmatite system.
2. Regional geology
The GSB is situated at the eastern end of the Central Indian Tectonic Zone, a Proterozoic suture along which the Northern Indian Blocks, comprising the Aravalli and Bundelkhand cratons, have amalgamated with the Southern Indian Block, comprising the Singhbhum, Bastar and Dharwar cratons, forming the Greater Indian Landmass (Yedekar et al. Reference Yedekar, Jain, Nair and Dutta1990; Jain et al. Reference Jain, Yedekar and Nair1991; Mishra et al. Reference Mishra, Singh, Tiwari, Gupta and Rao2000; Bhowmik et al. Reference Bhowmik, Sarbadhikari, Spiering and Raith2005). The GSB is sandwiched between the southern Archean Singhbhum Craton and northern Proterozoic Chhotanagpur Gneissic Complex (CGC). The GSB comprises amphibolites-facies pelitic and psammitic schists, quartzites, meta-carbonates, calc-silicate rocks, metavolcanic rocks and S-type granitoids/pegmatites (Chakraborty et al. Reference Chakraborty, Upadhyay, Ranjan, Pruseth and Nanda2019) (Fig. 1a–c). This belt can be subdivided into the southern Upper Bonai Group and northern Gangpur Group, which are separated by the Raghunathpalli deformed conglomerate horizon (Kanungo & Mahalik, Reference Kanungo and Mahalik1972; Chakraborty et al. Reference Chakraborty, Upadhyay, Ranjan, Pruseth and Nanda2019). The supracrustal rocks of the Upper Bonai Group underwent their first metamorphism (M1B) at 1556 ± 12 Ma (Chakraborty et al. Reference Chakraborty, Upadhyay, Ranjan, Pruseth and Nanda2019). This amphibolite facies event with the peak P-T conditions of c. 5.7 kbar and 624°C stabilized the assemblage Grt + St + Bt + Tur. The rocks were affected by a second upper amphibolite facies metamorphic event (M2B with peak P-T conditions of c. 8.3 kbar and 730°C) at 1446 ± 13 Ma. This event was coeval with the emplacement of S-type granites/pegmatites in the Upper Bonai Group. The Gangpur Group S-type granitoids were emplaced at 1648 ± 9 Ma (Chakraborty et al. Reference Chakraborty, Upadhyay, Ranjan, Pruseth and Nanda2019) and form the basement for the younger Gangpur Group meta-sediments. The metasediments underwent their first metamorphism (M1G with peak P-T values of c. 5 kbar and 528°C) along an anticlockwise P-T trajectory at 1445 ± 15 Ma synchronous with the M2B metamorphism of the Upper Bonai Group. This event led to the accretion of the Upper Bonai Group with the Gangpur Group of rocks (Chakraborty et al. Reference Chakraborty, Upadhyay, Ranjan, Pruseth and Nanda2019). The Gangpur Group rocks were subsequently affected by a pervasive Grenville-age (969 ± 4 Ma) upper amphibolite facies metamorphic overprint (M2G with peak P-T conditions of c. 4.7 kbar and 610°C) with a clockwise P-T path. The Upper Bonai rocks were largely unaffected by this Neoproterozoic event (Chakraborty et al. Reference Chakraborty, Upadhyay, Ranjan, Pruseth and Nanda2019). The geological evolution of the GSB has been explained through a three-stage collision–accretion model in which the Upper Bonai Group is thought to have amalgamated with the Singhbhum Craton during an Andean-type collision at c. 1.55 Ga forming the Singhbhum Craton–Dalma arc–Upper Bonai Group composite. The Gangpur Group was accreted to this crustal composite at c. 1.45 Ga. Finally, alpine type continent–continent collision at c. 0.96 Ga led to the amalgamation of the Singhbhum Craton–Upper Bonai Group–Gangpur Group crustal unit with the CGC. This final Neoproterozoic event is possibly synchronous with the intrusion of S-type pegmatites within the Gangpur Group granitoids (Chakraborty et al. Reference Chakraborty, Upadhyay, Ranjan, Pruseth and Nanda2019). The geological history of the GSB is therefore similar to that of the North Singhbhum Mobile Belt, and the two units are the western and eastern segments, respectively, of the same orogenic belt (Chakraborty et al. Reference Chakraborty, Upadhyay, Ranjan, Pruseth and Nanda2019). Bhattacharyaa et al. (Reference Bhattacharyaa, Rekha, Sequeira and Chatterjee2019) suggested a switch of subduction polarity during the GSB–CGC accretion at c. 0.96 Ga with the overriding CGC plate transformed into an overridden basement for the orogenic Gangpur Group sediments.
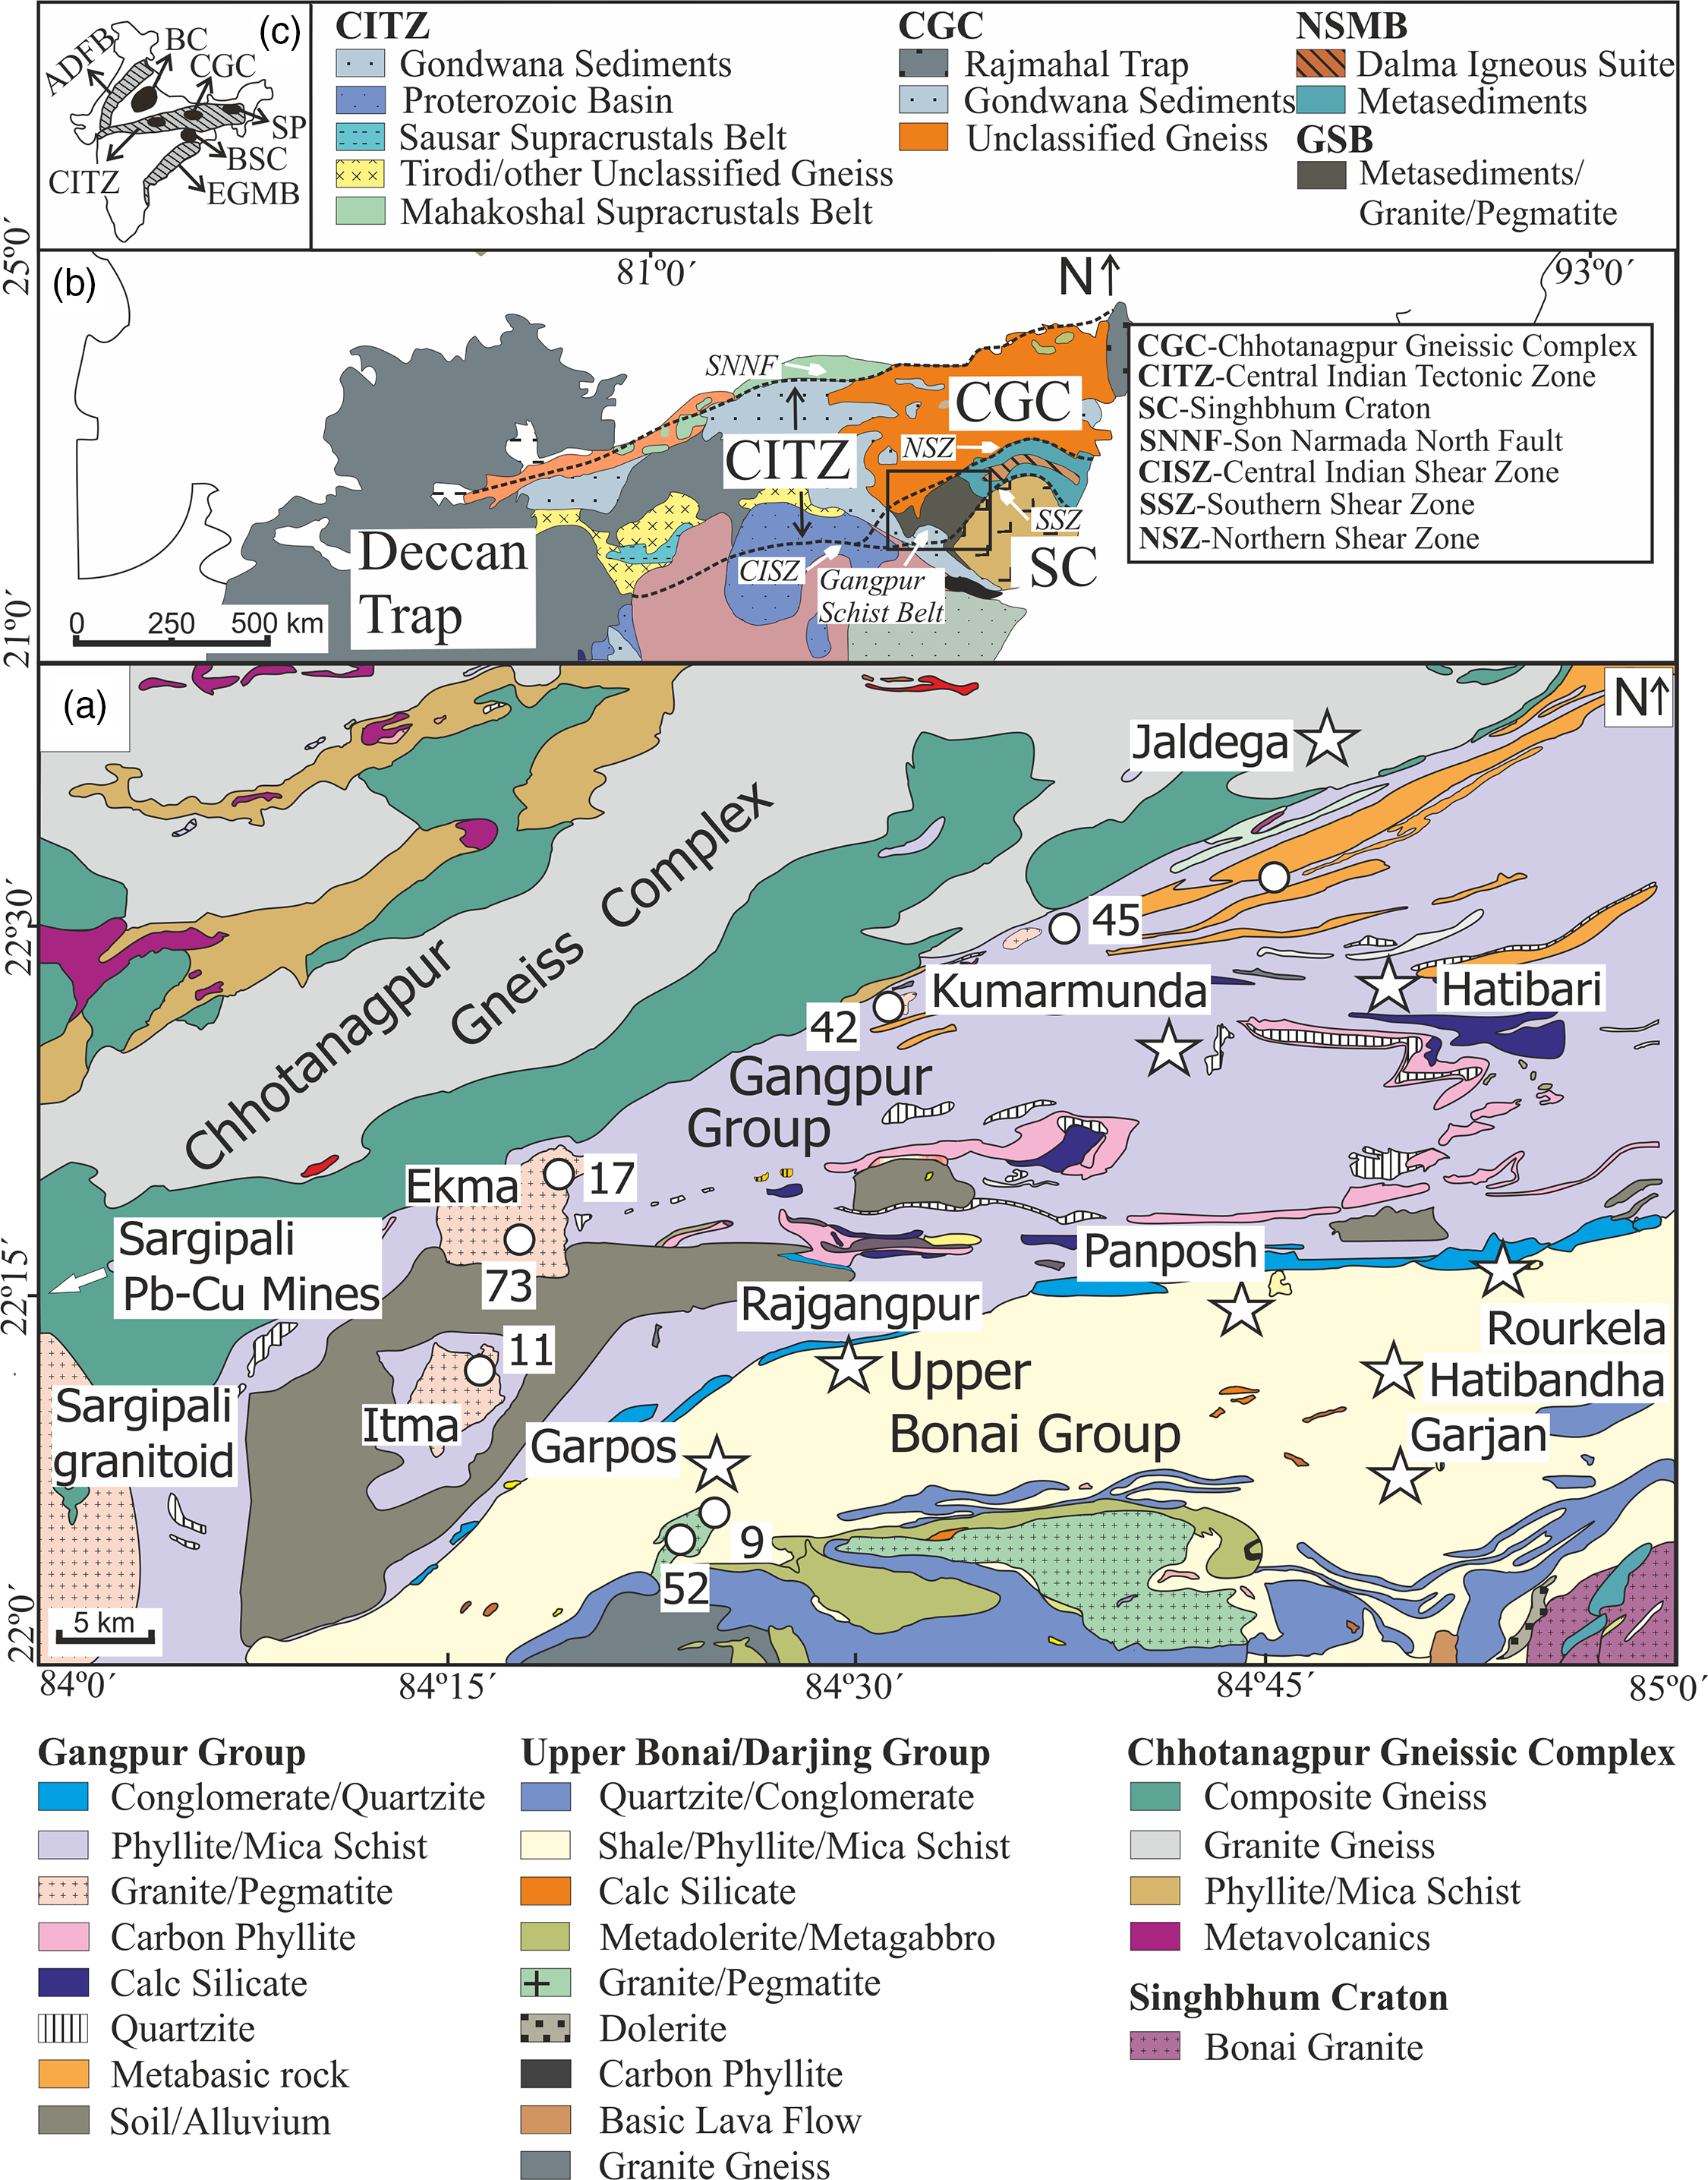
Fig. 1. (a) Geological map of the Gangpur Schist Belt and neighbouring crustal units (modified from Geological Quadrangle Map, Geological Survey of India). The sample locations and names are marked by circles (the prefix GNG to the sample names is dropped for clarity). (b) Simplified lithotectonic map of central India showing the Central Indian Tectonic Zone (CITZ), the Gangpur Schist Belt (GSB), and other crustal units (modified from Bhowmik et al. Reference Bhowmik, Wilde and Bhandari2011). (c) Inset map of peninsular India showing the CITZ and major Proterozoic orogens.
3. Sample description
Six granitoid samples were collected from the Gangpur Schist Belt with two from the Upper Bonai and four from the Gangpur Group granites and pegmatites. The sample locations are listed in Table 1. The domal-shaped outcrops of the Gangpur Group and Upper Bonai Group S-type granite bodies are situated within metasedimentary units (Figs 1, 2a–d). The granites do not have penetrative tectonic foliation; however, weak alignment defined by muscovite and biotite visible on the outcrop scale as well as in thin-sections indicates later deformation (Fig. 2a, b). Older gneiss enclaves are present in the Gangpur Group granites (Fig. 2d).
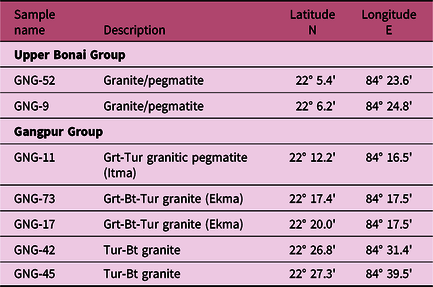
Table 1. Location of the samples examined in this study from the Gangpur Schist Belt. Mineral abbreviations after Whitney & Evans (Reference Whitney and Evans2010)

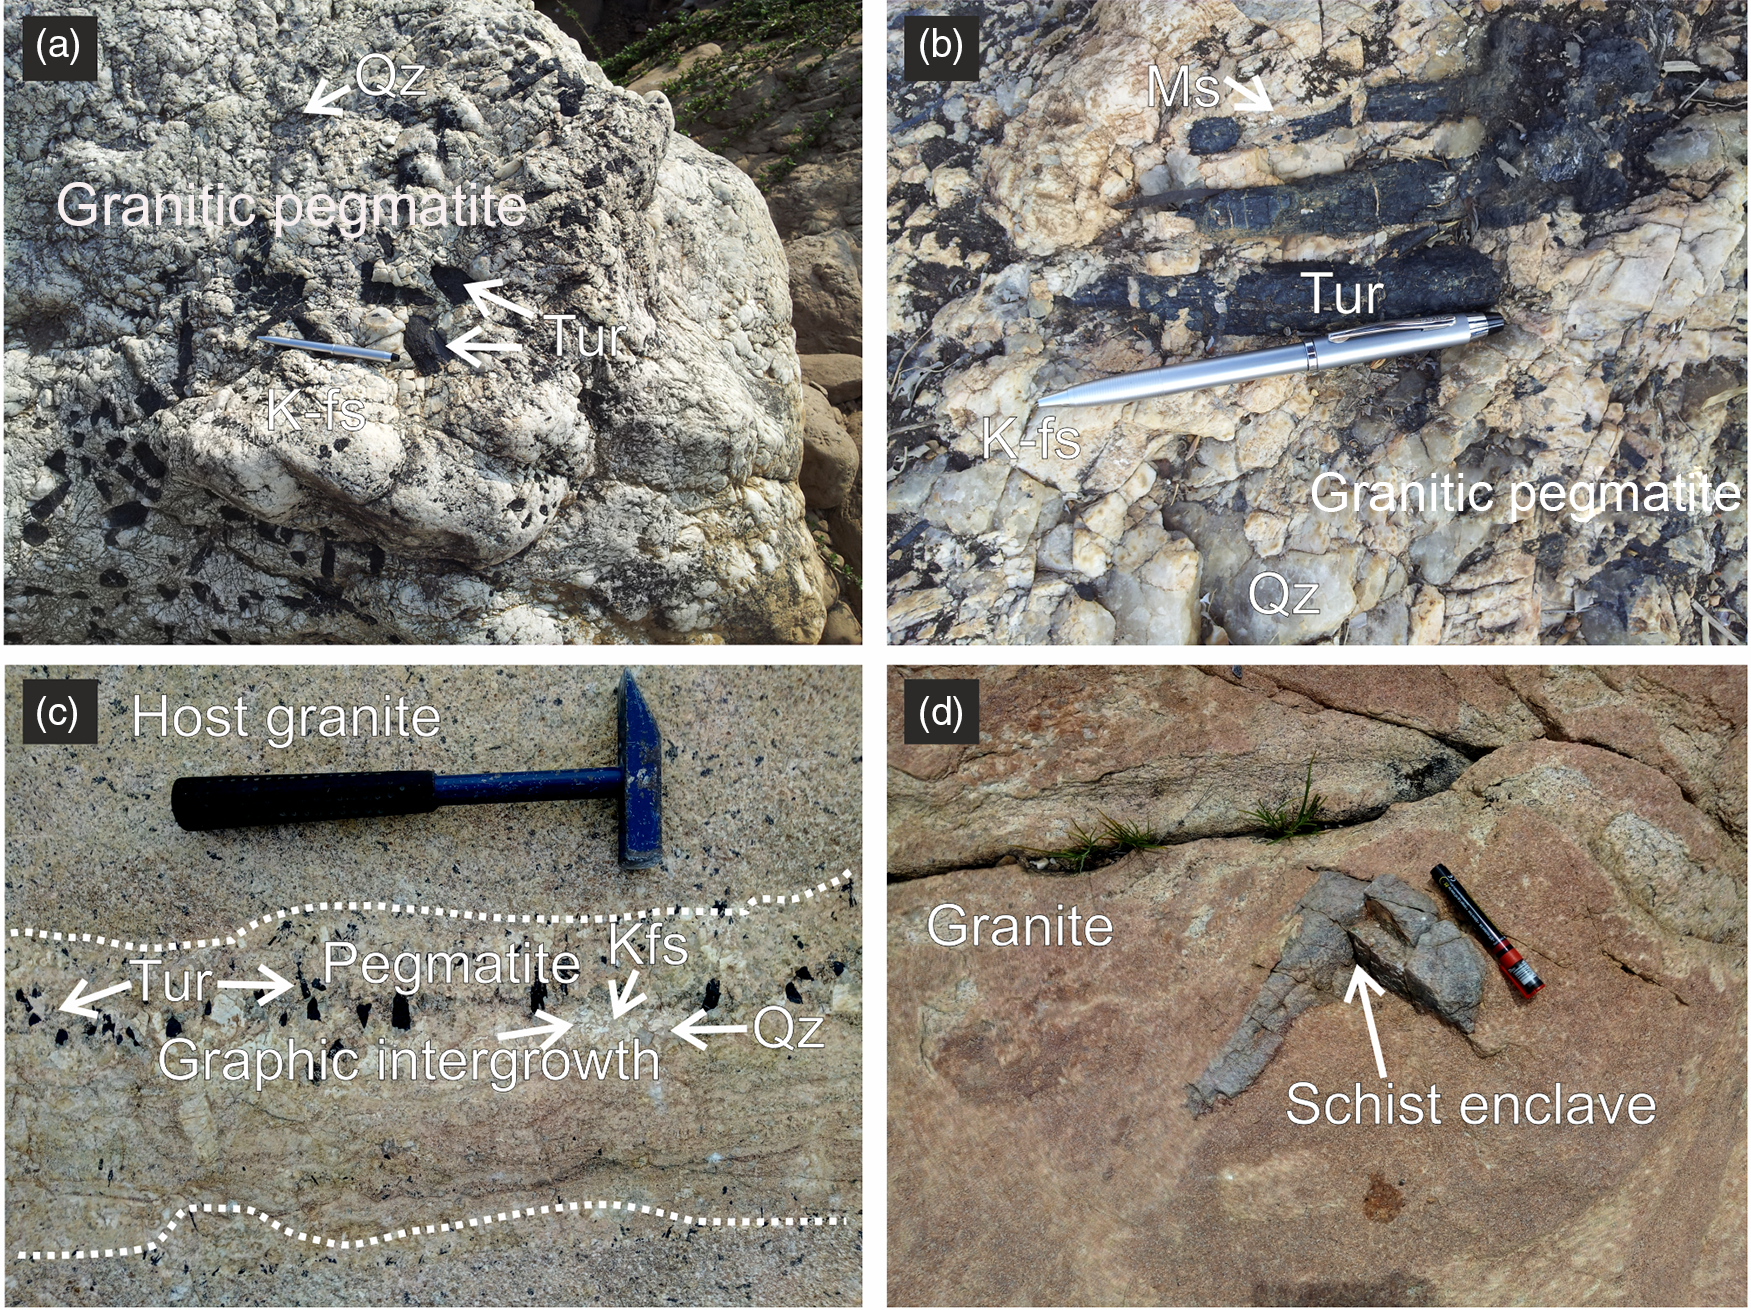
Fig. 2. Photographs illustrating field relations and mesoscopic structures in the S-type granites and pegmatites from the Upper Bonai and Gangpur Group granite and pegmatite: (a, b) Upper Bonai Group granite pegmatite; (c) Gangpur Group pegmatite, hosted in granite (note the graphic intergrowth of quartz and feldspar in the I-zone and the growth of tourmalines perpendicular to the pegmatite wall); and (d) older schist enclave in the Gangpur Group S-type granite.
In the Gangpur Group the granite bodies are later intruded by the S-type pegmatites as sub-parallel or criss-crossing sets. The contact between the granite and the intruded pegmatite is sharp. The thickness of the pegmatite bodies varies from few centimetres to approximately a metre in the Gangpur Group. The pegmatites in some cases are internally zoned with the presence of a well-defined wall, intermediate and core zone (Fig. 2c). Graphic intergrowth of quartz and feldspar is also observed in the pegmatite bodies.
4. Analytical techniques and sample details
The major-element compositions of the minerals were determined on a Cameca SX-100 Electron Probe Micro Analyser (EPMA) at the Department of Geology and Geophysics, Indian Institute of Technology (IIT), Kharagpur. The analyses were performed at 15 kV accelerating voltage and 15 nA beam current, with dwell times of 10 s on the peak and 5 s on the background on both sides. The following natural and synthetic mineral standards were used for calibration: jadeite (Na-Kα, Si-Kα), diopside (Ca-Kα, Mg-Kα), orthoclase (K-Kα, Al-Kα), fluor-apatite (F-Kα, P-Kα), NaCl (Cl-Kα), Fe2O3 (Fe-Kα), rhodonite (Mn-Kα) and TiO2 (Ti-Kα). The ZAF matrix corrections were performed by the Cameca-supplied PAPSIL program. Detection limits were better than 0.1 wt% for most elements. Structural formulae of tourmaline were calculated based on 15 total cations in the octahedral and tetrahedral (Y + Z + T) sites following the procedure of Henry & Dutrow (Reference Henry, Dutrow, Grew and Anovitz1996).
Trace-element concentrations in tourmalines and other minerals were measured in situ in thin-sections using a Thermo Fisher Scientific iCAP-Q Quadrupole inductively coupled plasma mass spectrometer (ICP-MS) coupled to a New Wave Research 193 ArF Excimer laser ablation (LA) system at the Radiogenic Isotope Facility, Department of Geology and Geophysics, IIT, Kharagpur. The laser was operated at 5 Hz pulse frequency, 5 J cm–2 fluence and 30–40 μm spot size. The ICP-MS was optimized for maximum sensitivity on Li, Co, In, Th and U by ablating the NIST 612 reference glass. The oxide production rate monitored on 232Th16O was always < 0.8–1.0%. The analyses were performed in time-resolved mode with each analysis consisting of 30 s background measurement and 40 s peak signal measurement. External standardization was done using the sample-standard bracketing method with 10 measurements of the samples bracketing two analyses of NIST 612 reference glass. The data quality was monitored by ablating the NIST 610 reference glass as unknowns interspersed with the measurement of the samples. Accuracy calculated from repeat measurements of the NIST 612 and NIST 610 reference glasses are found to be better than 4% (2σ) and 7% (2σ), respectively, whereas the reproducibility estimated from repeated analyses of the NIST 610 glass are as follows: Li, Be, B, Ni, Sr, Ba, La, Pr, Nd, U, Th, Pb (<6%, 2σ); Co, Rb, Mo, Sc, Ti, Zn, Y, Zr, Nb, Ce, Sm, Eu, Gd, Tb, Dy, Ho, Er, Tm, Yb, Lu, Hf and W < 9% (2σ). The major- and trace-element data are listed in online Supplementary Tables S1 and S2, respectively (available at at http://journals.cambridge.org/geo).
Table 2. Boron isotope compositions of tourmaline from the Gangpur Schist Belt granites and pegmatites. Mineral abbreviations after Whitney & Evans (Reference Whitney and Evans2010)
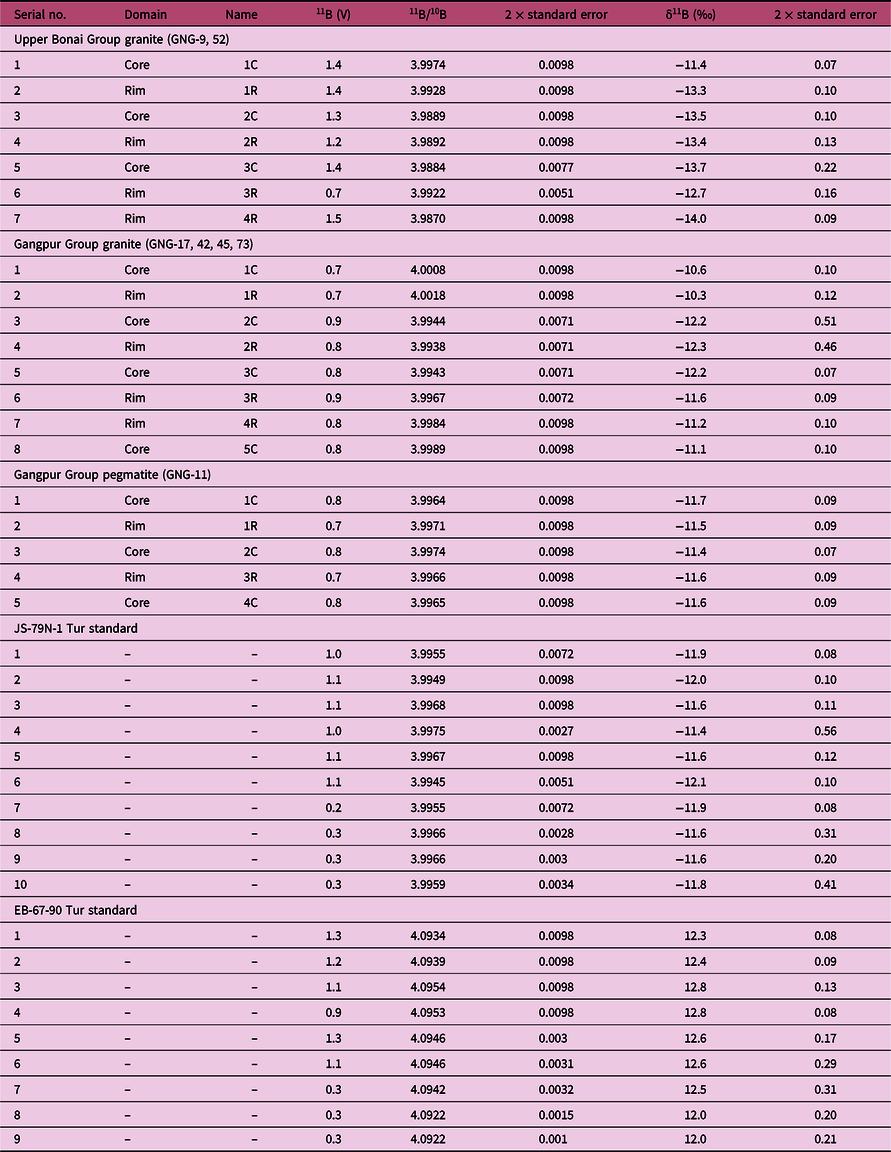
Boron isotope ratios in tourmaline were measured in situ in thin-sections using a New Wave Research 193 ArF Excimer laser ablation system coupled to a Thermo Scientific Neptune Plus multi-collector (MC) ICP-MS at the Radiogenic Isotope Facility, Department of Geology and Geophysics, IIT, Kharagpur. The ablation was performed at 10 Hz repetition rate and 2–2.5 J cm–2 fluence at spot diameters of 35–70 µm. The 10B and 11B isotopes were measured on Faraday cups in medium resolution mode, which was more than adequate to resolve the isobaric interferences of Ar4+ and Ne2+ on 10B. The ICP-MS was optimized for maximum sensitivity on boron isotopes by ablating the NIST 610 reference glass. Isotope ratios were acquired in single blocks of 200 cycles (0.524 s integration time per cycle), of which instrument background and gas blanks were measured for 70 cycles with the laser turned off followed by 130 cycles of peak signal measurement with the laser ablating on the sample. A washout delay of 100 s between consecutive measurements was sufficient to attain background values of < 4 mV for 11B. The instrumental mass-bias and drift were corrected by sample-standard bracketing technique with five measurements of unknown bracketed by two measurements of the JS-82A-3 reference tourmaline (schorl) (Palmer & Slack, Reference Palmer and Slack1989). The JS-79N-1 (Palmer & Slack, Reference Palmer and Slack1989) and EB-67-90 (Míková et al. Reference Míková, Košler and Wiedenbeck2014) tourmaline references were measured as unknowns in alternate brackets together with the measurements of the samples to monitor data quality. The data were reduced offline using an in-house Excel© spreadsheet that corrects for instrumental and gas backgrounds, instrumental mass-bias and drift. The boron isotope composition of the tourmalines is expressed as δ11B, which is the per mil (‰) deviation of their 11B/10B ratio from that of the NIST SRM 951 boric acid standard that has a certified 11B/10B value of 4.04362 ± 0.00137 (Tonarini et al. Reference Tonarini, Pennisi and Gonfiantini2009). The δ11B obtained for the JS-79N-1 (–11.8 ± 0.5‰, 2σ; n = 8) and the EB-67-90 (12.7 ± 0.5‰, 2σ; n = 7) reference tourmalines match within error the values reported by Palmer & Slack (Reference Palmer and Slack1989) and Míková et al. (Reference Míková, Košler and Wiedenbeck2014) (JS-79N-1 = –12.3 ± 0.4‰; EB-67-90 = 12.9 ± 0.2‰). The B-isotope data are listed in Table 2.
5. Tourmaline occurence and microtextural relations
Tourmalines occur as euhedral grains of variable size (a few microns to a few centimetres across) intergrown with garnet, muscovite, biotite, albitic plagioclase, K-feldspar and quartz in Upper Bonai Group S-type granite pegmatites, and are dispersed throughout the granitic body (Fig. 2a, b). They can be differentiated into two textural types. In one (type 1), grains with Mg-poor cores are surrounded by relatively Mg-rich rims that overgrow the cores and also partially replace them pseudomorphically and along cracks and fractures (Figs 3a, 4a). The replacement produces irregular patches of tourmaline with composition intermediate between the two zones. In the other (type 2), grains with relatively homogenous Mg-rich cores are rimmed by oscillatory zoned rims of intermediate composition (Fig. 3b, c). The location of the pegmatite samples (GNG-9, 52) collected from the Upper Bonai Group granite pegmatite are listed in Table 1.

Fig. 3. Backscattered electron (BSE) images of tourmaline grains documenting microtextural relations in granites and pegmatites, from the (a–c) Upper Bonai and (d–i) Gangpur groups. (a) Type 1 tourmaline grain intergrown with k-feldspar in Upper Bonai Group granite pegmatite; note the outer Mg-rich layer and the Fe-rich core. (b) Type 2 tourmaline grain intergrown with k-feldspar and quartz in Upper Bonai Group granite pegmatite. (c) Type 2 tourmaline with concentric zoned rim in Upper Bonai Group granite pegmatite. (d, e) Tourmaline intergrown with k-feldspar and quartz in Gangpur Group pegmatite. (f, g) Oscillatory zoned tourmaline crystals in the Gangpur Group granite. (h, i) Tourmalines in the Gangpur Group pegmatite showing oscillatory zoning and compositional variation from core to rim.
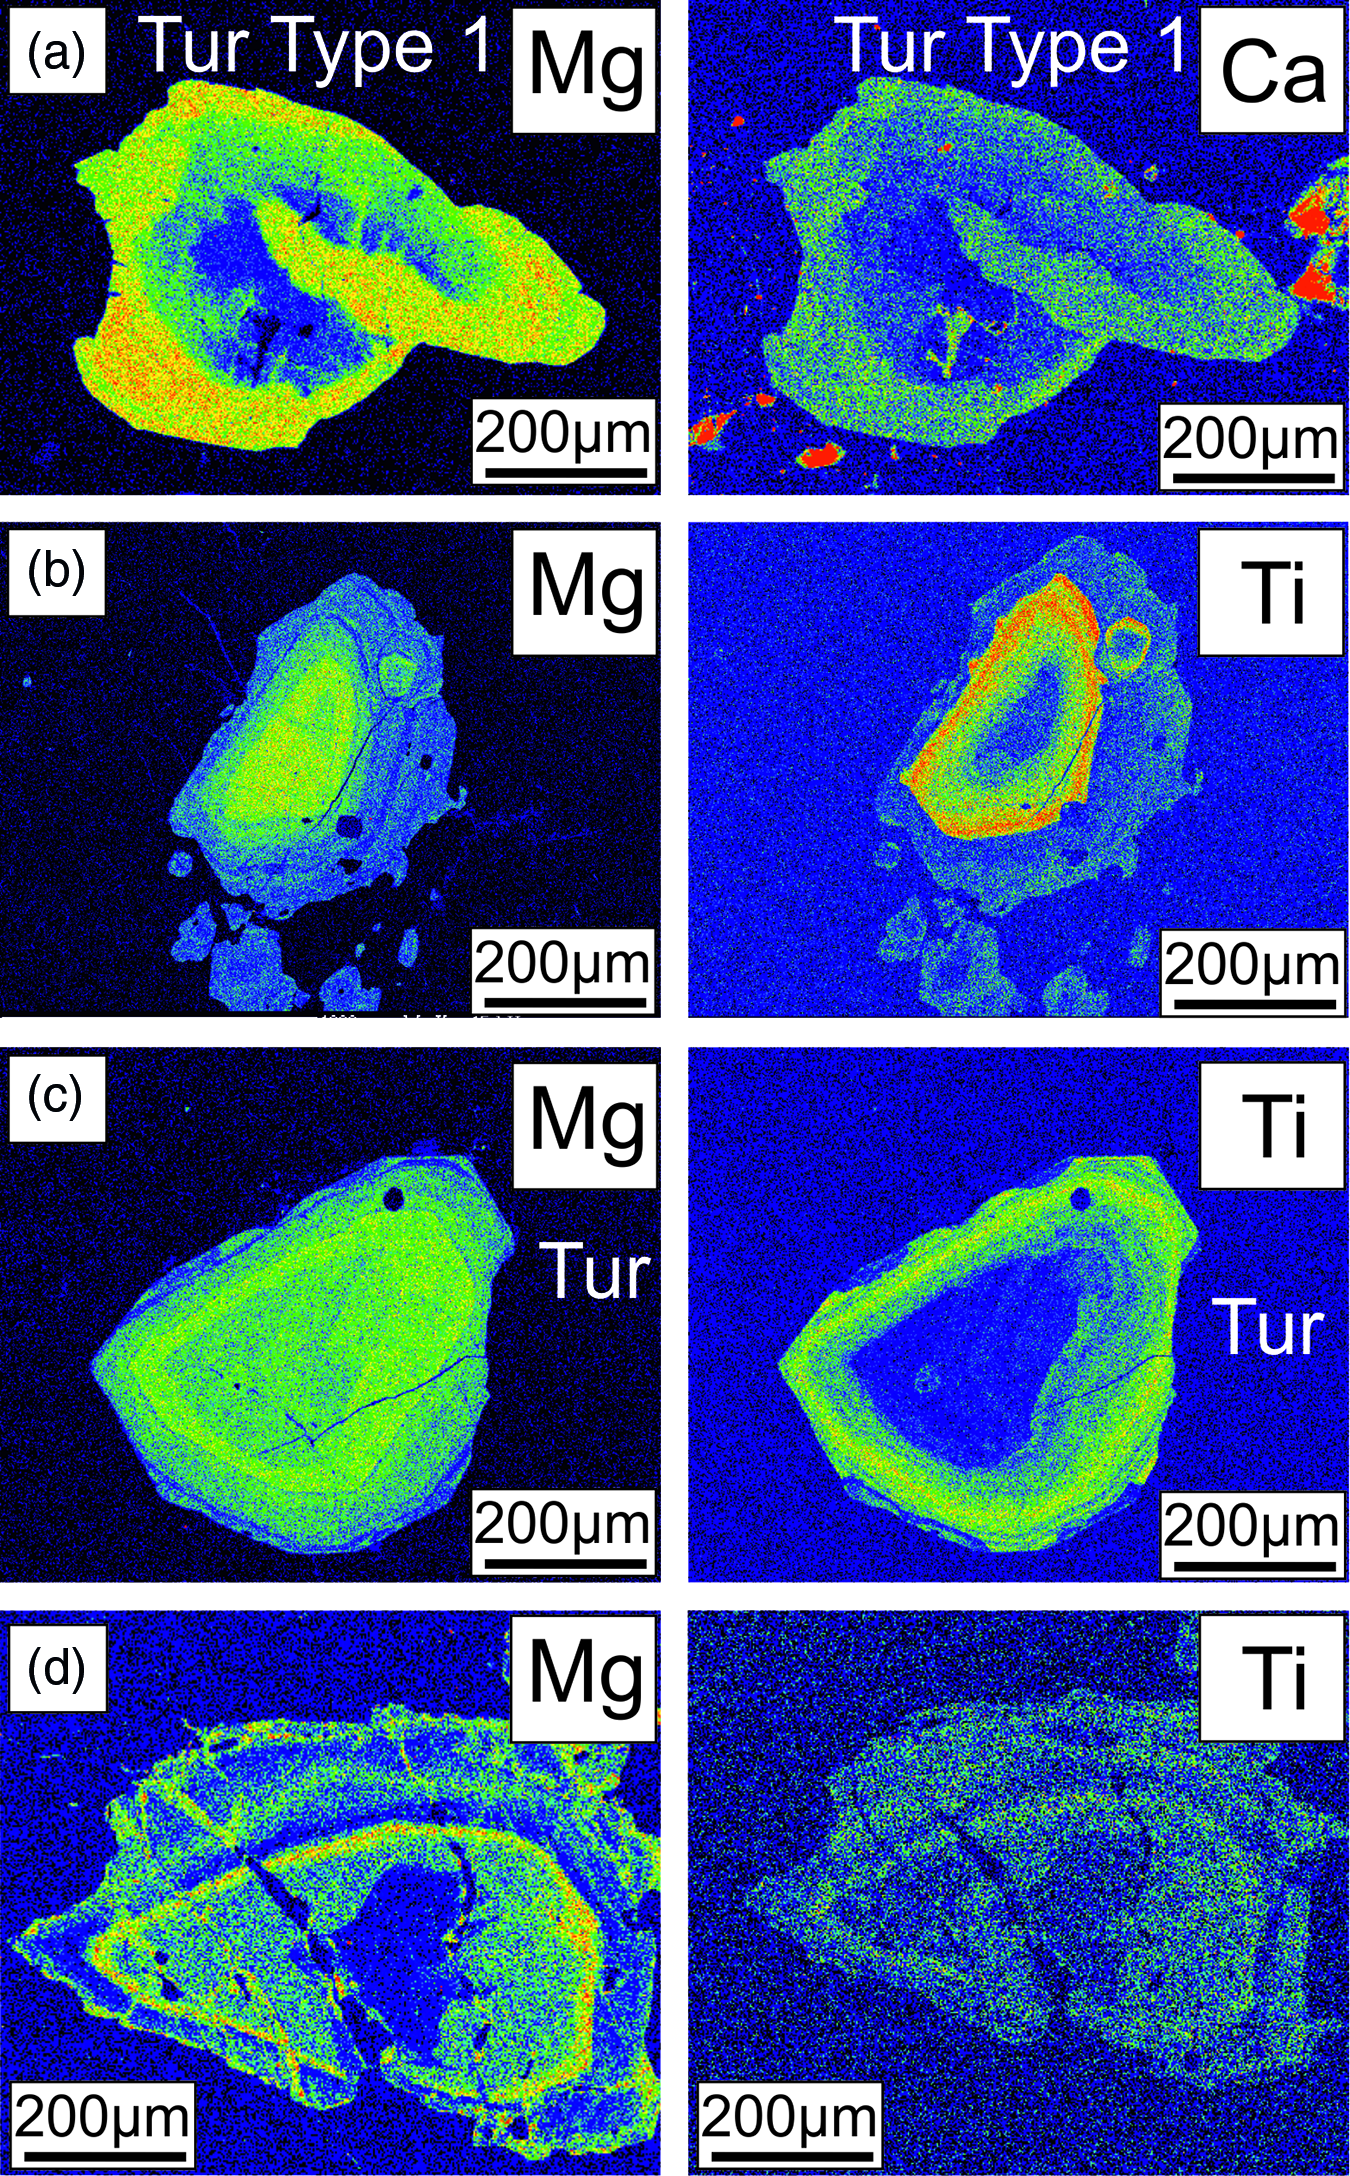
Fig. 4. X-ray elemental maps, of the tourmalines from the (a) Upper Bonai Group and (b–d) Gangpur Group.
In the Gangpur Group granites and pegmatites, tourmalines occur as euhedral grains embedded with garnet, muscovite, biotite, K-feldspar, sodic plagioclase and quartz (Figs 2c, d, 3d–f). They are compositionally zoned with homogeneous or patchily zoned cores (Fig. 3g–i) that are surrounded by broad mantles with well-developed oscillatory zoning (Figs 3g–i, 4b–d). Some tourmaline grains display patchy zoning, probably as a result of later fluid activity (Fig. 3i). The locations of the pegmatite samples (GNG-11, 73, 17, 42) collected from the Gangpur Group granite/pegmatite are listed in Table 1.
6. Results
6.a. Tourmaline major- and trace-element and boron isotope composition
6.a.1. Major elements
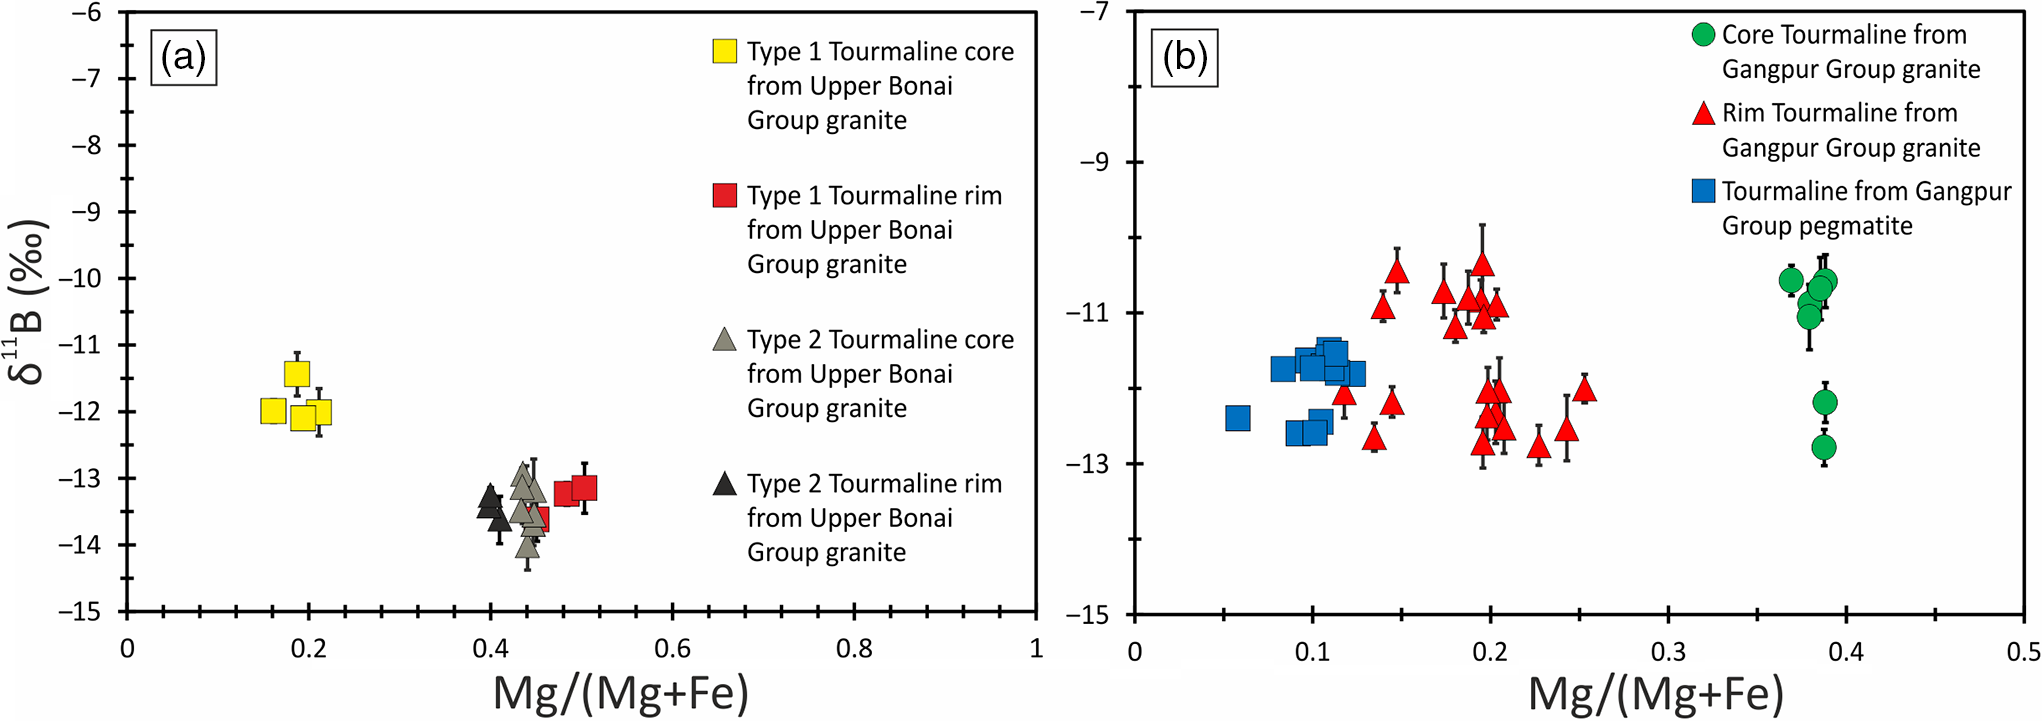
Tourmalines in the Upper Bonai Group granite pegmatite are of schorl composition and plot in the alkali field (Fig. 5a). In the Al–Fe–Mg ternary diagram the tourmalines plot in the field of Li-poor granitic rocks (Fig. 5c). There are two types of tourmalines in this granite pegmatite. The patchily zoned grains (type 1) have Mg-poor (XMg = 0.16–0.19) cores which are overgrown and replaced by mantles with higher Mg (XMg = 0.41–0.48) (Figs 6a, c, 7a). The Fe and Mg are inversely correlated with each other while Ca and Ti are positively correlated with Mg no. (Mg/(Mg+Fe2+)) (Fig. 6a, c, g). The X-site vacancies are lower in the Mg-rich mantles (Xvac: Mg-rich mantle = 0.32–0.38 pfu; Mg-poor cores = 0.33–0.42 pfu) (Figs 6a, 7a). In contrast, type 2 tourmalines have different zoning patterns. Here, the core regions have higher Mg (XMg = 0.44–0.50), lower X-site vacancy (Xvac = 0.29–0.32 pfu), higher Ti (0.04–0.11 apfu), higher T-site Al (AlT = 0.16–0.26 apfu) and lower Y-site Al (AlY = 0.45–0.58 apfu), and are compositionally similar to the rims of type 1 tourmaline (Figs 6a, e, 7a). The oscillatory zoned rims of these grains have lower XMg (0.29–0.35), Ti (0.01–0.03 apfu) and T-site Al (AlT = 0.01–0.10 apfu), and higher X-site vacancies (Xvac = 0.35–0.49 pfu) and Y-site Al (AlY = 0.64–0.79 apfu) relative to the cores (Fig. 6a, e, g). The Na concentrations of type 1 tourmalines show a negative correlation with Mg.
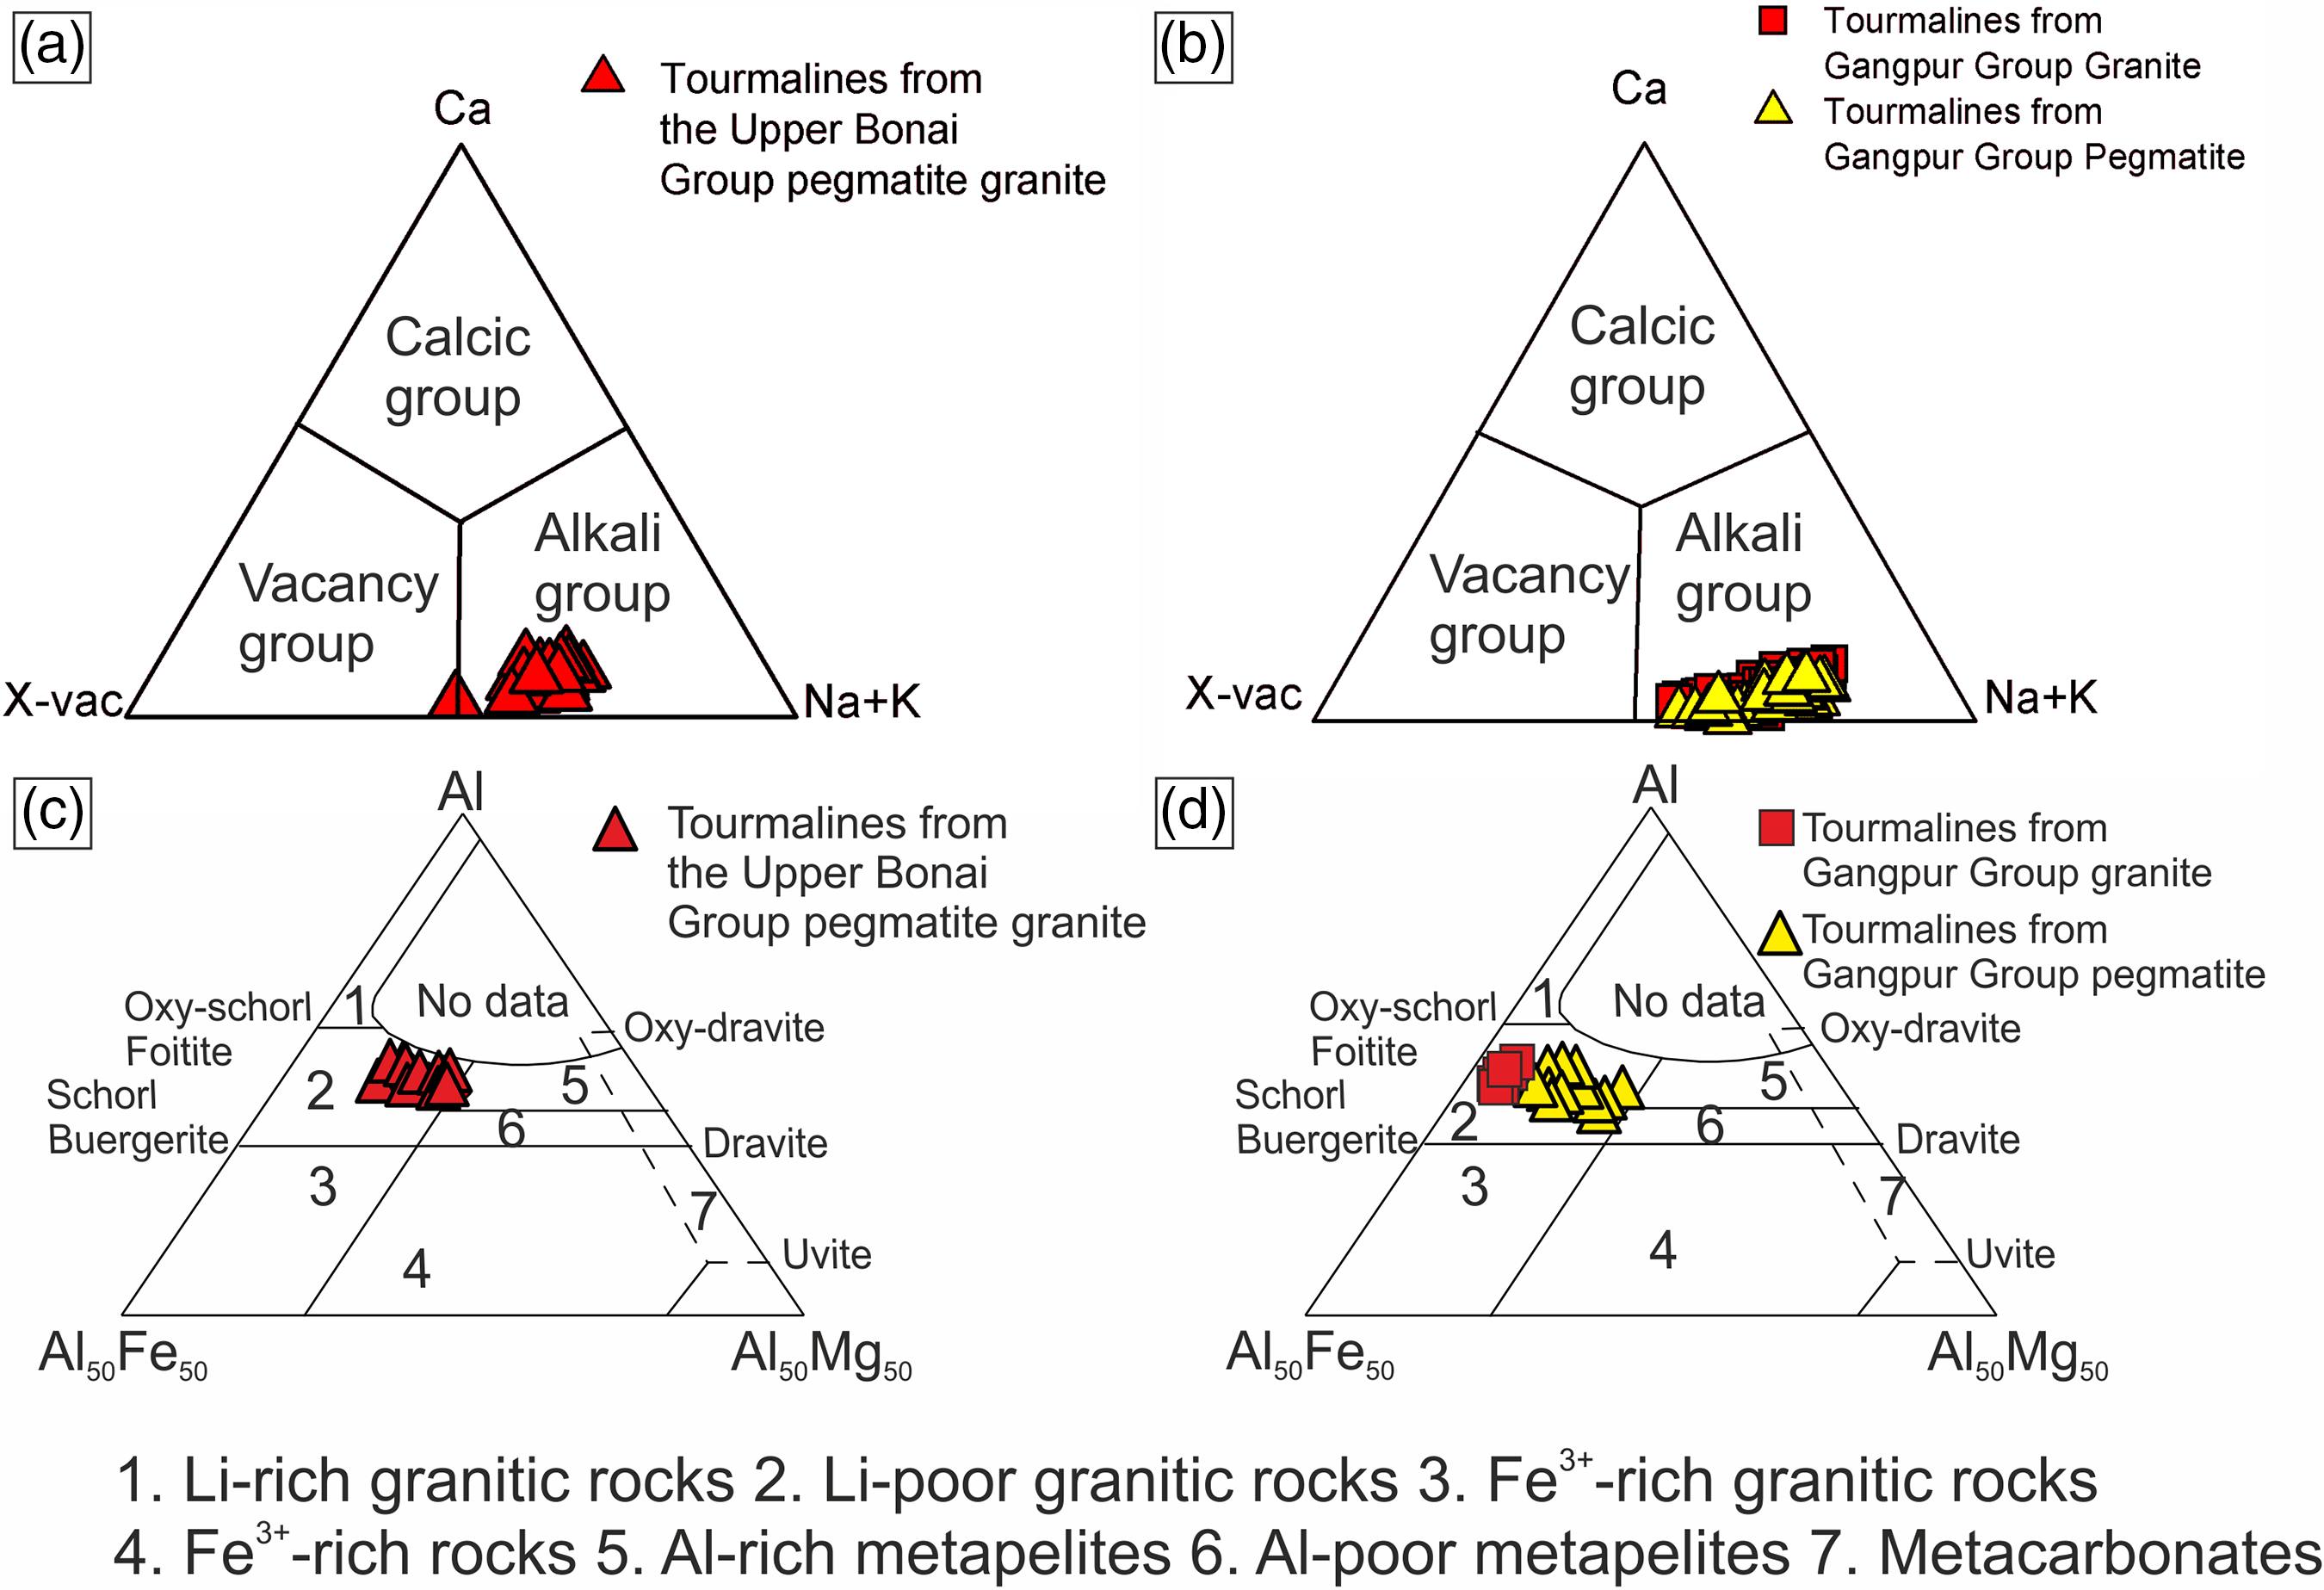
Fig. 5. Tourmaline compositions from the Upper Bonai and Gangpur Group granitoids plotted in (a, b) triangular diagrams after Hawthorne & Henry (Reference Hawthorne and Henry1999) and (c, d) the Al–Fe–Mg triangular diagrams.
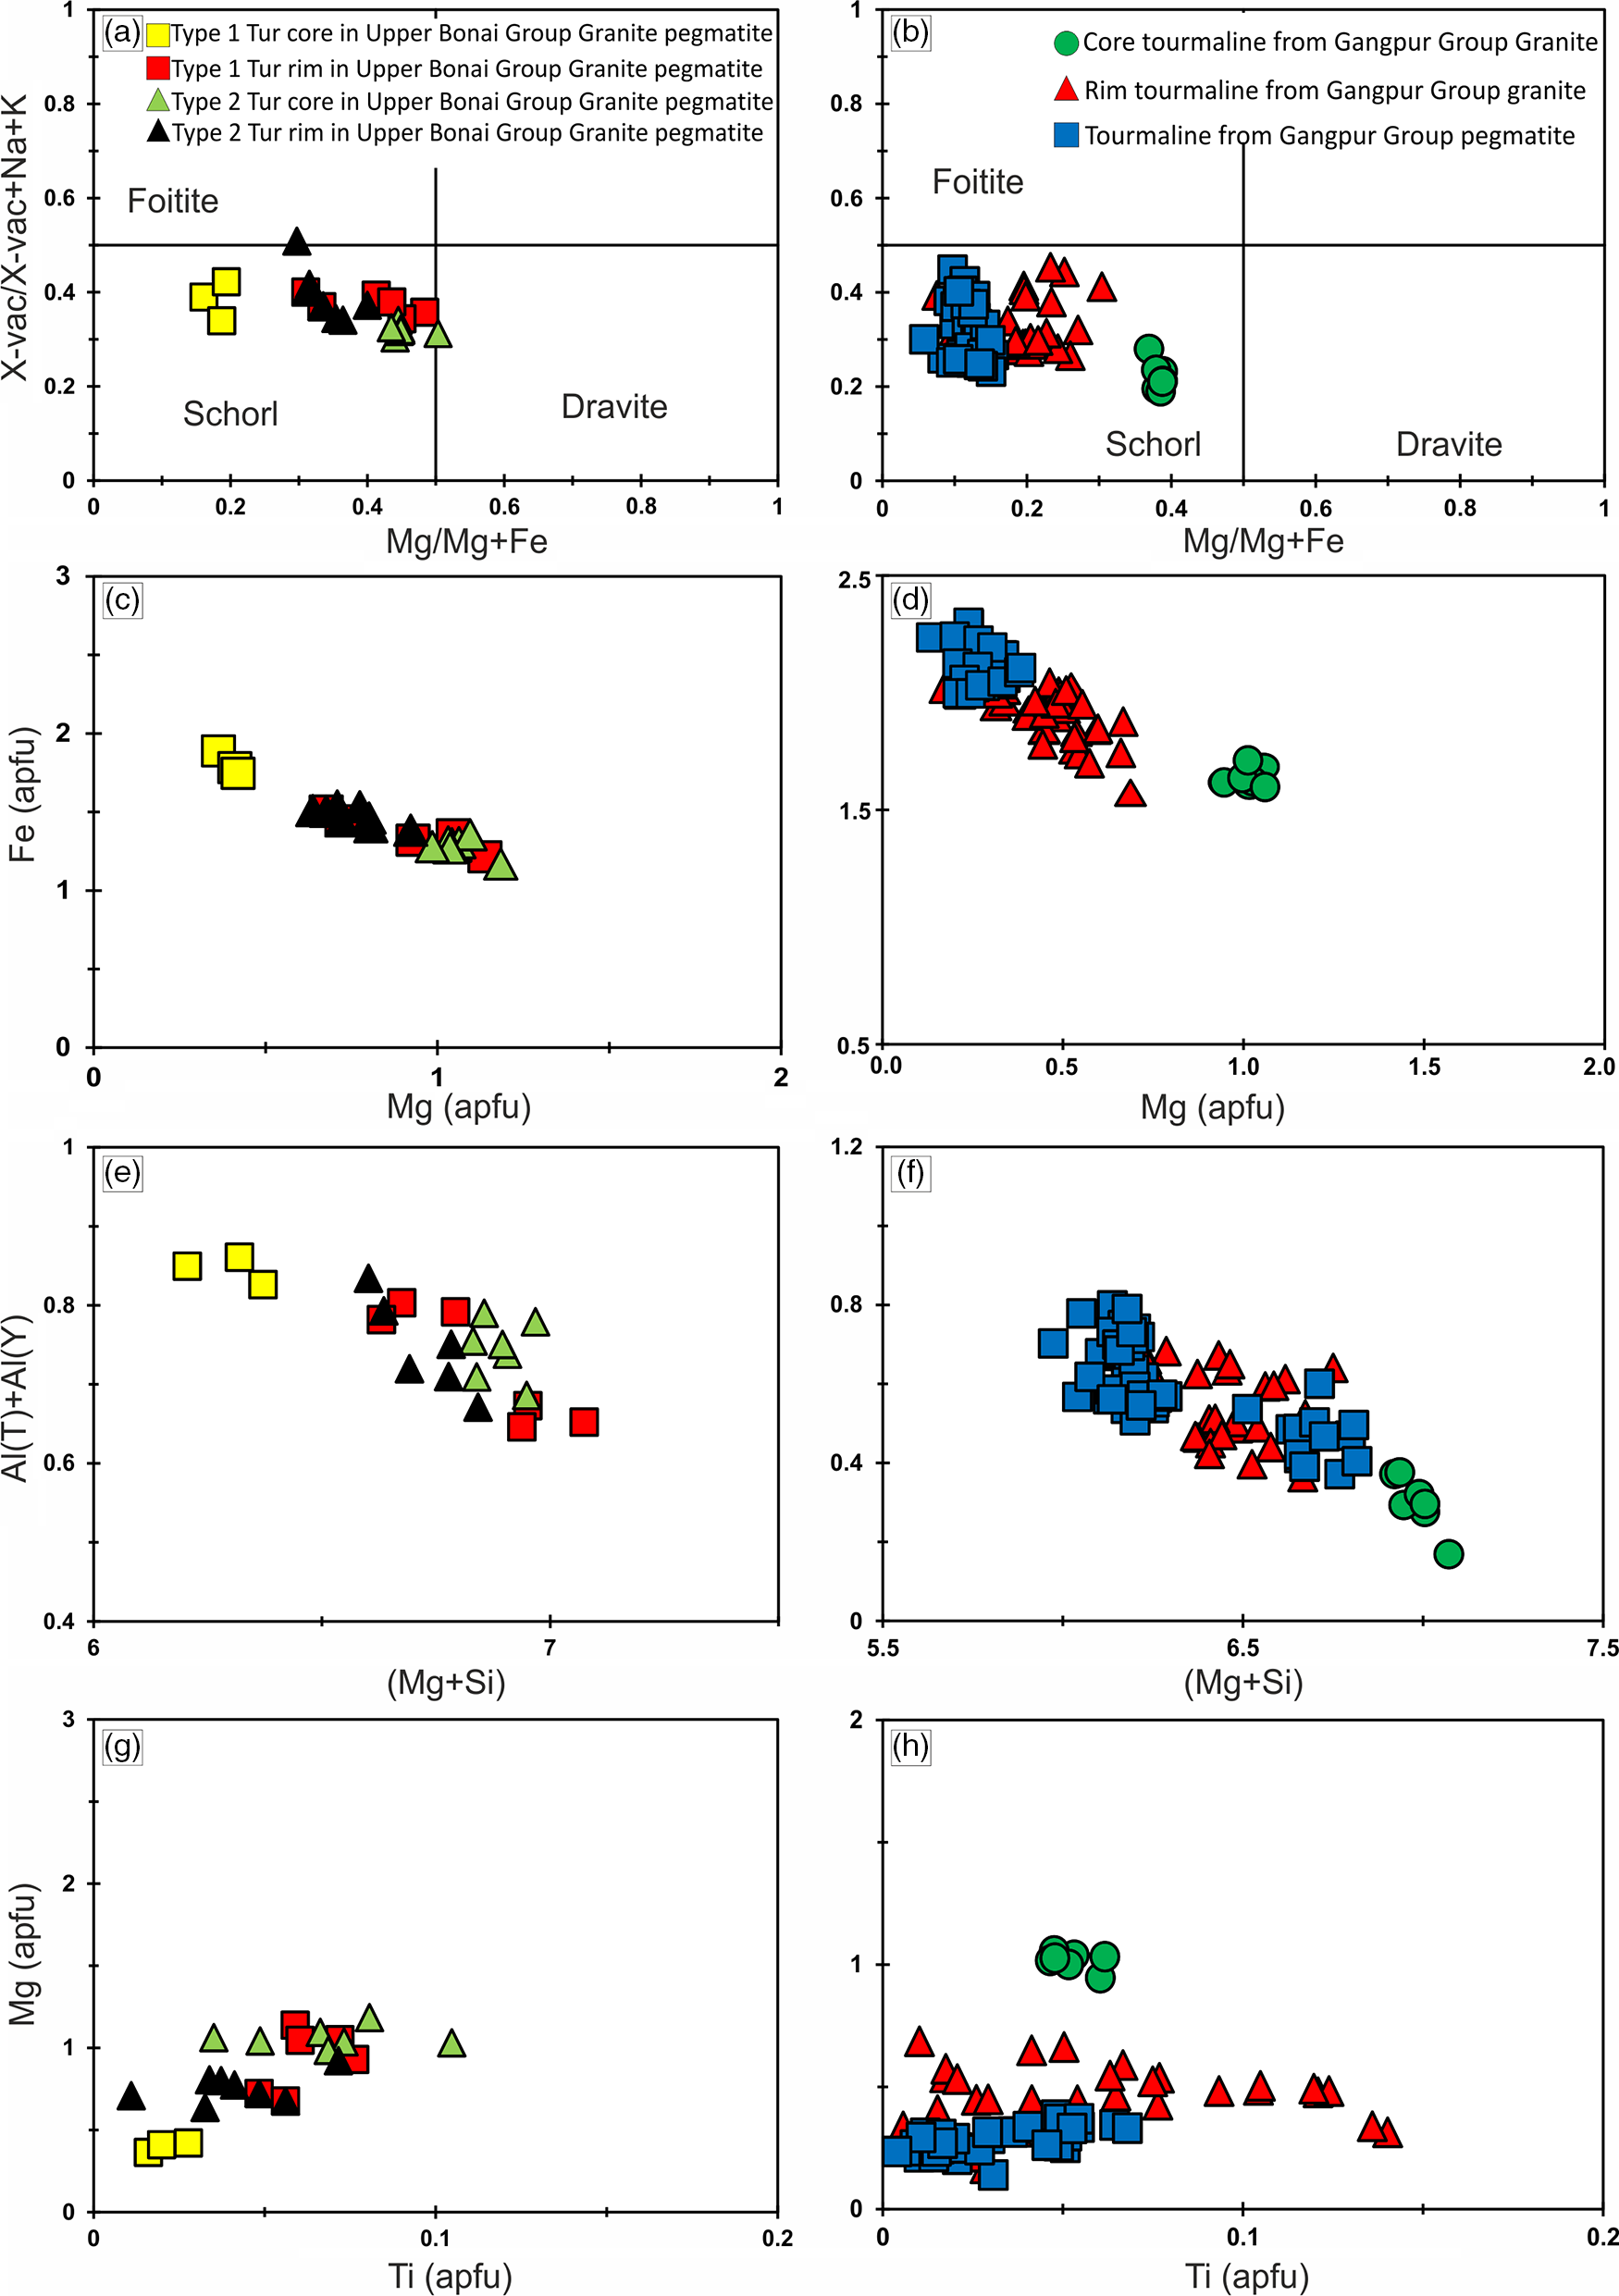
Fig. 6. Major-element plots for tourmalines from (a, c, e, g) Upper Bonai Group granite pegmatite and (b, d, f, h) Gangpur Group granitoids. (a) The Mg concentration increases and X-site vacancy decreases in the type 2 tourmaline rim. (b) In the Gangpur Group the Mg concentration is lowest in the tourmalines from the pegmatite. (c, d) The variation in Fe and Mg concentration obtained from the granitoid tourmalines in Upper Bonai and Gangpur Group, respectively. (e, f) Al(T)+Al(Y) versus Mg+Si for the tourmalines in the granitoids from Upper Bonai and Gangpur Group. (g, h) Mg versus Ti for the granitoid tourmalines from Upper Bonai and Gangpur Group.
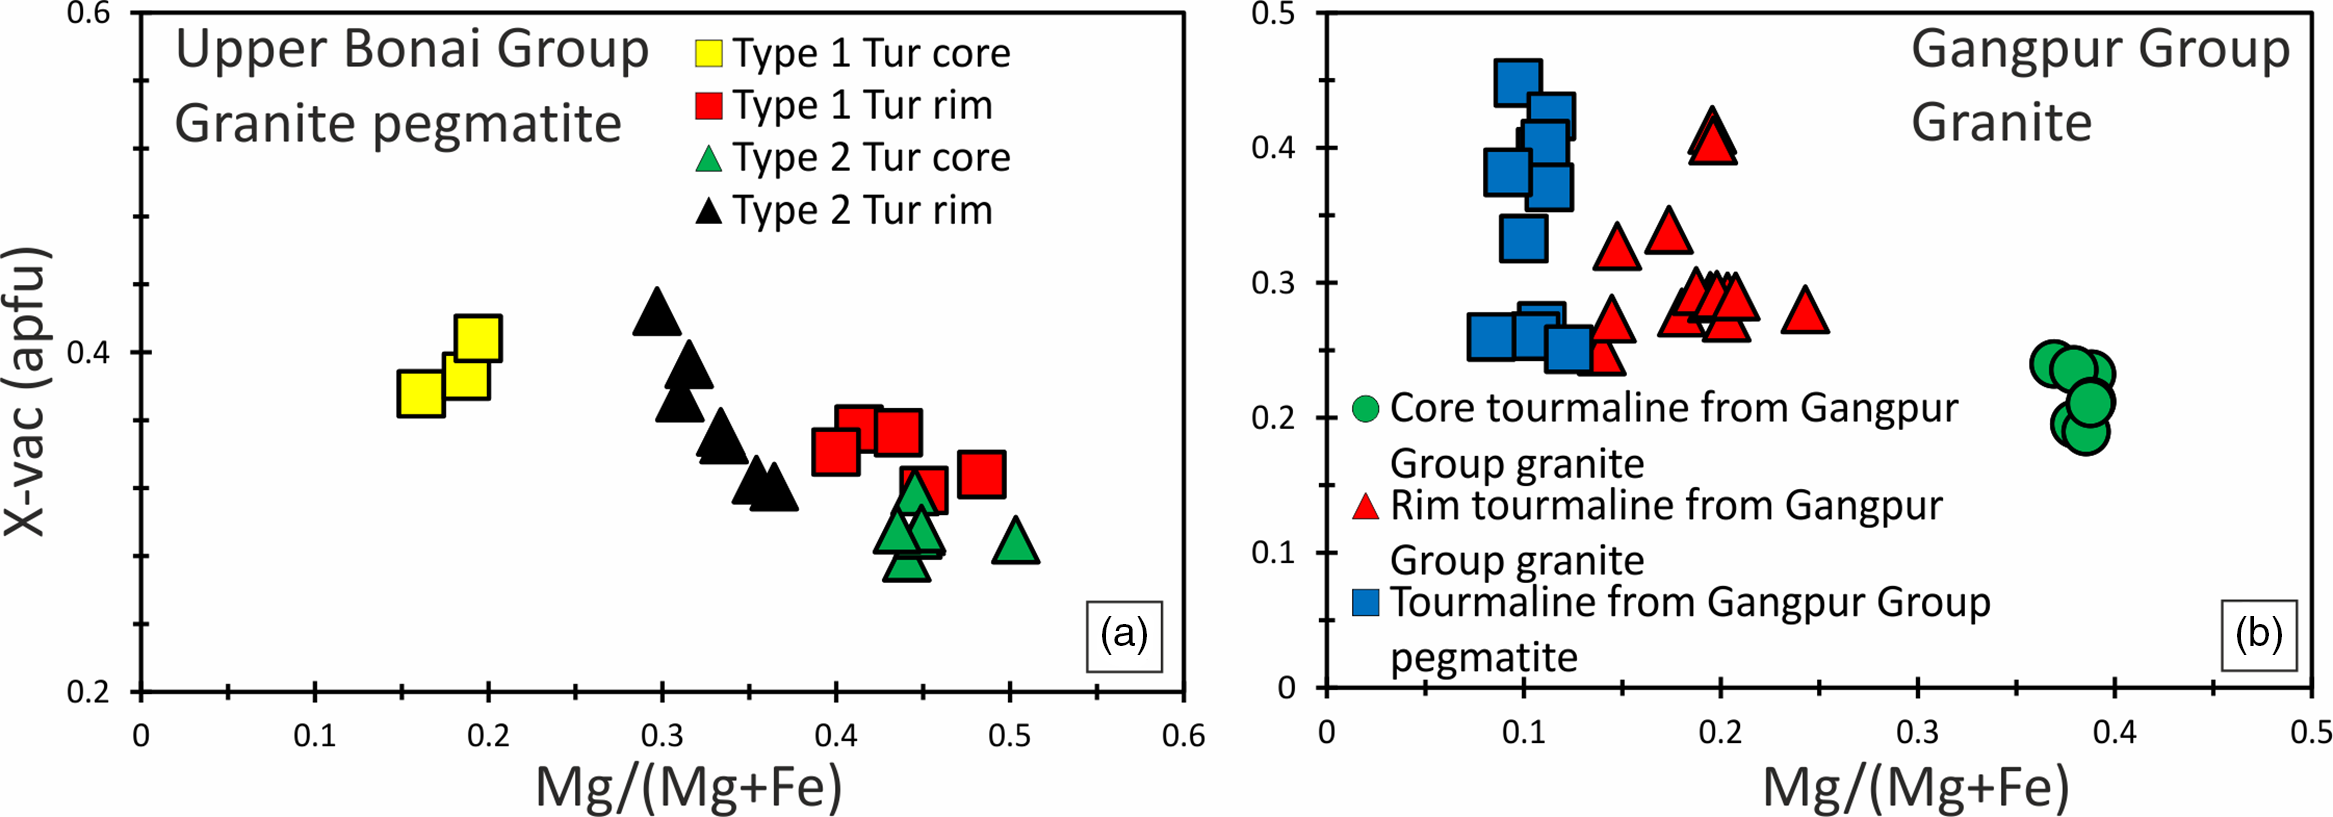
Fig. 7. Bivariate plots of X-site vacancy versus Mg/(Mg+Fe) for tourmalines in the (a) Upper Bonai Group granite pegmatite; and (b) Gangpur Group granite and pegmatite.
Tourmalines in granites of the Gangpur Group are also of schorl composition and plot in the alkali field (Fig. 5b). In the Al–Fe–Mg ternary diagram, the tourmalines plot in the field of Li-poor granitic rocks (Fig. 5d). The Mg concentrations decrease whereas the Al concentrations increase from the core to the rim of the tourmaline grains (XMg: core = 0.34–0.38, rim = 0.13–0.24 apfu; Al: core = 6.2–6.4 apfu, rim = 6.4–6.6 apfu) (Figs 6b, d, f, 7b). The Ti concentrations of the rim tourmaline show a broader dispersion in comparison to the core tourmaline (Ti: core = 0.04–0.06 apfu, rim = 0.02–0.14 apfu) while Ca is variable without any clear trend (Fig. 6h). The T-site Al and X-site vacancies are higher in the rims (Xvac = 0.38–0.42 pfu, AlT = 0.6 apfu, AlY = 0.0–0.27 apfu) compared with the cores (Xvac = 0.17–0.25 pfu, AlT = 0.0–0.02 apfu, AlY = 0.32–0.46 apfu) (Figs 6f, h, 7b). The concentric oscillatory zoning in the grains is largely the result of variation in Mg and Ti concentrations (Fig. 4b–d).
Tourmalines from Gangpur Group pegmatites on the other hand are Mg-poor (XMg = 0.08–0.12) schorl with low to intermediate X-site vacancy (Xvac = 0.21–0.45 pfu) and plot in the alkali group (Figs 5b, 6b, d, f, 7b). The Ca and Ti increase, whereas Al decreases from the core (Ca = 0.01–0.02 apfu, Ti = 0.01–0.02 apfu, Al = 6.8 apfu) to the rims (Ca = 0.04–0.06 apfu, Ti = 0.05–0.07 apfu, Al = 6.5 apfu) (Fig. 6f, h). The T-site Al is higher and the Y-site lower in the rims (AlT = 0.14–0.18 apfu, AlY = 0.36–0.42 apfu) compared with the cores (AlT = 0.01–0.05 apfu, AlY = 0.62–0.83 apfu).
6.a.2. B-isotope ratio
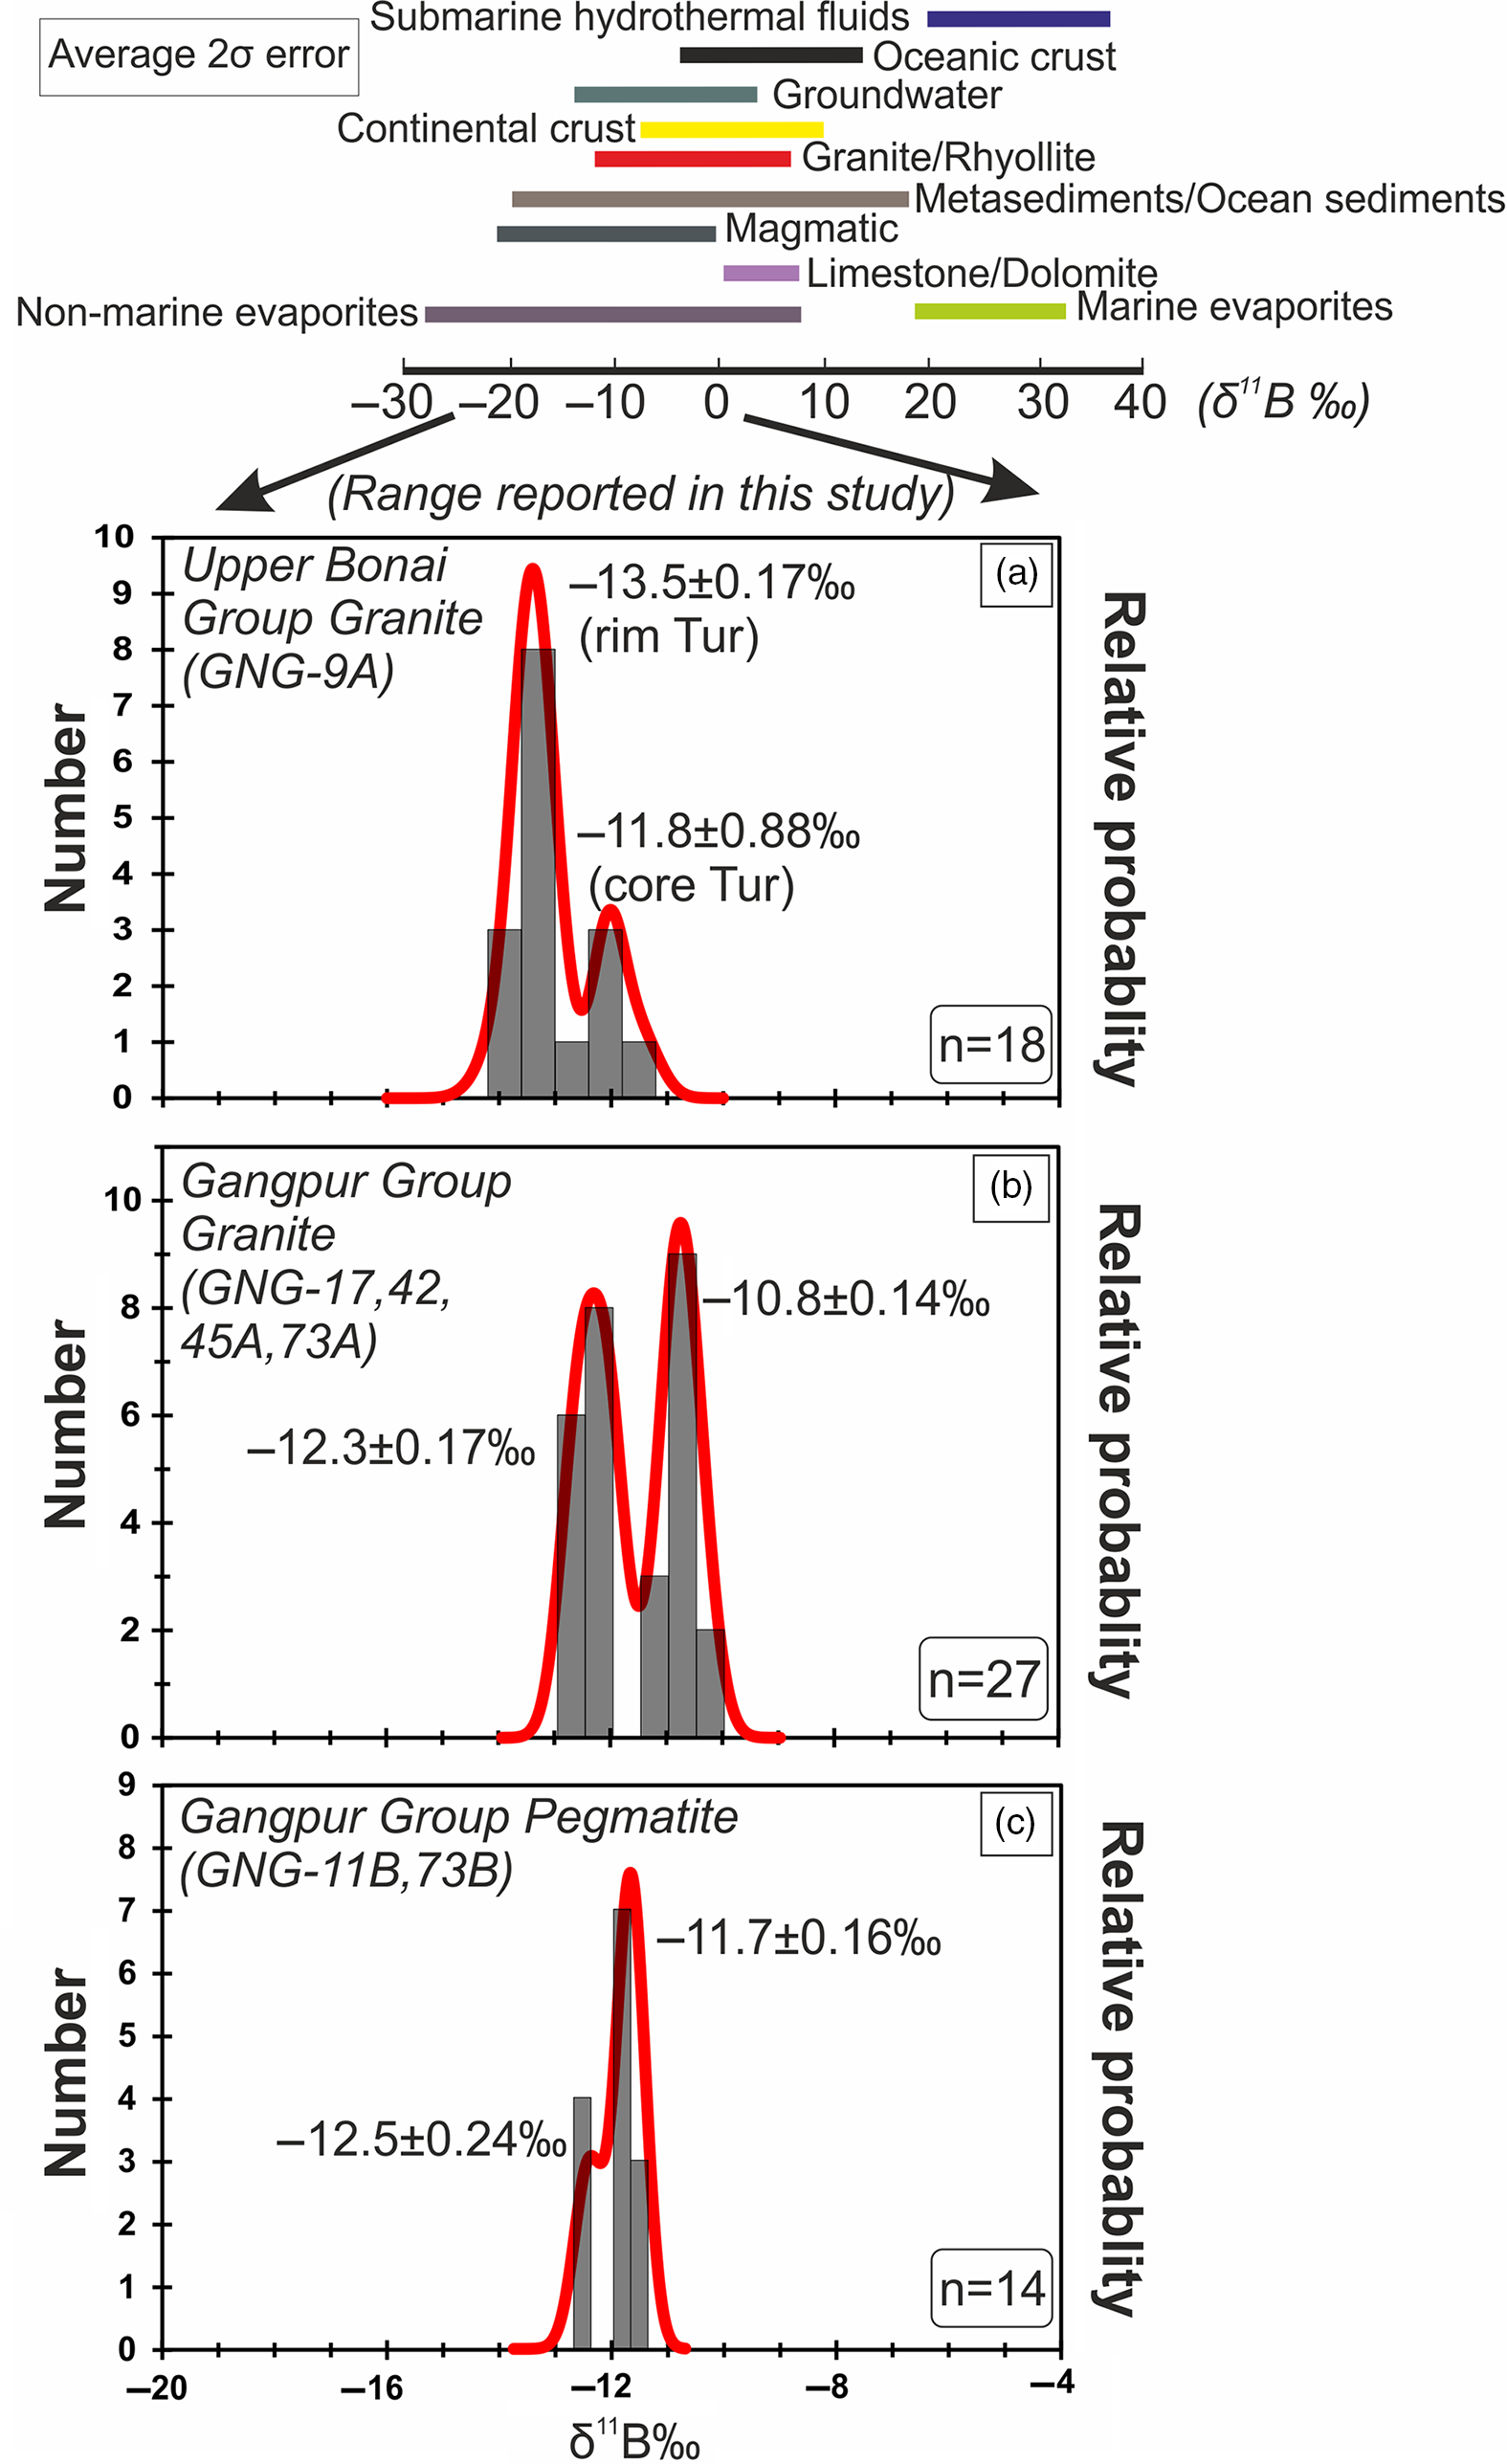
The δ11B of tourmalines from Upper Bonai Group granite–pegmatite varies from −13.8 ± 1.2‰ to −11.8 ± 0.88‰. Grains with distinct core and rim texture display some variation in δ11B with the Fe-rich embayed cores having slightly heavier boron isotope composition (δ11B = −11.8 ± 0.88‰) compared with the rims in the case of Type I tourmaline (δ11B = −13.2 to −13.8‰) (Figs 8a, 9a, 10a). The boron isotope compositions in the tourmaline grains without distinct core and rim texture distinction are identical, defining a tight δ11B cluster of −13.5 ± 0.17‰ (n = 9) (Figs 8b, c, 9a, 10a).
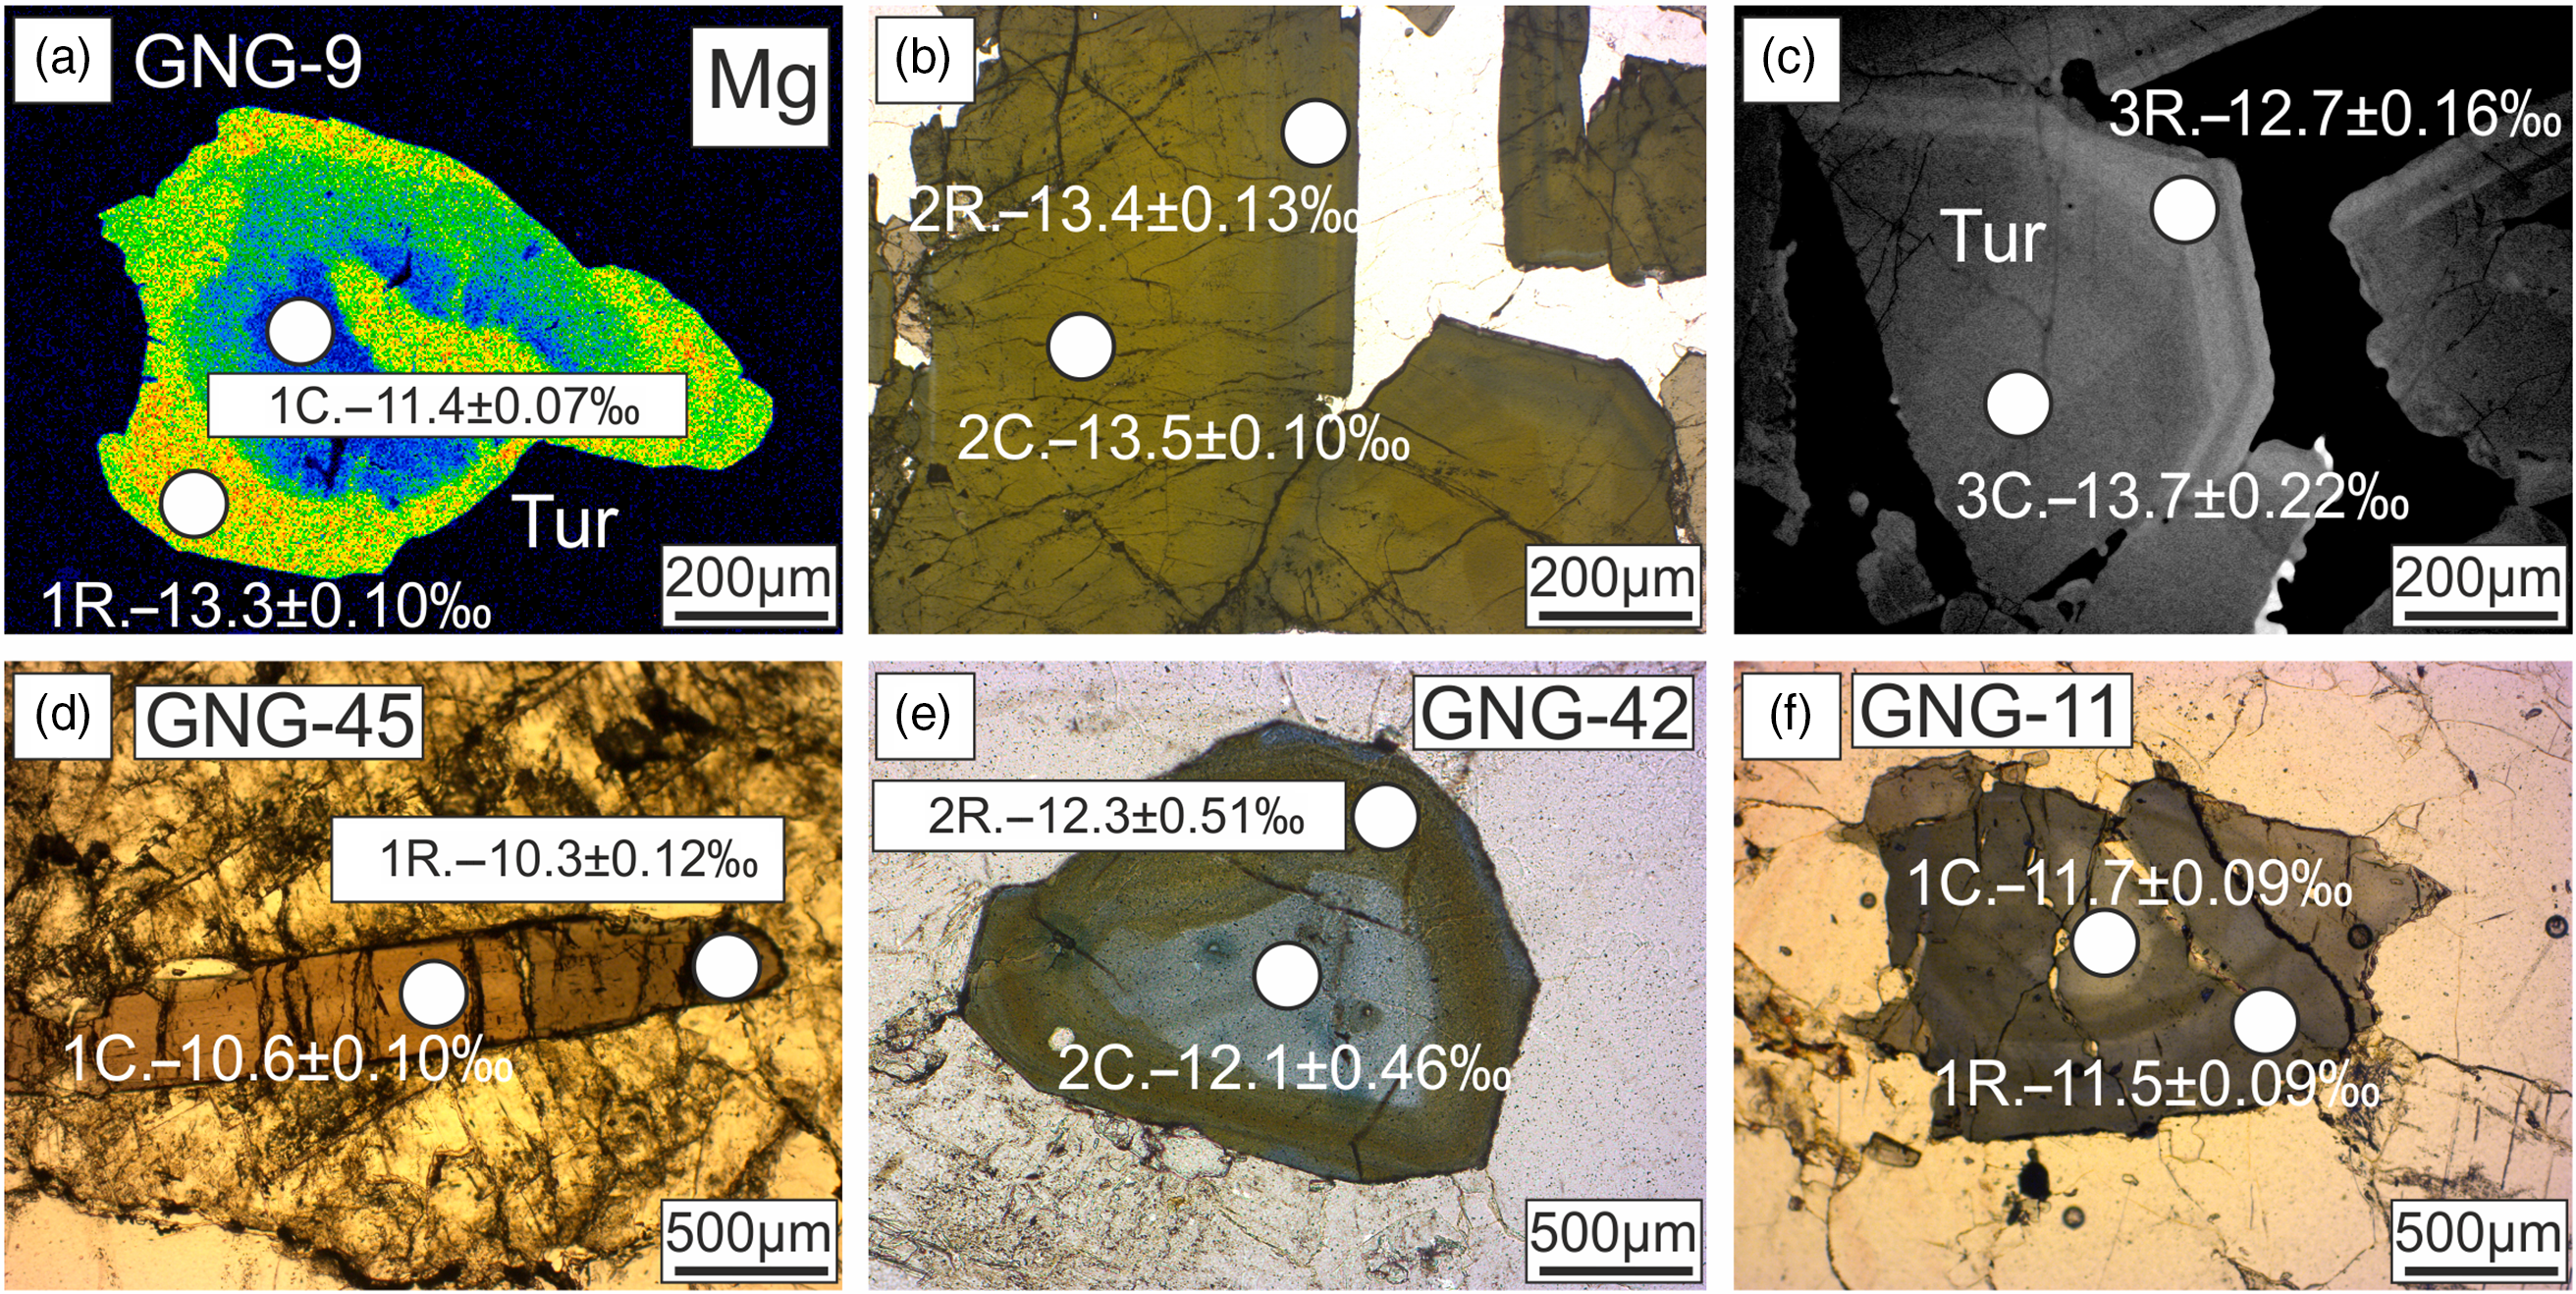
Fig. 8. X-ray elemental images, photomicrographs and BSE images showing the variations of δ11B in different textural zones of tourmaline from the (a–c) Upper Bonai Group granite pegmatite (GNG-9); (d) Gangpur Group granite (GNG-45, 42); and (e, f) Gangpur Group pegmatite (GNG-11).

Fig. 9. Bivariate plot of Mg/(Mg+Fe) versus δ11B for tourmalines from the granitoids of (a) Upper Bonai Group and (b) Gangpur Group. The data points are shown along with the error bars (2SE), representing the internal reproducibility for individual analysis.

Fig. 10. (a–c) Probability density and histogram plots of δ11B ‰ values measured on tourmalines present in granitoids from the Upper Bonai and Gangpur Group. The two black arrows mark the range spanning the δ11B ‰ values reported in this study (0 to −20‰).
In the Gangpur Group granites, the δ11B of tourmalines define two distinct clusters, one at −12.3 ± 0.17‰ (n = 14) (GNG-17, 42, 73A), and the other slightly heavier at −10.8 ± 0.14‰ (n = 13) (GNG-45A) (Figs 8d, 9b, 10b). In tourmalines from pegmatites, no discernible variation in δ11B between core and rim regions of grains is observed (Figs 8e, f, 9b, 10c) with the B-isotope composition being fairly homogeneous across tourmalines from a single sample. However, slight inter-sample variation is noticed, with two samples furnishing slightly different average δ11B values of −12.5 ± 0.11‰ (n = 4) and −11.7 ± 0.08‰ (n = 7) (Figs 9b, 10c).
6.a.3. Trace elements
Cores of Type 1 tourmaline in Upper Bonai Group granite pegmatite have higher light rare earth elements (LREE), Mn, Rb, V, Cu, Y and Zr compared with the rims, which have higher Sr and Zn (Fig. 11a–c). Both tourmaline types are enriched in the LREEs relative to the heavy rare earth elements (HREEs) ((La/Yb)CN = 11–77) and usually display positive Eu-anomalies, with the exception of the Fe-rich cores in type 1 tourmalines that have negative Eu-anomalies (Fig. 11a). The Eu/Eu* ratio is positively correlated with the Ca concentration of the tourmalines and increases in Mg-rich rims (Fig. 11d).
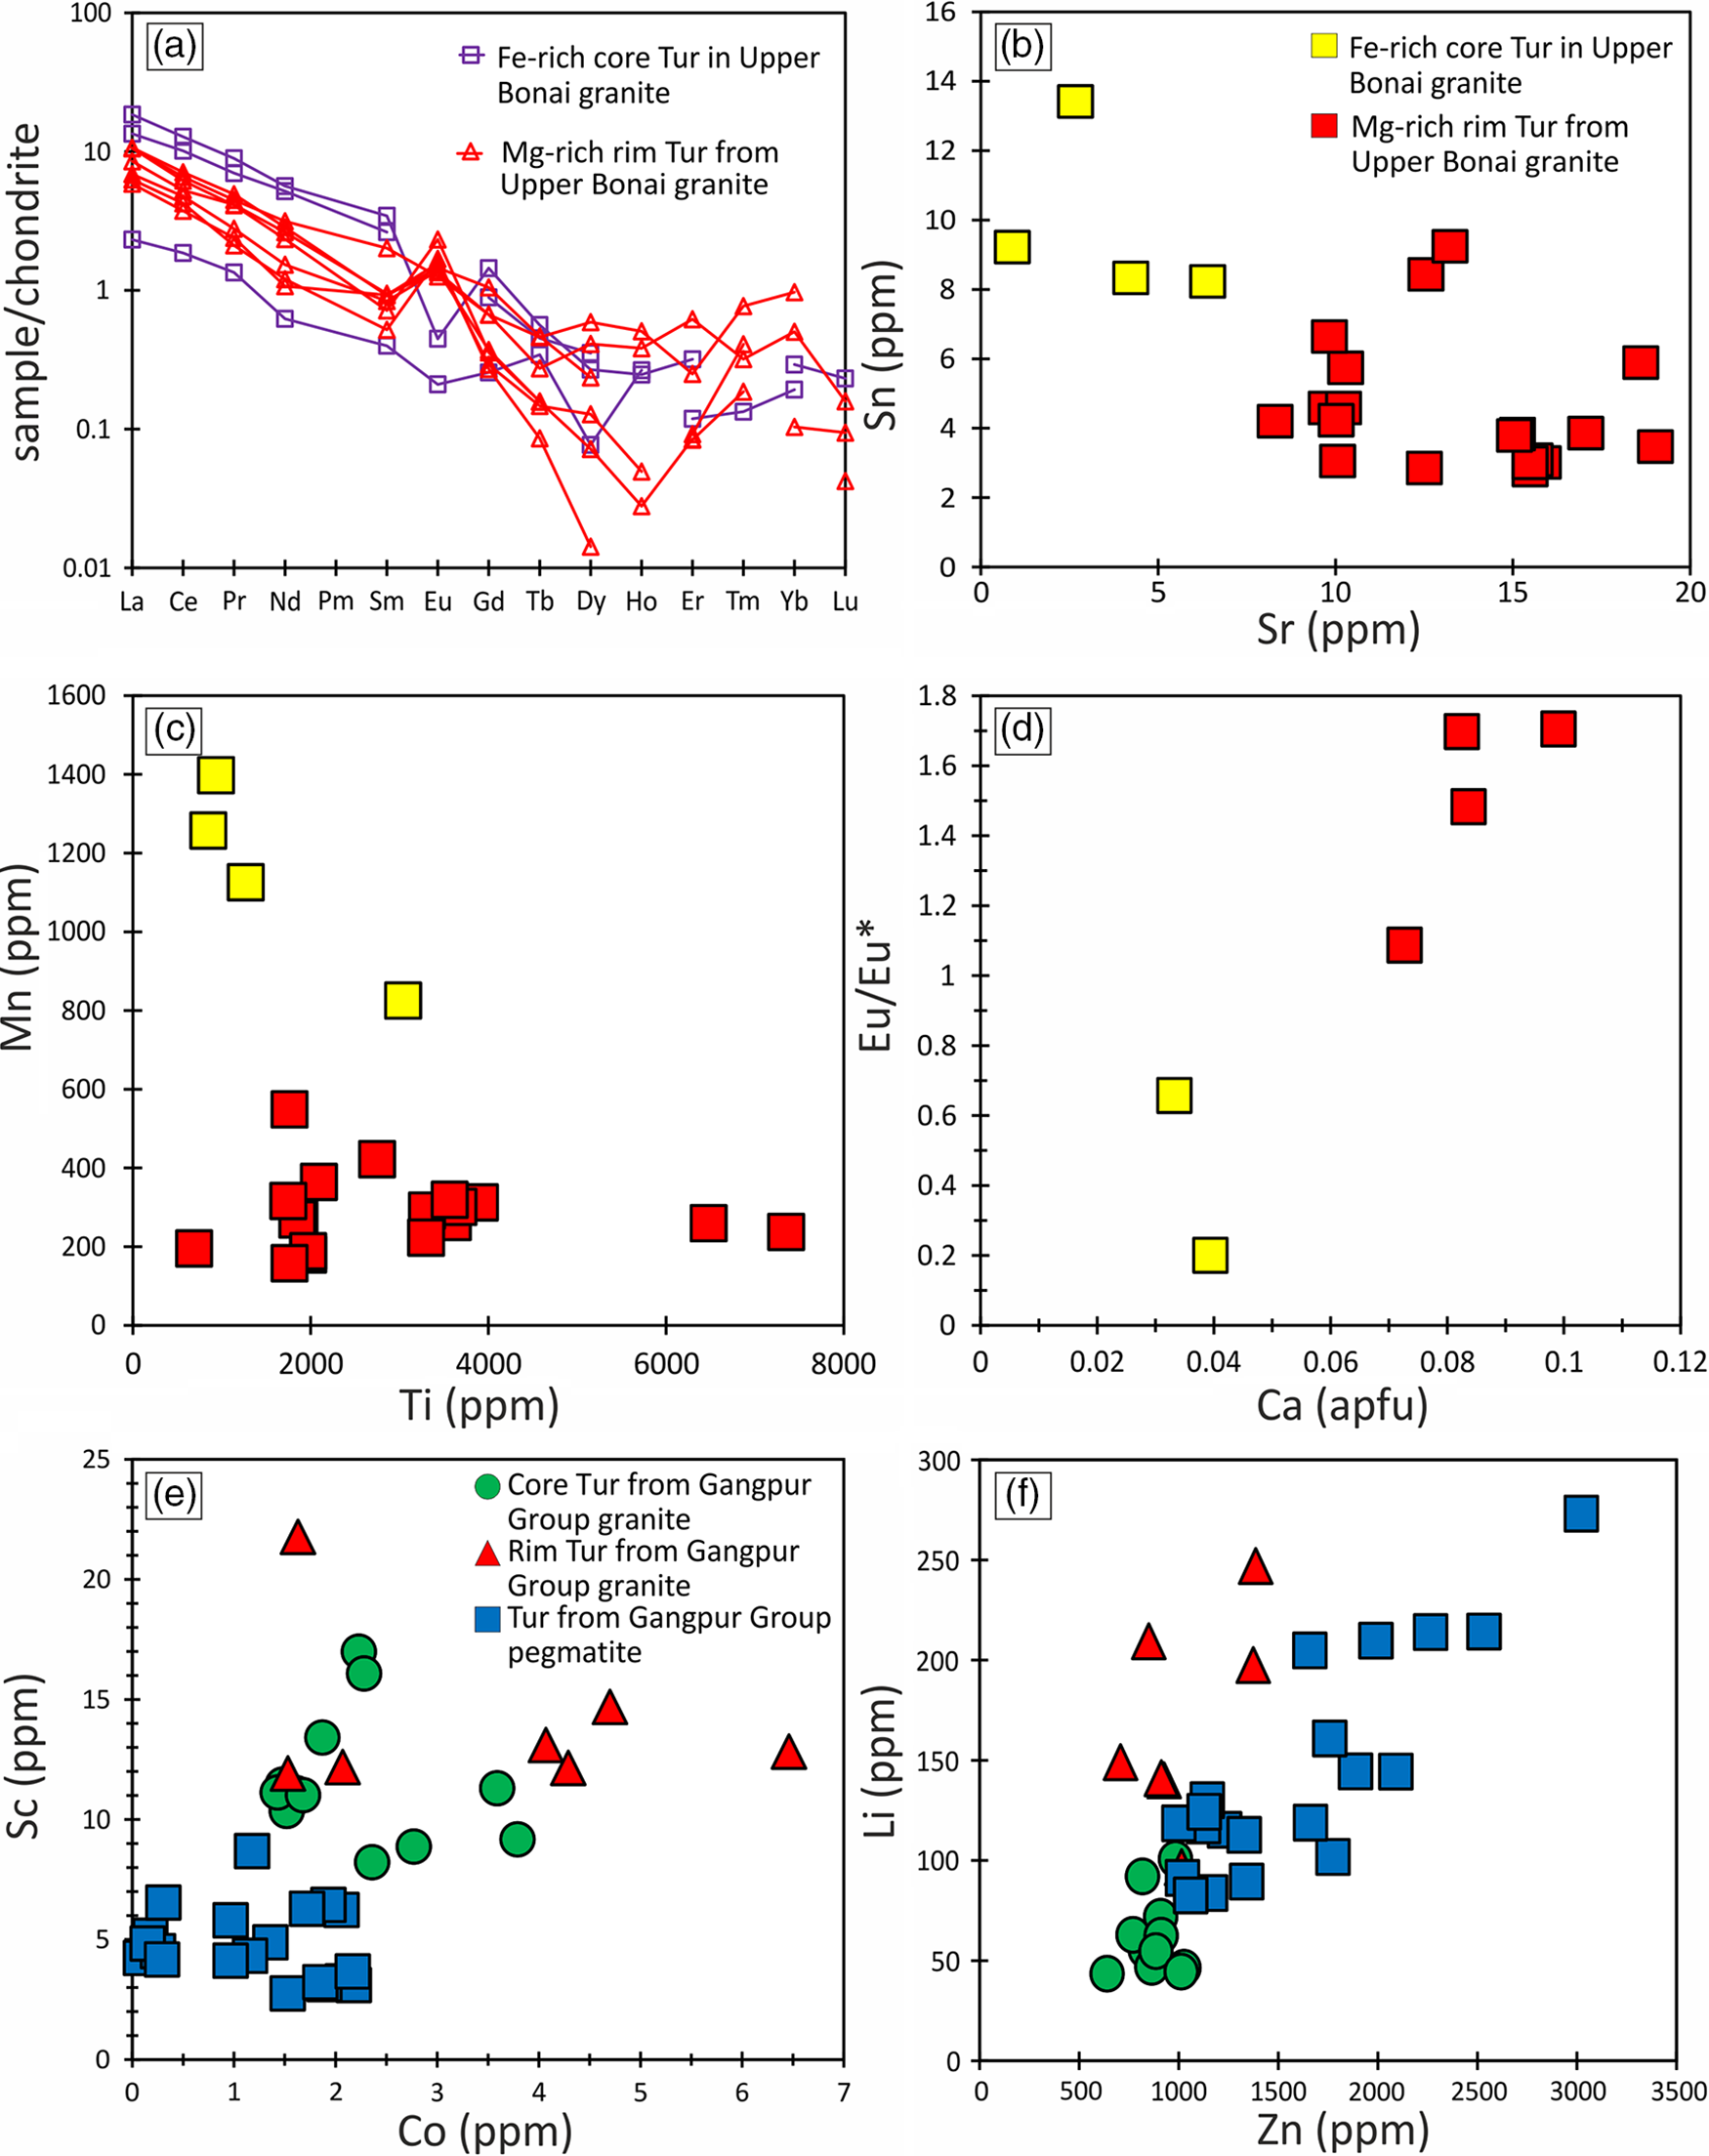
Fig. 11. (a) Chondrite-normalized REE plot for tourmalines from Upper Bonai Group granite pegmatite. The Fe-rich tourmaline shows clear Eu-negative anomaly, whereas the Mg-rich tourmaline displays Eu-positive anomaly. Bivariate plot of (b) Sn versus Sr, (c) Mn versus Ti and (d) Eu/Eu* versus Ca for tourmalines from Upper Bonai Group granite. Note the clear variation in trace-element composition of the Fe-rich and Mg-rich part. Bivariate plot of (e) Sc versus Co and (f) Li versus Zn for tourmaline grains from Gangpur Group granite.
Tourmalines from Gangpur Group granites and pegmatites are enriched in the LREEs (LaN/YbN = 9.1–144) with both positive and negative Eu anomalies (Eu/Eu* = 0.4–2.9). The zoned grains show variations in the concentrations of trace elements, with the cores being enriched in Li, Cr, Zn, Ga, Zr, Sn and Ta and the rims having higher Sr, LREE and Pb. In general, tourmalines from the granites and pegmatites have significantly high concentrations of Li (31–278 ppm), Zn (534–2924 ppm), Ga (54–129 ppm), Sr (4–15 ppm) and Pb (9–13 ppm), with the pegmatite tourmalines showing enrichment of several trace elements relative to those in the granites, and the granitic tourmaline having higher concentration of Sc and Co (Fig. 11e, f).
7. Discussion
7.a. Paragenetic evolution of tourmaline in Gangpur granitoids
Fluid inclusion microthermometric studies from lithological units worldwide indicate that aqueous fluids associated with metapelites, leucogranites and quartz-tourmaline veins may have high salinities (32–47 wt% NaCl equivalent; e.g. Lottermoser, Reference Lottermoser1987; Peretyazhko et al. Reference Peretyazhko, Prokofev, Zagorskii and Smirnov2000; Poutiainen & Partamies, Reference Poutiainen and Partamies2003; Zachariáš et al. Reference Zachariáš, ek, Pudilová and Machovič2005; Orlando et al. Reference Orlando, Ruggieri, Chiarantini, Montegrossi and Rimondi2017; Zucchi et al. Reference Zucchi, Brogi, Liotta, Rimondi, Ruggieri, Montegrossi, Caggianelli and Dini2017). The NaCl content of hydrous melts/fluids is therefore expected to exert a strong control on the composition of tourmaline (e.g. Dini et al. Reference Dini, Mazzarini, Musumeci and Rocchi2008), in addition to bulk composition, P-T conditions and crystallization sequence among others. Recent experimental studies (e.g. Orlando et al. Reference Orlando, Ruggieri, Chiarantini, Montegrossi and Rimondi2017; Zucchi et al. Reference Zucchi, Brogi, Liotta, Rimondi, Ruggieri, Montegrossi, Caggianelli and Dini2017) indicate that, in highly saline fluids, Fe remains complexed with Cl, resulting in the crystallization of Mg-rich tourmalines (Heinrich & Seward, Reference Heinrich and Seward1990; Ding & Seyfried Reference Ding and Seyfried1992; Fein et al. Reference Fein, Hemley, D’Angelo, Komninou and Sverjensky1992; Orlando et al. Reference Orlando, Ruggieri, Chiarantini, Montegrossi and Rimondi2017). The Mg-poor cores of type 1 tourmalines in the Upper Bonai Group granite–pegmatite may represent early formed tourmalines when the hydrous granitic melts had low salinities. The Mg-rich rims represent overgrowths crystallized from highly saline hydrous melts/fluids produced during late-stage crystallization of the granites. The sharp boundary between the core and rim regions is suggestive of episodic tourmaline growth. Such a paragenetic history would explain the patchy re-equilibration of the cores, which must have happened during its interaction with more saline late-stage fluids from which the Mg-rich rims formed. Alternatively, the Fe-rich tourmaline could have been inherited from the sedimentary protolith of the granite, and the Mg-rich rims representing overgrowths formed from high-salinity late-stage hydrous melts/fluids, thus having differences in Eu-anomaly. The wall-rock interaction has been also suggested as a mechanism to increase Mg concentration in tourmaline. However, in the present case, the macroscopic and microscopic textural observations do not support the idea of fluid-rock interaction and rather support the changing conditions within the pegmatite-forming melt itself. The patchy re-equilibration of the cores must have happened during its interaction with more saline late-stage fluids from which the Mg-rich rims formed. The positive Eu-anomaly at the Mg-rich rims of the tourmalines (Fig. 11d) suggests that more oxidizing conditions existed during the precipitation of the rims. The slight decrease in δ11B from the core to the rim and the mantles can be explained by the exsolution/separation of 11B-rich fluid during the fractional crystallization of the granitic magma. The cores of type 2 tourmalines are compositionally similar to the rims of type 1 tourmalines. These may have crystallized from the same late-stage highly saline melts/fluids from which the type 1 rims formed, albeit nucleating as individual crystals rather than forming overgrowths on existing grains. The rims of type 2 tourmalines with XMg lower than the cores formed during a period of renewed tourmaline crystallization from residual melts of lower salinities. Such melts may have formed after the separation of an aqueous high-salinity fluid during late-stage crystallization of the granitic magmas (London, Reference London2005, Reference London2008). The identical δ11B of the cores and the rims of these type 2 tourmaline indicate that there was no significant fractionation of B isotopes during the phase separation.
In the Gangpur Group granites, two tourmaline-forming events can be identified. The patchily zoned cores of grains may be analogous to the cores of type 1 tourmaline in the Upper Bonai Group granite. These may have crystallized from hydrous low-salinity melts/fluids or were inherited. The oscillatory zoned rims can be interpreted to have crystallized from late-stage pegmatitic melts/fluids since they are compositionally similar to the tourmalines in the pegmatites. The pegmatitic tourmalines plot towards the evolved end of the compositional trend defined by the tourmalines from the granites, which is indicative of progressive fractional crystallization in the evolution from granite to pegmatites. The lighter δ11B of the pegmatitic tourmalines compared with the tourmalines from granite also indicate progressive fractional crystallization from granite to pegmatite.
7.b. Melt and fluid source
Due to its strong affinity for fluid/vapour phase, B is an excellent tracer for hydrothermal processes (Palmer & Swihart, Reference Palmer and Swihart1996). Among the two isotopes, 11B (abundance c. 80%) prefers the trigonal species whereas 10B (abundance c. 20%) favours tetrahedral coordination (Kakihana et al. Reference Kakihana, Kotaka, Satoh, Nomura and Okamoto1977). This leads to B isotope fractionations between fluid and solid phases. Lighter δ11B values of −10‰ have been commonly measured in juvenile magmatic rocks or those derived from recycled crust, whereas heavier δ11B values of −6.6 to 4.8‰ are observed in continental detritus, carbonates and authigenic marine clay (Ishikawa & Nakamura, Reference Ishikawa and Nakamura1993).
Previous studies have observed enrichment of 11B in exsolved fluid composition (Palmer & Slack, Reference Palmer and Slack1989; Palmer et al. Reference Palmer, London, Morgan and Babb1992). However, even after many experimental studies, strong disagreement exists about the proper quantification of B-isotope fractionation in melt-fluid systematics. Different studies suggest that the melt-fluid fractionation of tourmalines often varies according to a plethora of factors, including temperature, composition of the tourmaline as well as host, host–granite interaction and coordination of B with oxygen (Palmer & Swihart, Reference Palmer, Swihart, Grew and Anovitz2002; Meyer et al. Reference Meyer, Wunder, Meixner, Romer and Heinrich2008; Marschall et al. Reference Marschall, Korsakov, Luvizotto, Nasdala and Ludwig2009; Trumbull et al. Reference Trumbull, Beurlen, Wiedenbeck and Soares2013). The mineral-melt fractionation has been observed to systematically deplete granite melt in heavier B-isotope (Peacock & Hervig, Reference Peacock and Hervig1999; Kaliwoda et al. Reference Kaliwoda, Marschall, Marks, Ludwig, Altherr and Markl2011). The only thing that is established beyond reasonable doubt is the enrichment of 11B in exsolved fluid with respect to the associated granitic melt. S-type granites usually acquire significant amounts of B from source sediments, and become further enriched in B during later stages of fractional crystallization (Pesquera et al. Reference Pesquera, Torres-Ruiz, Garcia-Casco and Gil-Crespo2013). Higher concentration of Si and water in their parental magmas favours tetrahedral coordination of boron over the trigonal coordination. As S-type granitic melts are enriched in silica and water, a large proportion of their B is in tetrahedral coordination (Smith & Yardley, Reference Smith and Yardley1996; Trumbull & Chaussidon, Reference Trumbull and Chaussidon1999). Boron is incorporated in the tourmaline structure through pseudo-tetrahedral surface complexes (Palmer & Slack, Reference Palmer and Slack1989; Palmer et al. Reference Palmer, London, Morgan and Babb1992). The similarity of boron coordination in tourmaline (pseudotetrahedral) and melt (tetrahedral) leads to very little isotopic fractionation between granitic melt and tourmalines crystallizing from it (Palmer et al. Reference Palmer, London, Morgan and Babb1992; Smith & Yardley, Reference Smith and Yardley1996). However, in case of volatile phase separation during late-stage differentiation of granitic melt, the difference in boron coordination between fluid (BIII) and melt (BIV) leads to enrichment of 11B in the exsolved fluid. Palmer et al. (Reference Palmer, London, Morgan and Babb1992) observed systematic enrichment of 10B in tourmaline crystallizing from hydrothermal fluids with 11B preferentially partitioning into the co-existing fluids at all P-T conditions. This change in B-coordination leads to temperature dependent isotopic fractionation between the hydrothermal fluids and the tourmalines crystallizing from them. In the Upper Bonai Group granite pegmatite, the Mg-poor type 1 tourmalines were the earliest to crystallize from the granitic melt. Hence, their δ11B of −11.8 ± 0.84‰ is the closest estimate of the B isotope composition of the parent granitic melt. The later crystallizing tourmalines (Mg-rich tourmalines as type 1 rims and type 2 cores) have lighter δ11B (c. −13.5 ± 0.17‰), which can be explained by crystallization of tourmaline from 10B-rich residual magmas formed by vapour/fluid exsolution. The type 2 tourmalines in the pegmatites may have formed from (1) late-stage melts that had previously undergone vapour exsolution, making it isotopically lighter, or (2) exsolved hydrothermal fluids themselves. The major- and trace-element characteristics of tourmalines from the Upper Bonai granite pegmatite indicate crystallization from late-stage granitic melt in support of the above model for their origin (Fig. 12). A similar petrological process can be envisaged for the genesis of tourmalines in Gangpur Group granites and pegmatites. Based on the above discussion, it can be inferred that the heaviest δ11B value of −10.8‰ measured in tourmalines from Gangpur Group S-type granites represents the closest estimate of the B isotope composition of the granitic melts. The lighter δ11B value of c. −12.5‰ measured mostly from tourmalines in the pegmatite represent crystallization from late-stage melts formed after vapour phase separation (Fig. 12).
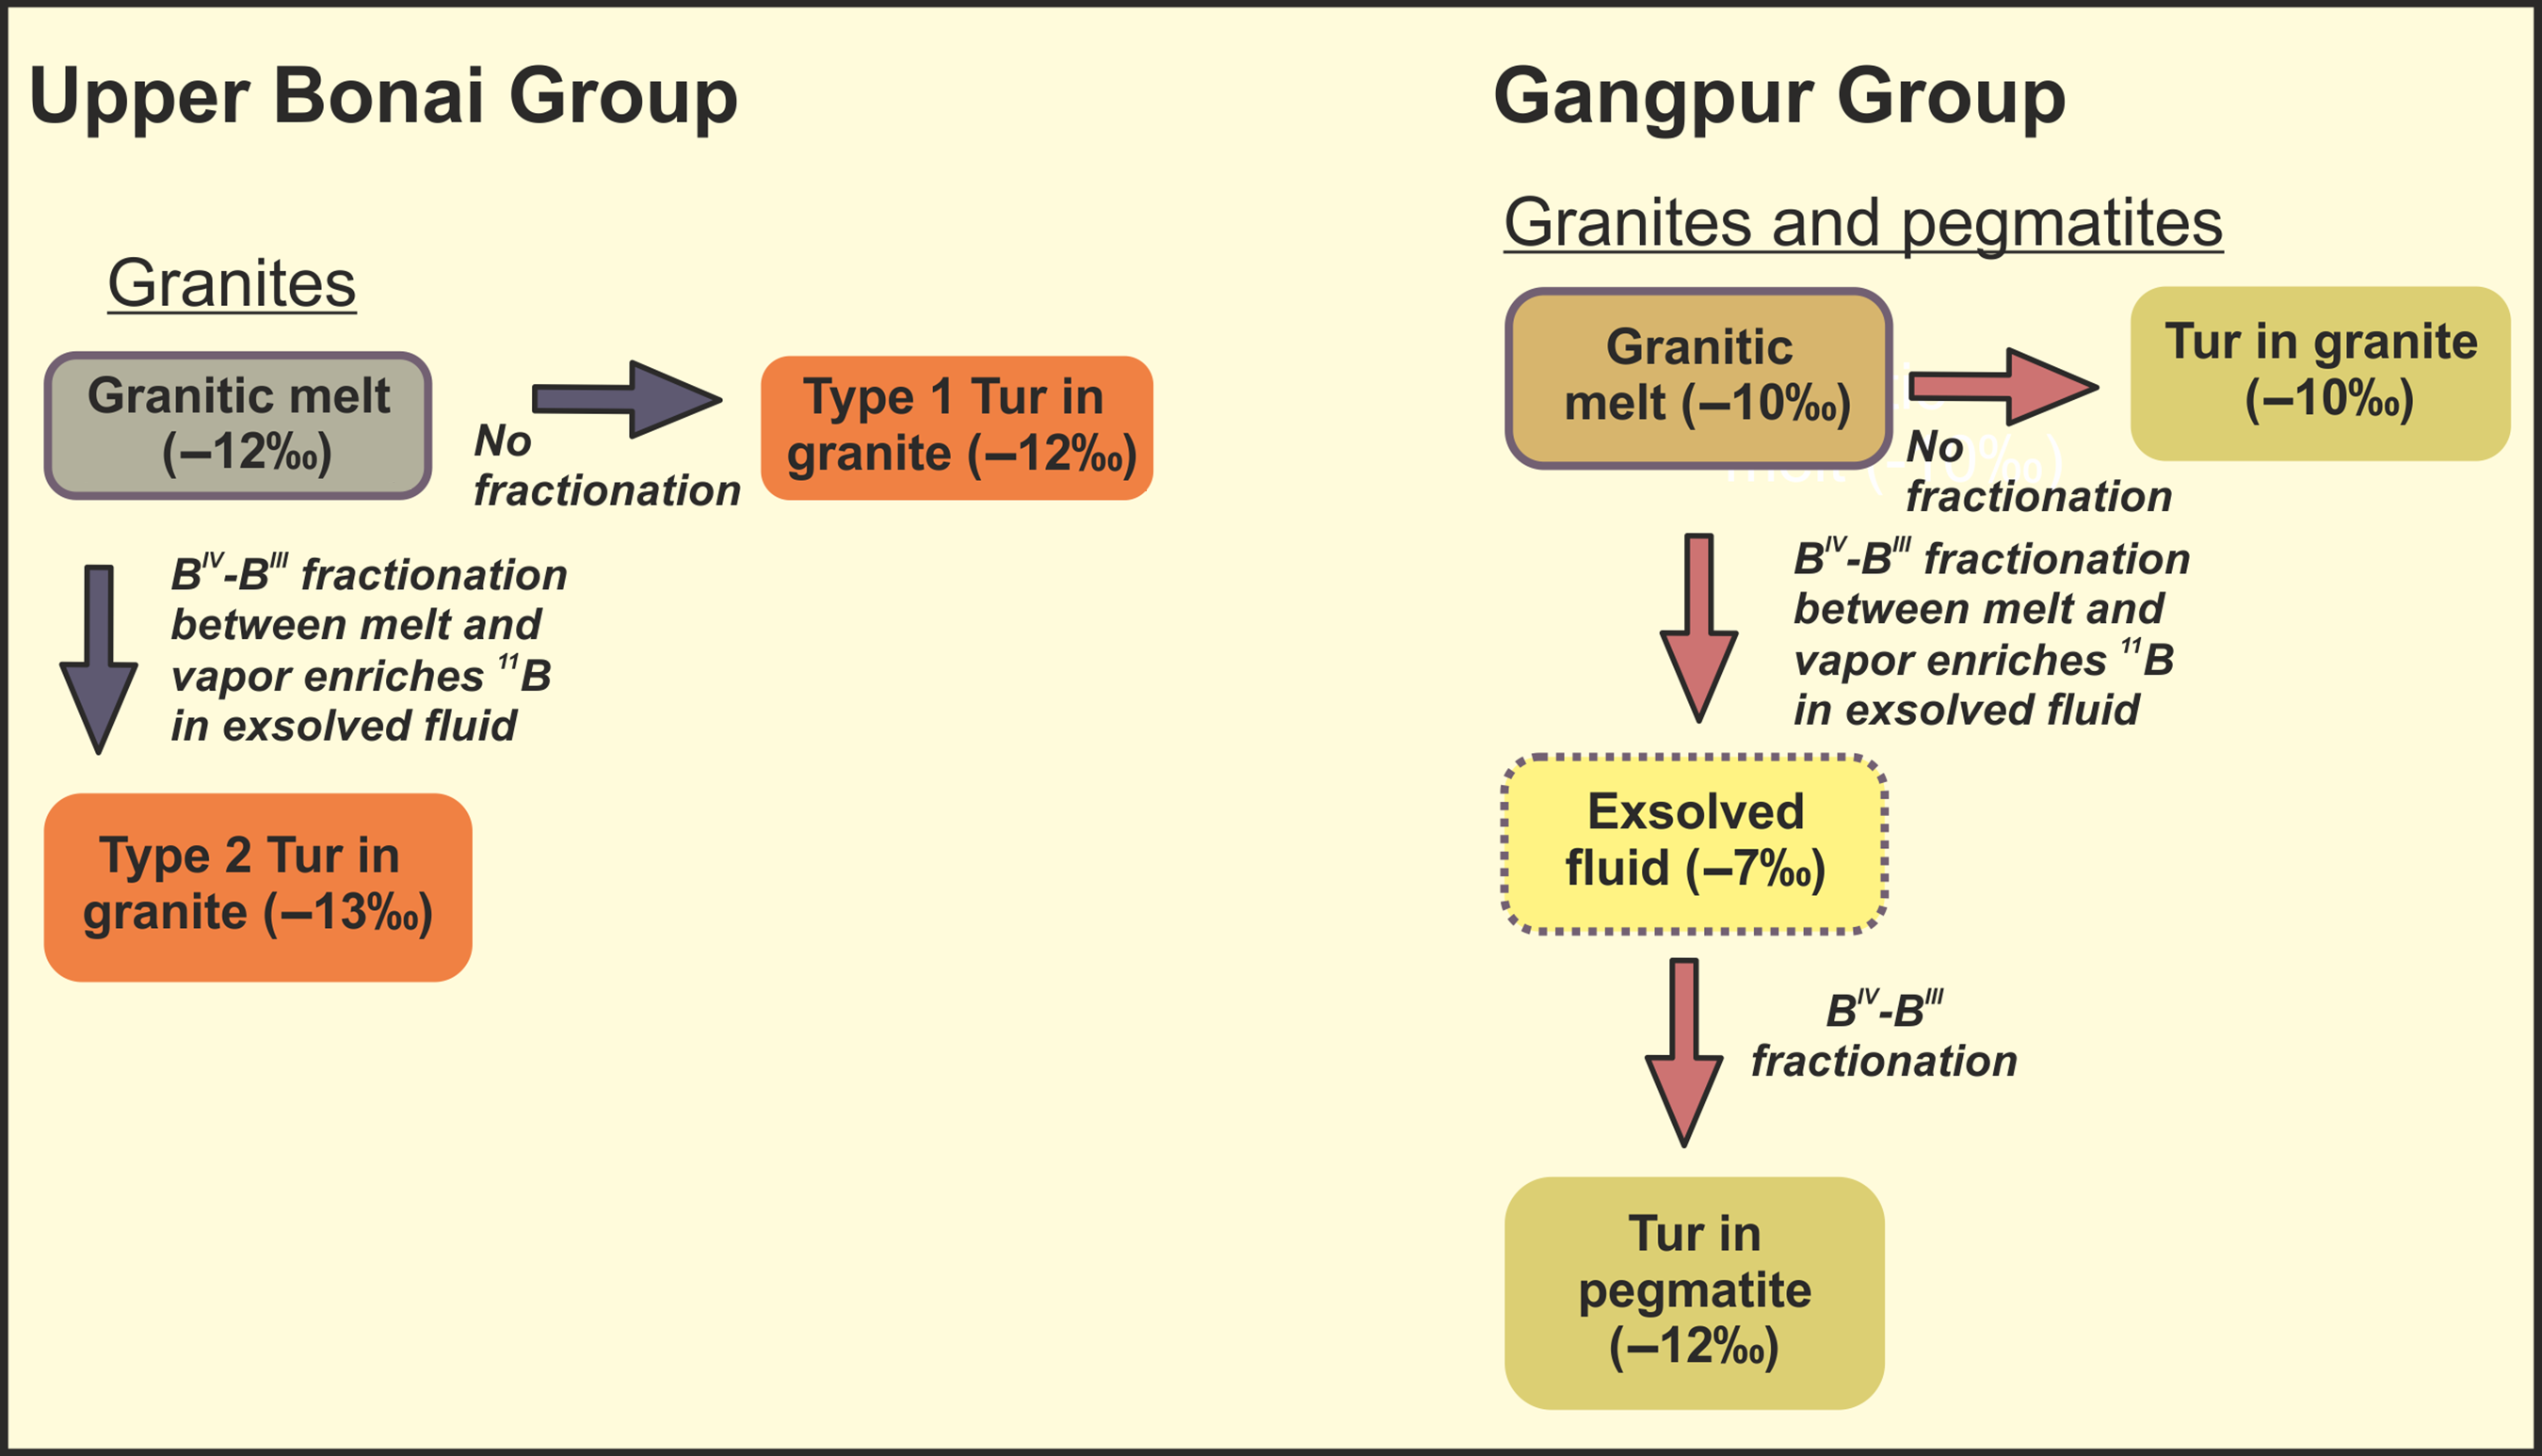
Fig. 12. Summary of the paragenetic evolution of tourmalines in the Upper Bonai and Gangpur Group granitoids.
7.c. Implications for granite-to-pegmatite transition
The early models of pegmatite crystallization envisioned crystallization from a highly viscous supersaturated melt formed due to excessive undercooling prior to crystallization, where the growth of large crystals was attributed to slow cooling rates below liquidus temperatures (Jahns & Burnham, Reference Jahns and Burnham1969; Lofgren, Reference Lofgren and Hargraves1980; Fenn, Reference Fenn1986; London et al. Reference London, Morgan and Hervig1989). The presence of graphic texture in most pegmatites led London (Reference London2009) to propose that pegmatites form by a high degree of undercooling of evolved granitic melts. The build-up of flux-enriched boundary layer along the crystal growth front causes crystals to grow to larger sizes due to rapid diffusion through less viscous, flux-enriched boundary-layer liquid. The tourmalines in the pegmatites of the GSB are enriched in Li, B, P and Be compared with their granitic counterparts. The pegmatitic tourmalines also have higher Zn and Pb concentrations. This can be attributed to the preference of these elements for hydrous borosilicate melts over silicate melt (Galbraith et al. Reference Galbraith, Clarke, Trumbull and Wiedenbeck2009; Drivenes et al. Reference Drivenes, Larsen, Muller, Sorensen, Wiedenbeck and Raanes2015; Hazarika et al. Reference Hazarika, Mishra and Pruseth2015, Reference Hazarika, Upadhyay and Pruseth2016). The higher Pb and Zn concentrations of tourmalines in the pegmatites suggest that the pegmatitic tourmalines crystallized from granite-derived late-stage melts. The lighter δ11B of the pegmatitic tourmalines strongly indicate that they crystallized from a more evolved isotopically lighter late-stage melt derived from the S-type granites. The high concentration of flux-bearing elements and the evolved nature of the melt from which tourmalines in the pegmatites crystallized indicate that a late-stage melt formed after the crystallization of the granites and is probably responsible for the formation of the pegmatites with the help of fluxing agents such as Li, Be, P and B.
8. Conclusions
The δ11B values of around −10‰ present in the tourmalines from the Gangpur and Upper Bonai Group granitoids indicate a dominantly continental metapelite source, coherent with the genesis of the S-type granites. The B-isotope composition of the tourmalines from the Gangpur and Upper Bonai Group granitoids are quite similar (c. −10‰ to −13‰). This indicates that, although the source sediments that have melted to form S-type granites and pegmatites have been deposited in different geological times, their B-isotopic composition remains broadly similar. The few minor local changes of the boron isotope compositions observed in a single tourmaline crystal is possibly a result of a different diffusivity of boron in a viscous granitic melt (Maner & London, Reference Maner and London2017). The otherwise mostly constant isotopic composition of tourmalines in the granites is possibly due to the much higher growth rate of the tourmalines than the diffusivity of boron in the granitic melt (London, Reference London1992, Reference London2008). The magmatic, late-magmatic and hydrothermal tourmalines in S-type granites/pegmatites in both the Upper Bonai and Gangpur Group are all characterized by high Zn and Pb concentrations. Our findings insinuate that in the Gangpur Group pegmatite tourmalines may have crystallized from a more evolved flux-rich granitic-composition melt.
Acknowledgements
The trace element and B-isotope data were generated at the Diamond Jubilee Radiogenic Isotope Facility of the Department of Geology and Geophysics, IIT Kharagpur. Dr Dewashish Upadhyay is thanked for access to the Diamond Jubilee Radiogenic Isotope Facility. Professor Biswajit Mishra is thanked for access to the DST funded EPMA National Facility of the Department. The author is grateful to Dr Philip M. Piccoli and Dr John F. Slack for providing the tourmaline standards used for B-isotopic study. TC acknowledges the financial support from the Council of Scientific and Industrial Research, New Delhi through a PhD fellowship. I would also like to thank two anonymous reviewers and handling editor Dr Kathryn Goodenough for the constructive comments which have greatly improved the quality of the manuscript.
Conflict of interest
None.
Supplementary material
To view supplementary material for this article, please visit https://doi.org/10.1017/S0016756821000224