


Introduction
Fildes Peninsula, located on the south-west of King George Island, South Shetland Islands, is 8 km long and 2.5–4.5 km wide. It has an area of 38 km2 and is one of the largest ice-free areas on King George Island. During the Last Glacial Maximum and early Holocene, Fildes Peninsula was covered by ice and gradually evolved into a coastal ice-free area through glacier melting and glacial isostatic adjustment (GIA) (Watcham et al. Reference Watcham, Bentley, Hodgson, Roberts, Fretwell, Lloyd, Larter, Whitehouse, Leng, Monien and Moreton2011). The uplifting process in Fildes Peninsula led to the formation of various marine features at different elevations: raised beaches, raised fjords (e.g. Grande Valley) and isolated lakes (e.g. Long Lake, Yanou Lake, Xi Lake and Kitezh Lake) (Tatur et al. Reference Tatur, del Valle, Barczuk and Martinez-Macchiavello2004).
In Antarctica, the history of relative sea level (RSL) change in the Holocene has been reconstructed using radiocarbon dating of organic residues incorporated in raised marine deposits (Watcham et al. Reference Watcham, Bentley, Hodgson, Roberts, Fretwell, Lloyd, Larter, Whitehouse, Leng, Monien and Moreton2011). Changes in RSL are the result of interactions between eustatic sea level and GIA, and reconstruction of RSL changes helps in studying the relationship between glacial fluctuation and climate change (Simms et al. Reference Simms, DeWitt, Kouremenos and Drewry2011a). Watcham et al. (Reference Watcham, Bentley, Hodgson, Roberts, Fretwell, Lloyd, Larter, Whitehouse, Leng, Monien and Moreton2011) used five sequences of lake deposits (Long Lake, Yanou Lake, Belén Lake, Gaoshan Lake and Ardley Lake) to reconstruct the RSL changes of Fildes Peninsula. They found a tendency of gradual decline in RSL in Fildes Peninsula since 8000 cal. yr bp, consistent with the RSL variations of the South Shetland Islands reported by Schmidt et al. (Reference Schmidt, Mäusbacher and Müller1990).
Glacial fluctuation and climate change at Fildes Peninsula have been well studied. Mäusbacher et al. (Reference Mäusbacher, Muller and Schmidt1989) reported a potential ice retreat during 9000–5000 cal. yr bp using the records from three lake cores in front of Collins Glacier. Sun et al. (Reference Sun, Liu, Yin, Xie and Zhao2005) investigated the palaeoenvironment evolution in the areas surrounding the Chinese Great Wall Station, Fildes Peninsula, using a sediment profile from a palaeo-notch at 47 m a.m.s.l. (above mean sea level) and inferred a moderate chemical weathering rate and a relatively warm climate during 4000–3000 cal. yr bp. Milliken et al. (Reference Milliken, Anderson, Wellner, Bohaty and Manley2009) and Simms et al. (Reference Simms, Milliken, Anderson and Wellner2011b) suggested that the oldest glaciomarine deposit in Maxwell Bay dated back to 14 800 cal. yr bp, the bay has been ice-free since 5900 cal. yr bp, and that the Neoglacial period started at 2600 cal. yr bp.
However, there is limited research using marine records to reconstruct the sedimentary environment and climate change during the Holocene. In this study, we aimed to use raised palaeofjord deposits collected in Grande Valley to reconstruct the sedimentary environment and climate change during the Holocene at Fildes Peninsula and to lay the foundation for further study. The chronological constraints on RSL change were also examined.
Material and methods
Study area and materials
Located on the west coast of Fildes Peninsula, Antarctica, Grande Valley is surrounded on three sides by highlands and lies several kilometres off the edge of the Collins and Nelson glaciers (Fig. 1). Grande Valley had a relatively shallow Antarctic fjord environment prior to 2000 cal. yr bp (Chu et al. Reference Chu, Sun, Huang, Huang and Zhou2016). Despite being below sea level during the early and mid-Holocene, the coastal areas of Grande Valley in modern days are home to a diverse array of vegetation and sea animals, including Weddell and elephant seals, sea lions, and Adélie, chinstrap and gentoo penguins.
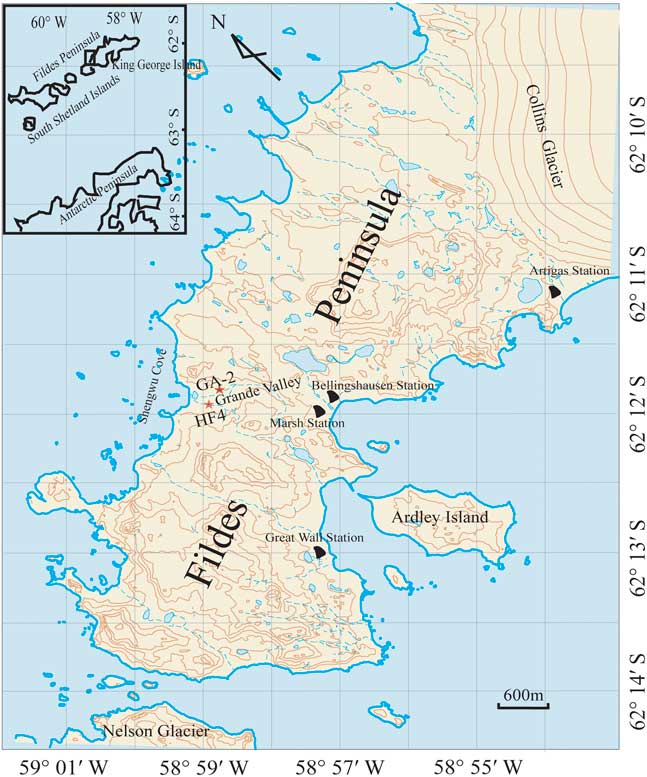
Fig. 1 Location of Grande Valley on Fildes Peninsula, Antarctica, and the sampling site for GA-2. HF4 represents the site of a sediment core of seal excrement deposits.
The GA-2 sediment core (62°11′46′′S, 58°58′20′′W) is 9.24 m long and was collected from the second terrace of an altitude of 12.5 m a.m.s.l. with an error ±1.0 m in Grande Valley during a drilling programme conducted by the Chinese Great Wall Station. The upper boundary of GA-2 was 12.5 m a.m.s.l. with an error ±1.0 m and the lower boundary was 2 m a.m.s.l. with an error ±1.0 m. GA-2 was without broader stratigraphic control and formed in a shallow fjord environment.
Methods
The GA-2 sediment core was split, photographed and documented at the sampling site. A total of 707 samples were taken at 1 cm intervals, except for depositional layers that contained large detritus. The sediment core was divided into five sections of variable lengths (units 1 to 5).
Twenty samples were chosen for accelerator mass spectrometry (AMS) 14C dating using bulk acid insoluble organic carbon at the Center for Applied Isotope Studies, University of Georgia, USA. The bulk sediment samples were treated with 5% HCl at 80°C for one hour, washed with deionized water and dried at 60°C. The cleaned sample was combusted at 900°C in sealed ampoules in the presence of CuO and graphite. The sample 14C/13C ratios were measured using the CAIS 0.5 MeV accelerator mass spectrometer and compared to the ratio measured for oxalic acid I (NBS SRM 4990). The validity of the chronology was confirmed by comparing the inferred geochemical and geophysical parameters with previous studies (Chu et al. Reference Chu, Sun, Huang, Huang and Zhou2016). The radiocarbon dates were calibrated using the CALIB 7.0 program assuming a marine reservoir effect of 1300 years (Chu et al. Reference Chu, Sun, Huang, Huang and Zhou2016).
According to lithological descriptions taken at the sampling site, 278 representative samples of 2.5 g were selected at ~3 cm intervals (except for depositional layers that contained large detritus) for analysis of loss on ignition at 550°C (LOI550°C) in a muffle furnace with a systemic error<1% (Liu et al. Reference Liu, Zhao, Sun, Luo, Yin, Xie, Wang, Liu, Wu, Ding and Fu2006, Chu et al. Reference Chu, Sun, Huang, Huang and Zhou2016).
Then 271 samples of ~0.25 g were selected at ~3 cm intervals (except for depositional layers that contained large detritus), coarse-grained sediments with diameter>2000 μm were filtered out and the samples were weighed, digested (H2O2, HCl) and analysed for grain size from 0.04 to 2000 μm using an LS13320 laser particle analyser with an error<2% (Zhou et al. Reference Zhou, Sun, Huang, Cheng and Jia2012).
Next, 272 samples of ~10 g were selected at ~3 cm intervals (except for depositional layers that contained large detritus), weighed and analysed for mass magnetic susceptibility (MS) using an MS2 susceptibility meter. The field intensity and the frequency used for the measurements were 250 μT (peak value) with an error ±10% and 0.465 kHz (low frequency) with an error ±1%, respectively (Zhou et al. Reference Zhou, Sun, Huang, Cheng and Jia2012).
Further samples (~0.25 g) were selected at ~12 cm intervals (except for depositional layers that contained large detritus), weighed and dissolved by mixed acid (HClO4, HF, HCl, H2SO4) in a Teflon crucible with electric heating and subsequently analysed for Sr, Ba, B and Ga by inductively coupled plasma-optical emission spectroscopy. A total of 77 samples were used for Sr and Ba analysis and 64 for B and Ga analysis. Standard sediment references (GSD-2, GSD-5) were included with every batch of samples. The analytical errors for Sr, Ba, B and Ga were within ±0.5% of the certified standards (Liu et al. Reference Liu, Zhao, Sun, Luo, Yin, Xie, Wang, Liu, Wu, Ding and Fu2006).
Results
Element ratios of Sr/Ba, B/Ga and content of acid-soluble Sr
In GA-2, the Sr, Ba, B and Ga content ranged from 235–688, 70–170, 70–230 and 70–190 µg g-1, respectively. The ratio of Sr/Ba ranged from 1.1–10.6 and the ration of B/Ga ranged from 2.2–9.7.
Chronology
When AMS 14C dating was performed on 20 bulk sediments from GA-2, the determined ages down the sediment core were not in chronological order as expected. The surface sediment may have been corroded or contaminated by modern materials, so its age was calculated through extrapolation. Thus five samples, S-1-23, S-9-2, S-16-33, S-17-41 and S-21-3, were selected based on their lithology and grain size distribution, and these dates were used to build a chronology for the GA-2 sediment core (Table I). The sediment core has a calibrated age between 6600 and 2000 cal. yr bp.
Table I Dating results of the five samples used to establish the chronology for GA-2. The radiocarbon dates were calibrated using the CALIB 7.0 program assuming a marine reservoir effect of 1300 years (Chu et al. Reference Chu, Sun, Huang, Huang and Zhou2016).
Lithologic descriptions, loss on ignition, grain size and magnetic susceptibility
In GA-2, LOI550°C ranged from 1–7%, median grain size (Mz) ranged from 9–324 μm and MS ranged from 365x10-8 to 2650x10-8 m3 kg-1. Five main lithologic units were identified on the basis of lithology, LOI550°C, Mz and MS.
Unit 1 (9.24–7.10 m) was dated at 6600–5800 cal. yr bp. This unit was composed of dark grey silty mud and some semi-angular gravel, and contained large gravel of ~3 cm in diameter. The unit was characterized by a relatively high LOI550°C of ~5.2% and a high average MS of 1500x10-8 m3 kg-1. The average value of Mz was low at ~23 μm (Fig. 2).
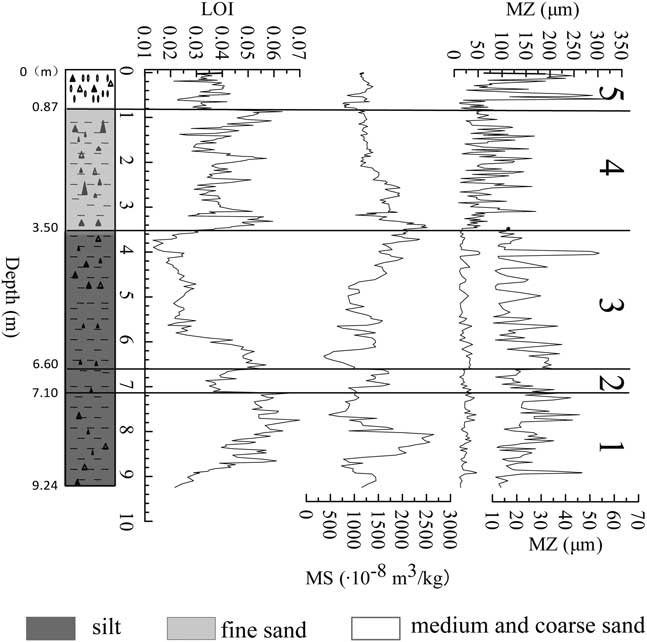
Fig. 2 Profiles of loss on ignition (LOI), grain size (Mz) and magnetic susceptibility (MS). Five main units were identified according to lithology, LOI, Mz and MS: unit 1 (9.24–7.10 m), unit 2 (7.10–6.60 m), unit 3 (6.60–3.50 m), unit 4 (3.50–0.87 m) and unit 5 (0.87–0 m). Two separate curves are shown for Mz: i) for units 1–5 (0–350 μm) and ii) for only units 1–3 (10–70 μm) which better displays the size variations of these units.
Unit 2 (7.10–6.60 m) was dated at 5800–4800 cal. yr bp. The unit was characterized by grey silty mud and rare, poorly preserved gravel clasts. In this unit, LOI550°C significantly decreased (3–4%, mean 3.8%). The average MS was 1000x10-8 m3 kg-1, lower than unit 1, and Mz was also low at 30 μm (Fig. 2).
Unit 3 (6.60–3.50 m) was dated at 4800–4400 cal. yr bp. This unit was composed of grey silty mud and semi-angular gravel, and contained large gravel of ~5 cm in diameter. At 6.60–5.90 m, LOI550°C briefly rose to 5.6% (mean 4.7%), the average MS was 1090×10-8 m3 kg-1 and Mz was low at ~25 μm. At 5.90–3.50 m, LOI550°C rapidly fell to a mean of 2.2%, MS gradually rose to 1500x10-8 m3 kg-1 and the average Mz was 25 μm (Fig. 2).
Unit 4 (3.50–0.87 m) was dated at 4400–2700 cal. yr bp. This unit was composed of grey fine sand with a little silt and semi-rounded gravel, and contained large gravel. This unit was characterized by sharply fluctuating LOI550°C with a maximum of 6.1% and an average of 4.1%. The MS followed a decreasing trend with an average of 1500x10-8 m3kg-1. Finally, Mz had an obvious increase from 11 to 170 μm with a mean of 65 μm (Fig. 2).
Unit 5 (0.87–0 m) was dated at 2700–2000 cal. yr bp. This unit was characterized by coarse sand (>2000 μm in diameter) with a little fine sand and silt, and the surface of the core (0–0.10 m) contained grey soil. The LOI550°C was low at ~3.4%, MS exhibited little change (mean 1130x10-8 m3kg-1) and Mz was large with a mean of 140 μm (54–324 μm) (Fig. 2).
Discussion
Depositional rate of GA-2
The average deposition rate for GA-2 was 2.0 mm a-1 and it showed substantial variations in different periods (Fig. 3). The deposition rate was slow before 4800 cal. yrbp, but increased to ~17.1 mm a-1 between 4800–4400 cal.yrbp. Similar deposition rates of marine sediments have been reported in nearby areas. Kirby et al. (Reference Kirby, Domack and McClennen1998) reconstructed the average deposition rate of a nearshore sediment core (DF85-63) from Palmer Deep, Antarctic Peninsula, at 3.8 mma-1 with a maximum rate>20.0 mm a-1. Yoon et al. (Reference Yoon, Park, Kim and Kim2000) estimated that the maximum deposition rate in a sediment core (S-19) from Maxwell Bay was ~2.32 mma-1 with a minimum of ~0.24 mma-1. They also reconstructed an average deposition rate of ~3.8 mm a-1 for a sediment core (S-2) from Admiralty Bay, South Shetland Islands (Yoon et al. Reference Yoon, Park, Kim and Kim2000).
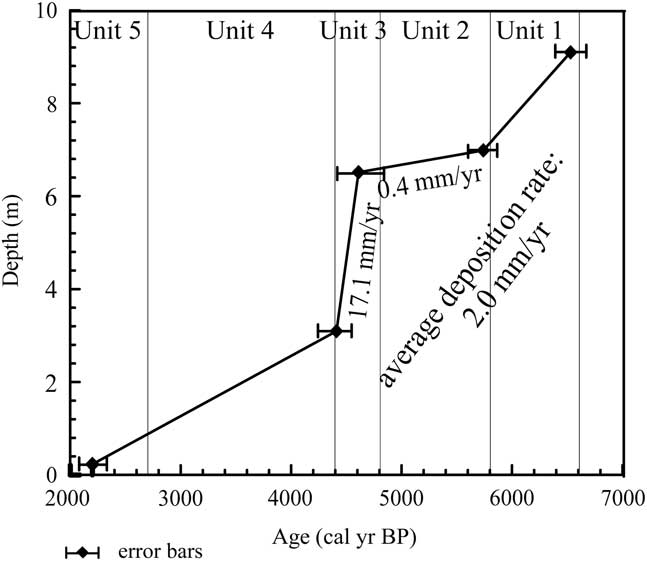
Fig. 3 Deposition rates for the sediment core GA-2.
Sedimentary environment of GA-2
The ratios of Sr/Ba and B/Ga in sediments are commonly used proxies for palaeosalinity of oceans and lakes. The sedimentary environment is considered lacustrine if the Sr/Ba ratio is<1.0 and oceanic otherwise (Chen et al. Reference Chen, Chen and Zhang1997). The B/Ga ratios of freshwater deposits, nearshore deposits and marine deposits are typically<1.5, 1.5–6 and>7, respectively. However, it is generally accepted that a sedimentary environment is of marine nature if B/Ga is>3.3 (Yan & Xu Reference Yan and Xu1987, Chen et al. Reference Chen, Chen and Zhang1997).
The Sr/Ba and B/Ga ratios in the sediment core were calculated to determine the palaeosedimentary environment at Grande Valley. Although Sr/Ba varies at different depths it is consistently>1.0 indicating a marine environment throughout the formation of GA-2 (Fig. 4). The B/Ga ratio is>1.5 through the entire core and>3.3 for most parts, except for the upper 0.7 m and 2–5 m parts of the core, providing further confirmation of a marine sedimentary environment (Chu et al. Reference Chu, Sun, Huang, Huang and Zhou2016). Thus GA-2 was formed in a marine environment and its organic materials came primarily from sea (Chu et al. Reference Chu, Sun, Huang, Huang and Zhou2016).
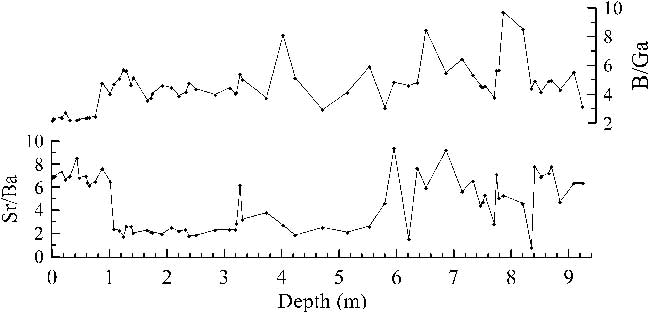
Fig. 4 Ratios of Sr/Ba and B/Ga for verification of sedimentary environments in GA-2.
Sedimentary environment evolutions of site GA-2 in Grande Valley
Björck et al. (Reference Björck, Håkansson, Olsson, Barnekow and Janssens1993) demonstrated that Fildes Peninsula became an ice-free area c. 6000 cal. yr bp. Grande Valley also became ice-free c. 6000 cal. yr bp as seen in the sedimentary records from Maxwell Bay and Kitezh Lake, near Grande Valley (Schmidt et al. Reference Schmidt, Mäusbacher and Müller1990, Milliken et al. Reference Milliken, Anderson, Wellner, Bohaty and Manley2009, Majewski et al. Reference Majewski, Wellner, Szczuciński and Anderson2012). Mäusbacher et al. (Reference Mäusbacher, Muller and Schmidt1989) determined a transition time from marine to lacustrine environment of c. 6000 cal. yr bp in Kitezh Lake (16 m a.m.s.l.). Watcham et al. (Reference Watcham, Bentley, Hodgson, Roberts, Fretwell, Lloyd, Larter, Whitehouse, Leng, Monien and Moreton2011) reconstructed the RSL curves for the South Shetland Islands since 8000 cal. yr bp. They found that sea level was 16–18 m a.m.s.l. at 6600 cal. yr bp, when Grande Valley was a relatively narrow and shallow Antarctic fjord. At c. 2000 cal. yr bp, the sea level was 12 m a.m.s.l., equivalent to the altitude of the GA-2 sampling site. In other words, the GA-2 sediment core was in a marine environment prior to 2000 cal. yr bp and it has since been above sea level and stopped receiving marine sedimentary materials (Chu et al. Reference Chu, Sun, Huang, Huang and Zhou2016).
Lithology and Mz variations in fjord sediments mainly depend on deposition dynamics (McLaren & Bowles Reference McLaren and Bowles1985, Domack & Williams Reference Domack and Williams1990). The logarithmic Udden–Wentworth grade scale (Udden Reference Udden1914, Wentworth Reference Wentworth1922) was used to classify sediment particles (Fig. 5) and discovered three distinct stages of Mz variations with an overall coarsening trend between 6600 and 2000 cal. yr bp, reflecting three major deposition dynamic conditions: 6600–4400 cal.yrbp, 4400–2700 cal.yrbp and 2700–2000 cal. yr bp.
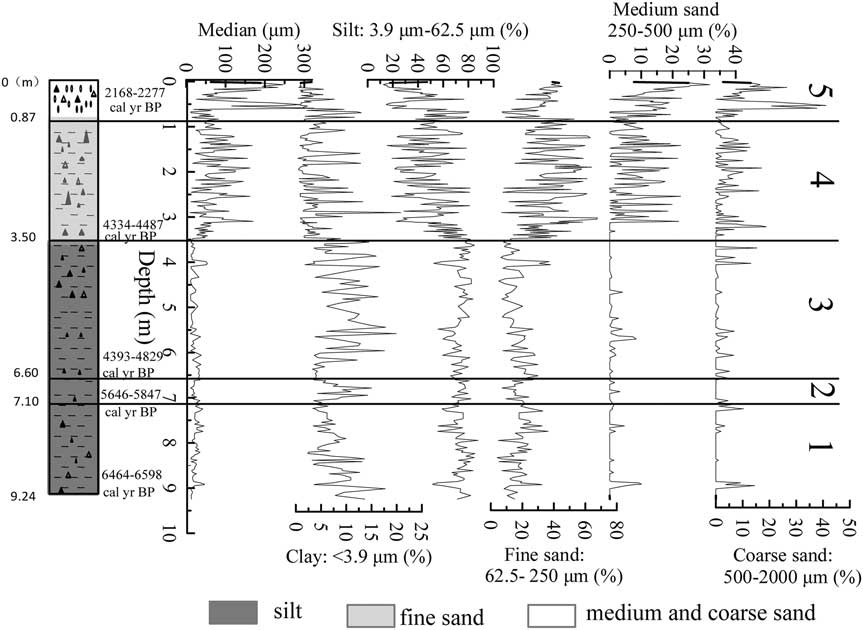
Fig. 5 Sediment particle size variations in GA-2. Sediment particles were classified by the logarithmic Udden–Wentworth grade scale (Udden Reference Udden1914, Wentworth Reference Wentworth1922).
Units 1, 2 and 3 (6600–4400 cal. yr bp) had relatively stable fine particle input. In these units, fine silts and sands were the main components of the sediments (Fig. 5). The Mz was low from 10–50 μm and the standard deviation (SD) was low at 9.6 μm, which may indicate a relatively stable sedimentary environment. The lowermost sediments in GA-2 were formed at 6600 cal. yr bp when Grande Valley was a relatively narrow and shallow Antarctic fjord and the sea level was at 16–18 m a.m.s.l. (Watcham et al. Reference Watcham, Bentley, Hodgson, Roberts, Fretwell, Lloyd, Larter, Whitehouse, Leng, Monien and Moreton2011). Since the lower boundary of GA-2 was ~2 m a.m.s.l., the water depth at the GA-2 sampling site c. 6600 cal.yrbp was ~14–16 m. Gravitation processes may have been the main factor influencing material transportation because of the shallow water and relatively weak ocean currents. Coarse-grained materials are easily deposited nearshore by gravitational processes, and fine particles of terrestrial materials from the valley margins could reach farther away in the fjords of Antarctica (Smith & Andrews Reference Smith and Andrews2000, Syvitski et al. Reference Syvitski, Burrell and Skei2012); thus fine clay materials tended to be deposited in the centre of the northern side of Grande Valley, where GA-2 was collected. This explains the observed low Mz values in GA-2 during this period (units 1–3). This section of GA-2 also contains some angular gravel clasts, which may have been transported by melting ice from the land which contained gravel clasts or unsorted glacial tills (Domack & Williams Reference Domack and Williams1990). During this time period, Grande Valley was uplifting with decreasing RSL (Watcham et al. Reference Watcham, Bentley, Hodgson, Roberts, Fretwell, Lloyd, Larter, Whitehouse, Leng, Monien and Moreton2011) and ~5 m of sediment deposited at the bottom of Grande Valley (Fig. 5).
Unit 4 (4400–2700 cal. yr bp) had a higher input of coarse particles. In unit 4, fine and medium sands were the main components of the sediments, and the proportion of coarse sand and semi-angular and semi-rounded gravel increased (Fig. 5). The Mz also increased to 10–170 μm and had a larger SD of 39 μm, indicating larger changes in sedimentary dynamics. At 4400 cal. yr bp, RSL was at ~13–14 m a.m.s.l. (Watcham et al. Reference Watcham, Bentley, Hodgson, Roberts, Fretwell, Lloyd, Larter, Whitehouse, Leng, Monien and Moreton2011) and Grande Valley was at 14 m a.m.s.l. At the sampling site, the bottom of the sediment core was ~7–8 m a.m.s.l. and the corresponding water depth was ~6 m. During this period, Grande Valley kept rising and the water depth of the sampling site was decreasing (Watcham et al. Reference Watcham, Bentley, Hodgson, Roberts, Fretwell, Lloyd, Larter, Whitehouse, Leng, Monien and Moreton2011). The shallower water and strengthened currents flowing from the land during this period caused more coarse particles to be deposited at the sampling site (Smith & Andrews Reference Smith and Andrews2000, Yoon et al. Reference Yoon, Park, Kim and Kim2000, Syvitski et al. Reference Syvitski, Burrell and Skei2012).
Unit 5 (2700–2000 cal. yr bp) demonstrates a transition from a subtidal to a beach sedimentary environment. In unit 5, medium and coarse sands were the main component of the sediment, and semi-angular and semi-rounded gravel markedly increased (Fig. 5). The average Mz was 140 μm (54–324 μm) with a larger SD of 85 μm. During this time period, the sea level was ~12.5 m a.m.s.l. (Watcham et al. Reference Watcham, Bentley, Hodgson, Roberts, Fretwell, Lloyd, Larter, Whitehouse, Leng, Monien and Moreton2011) and the upper boundary of GA-2 was ~12 m a.m.s.l., which indicates a transition period from a subtidal to a beach sedimentary environment. The sampling site of GA-2 was above sea level after 2000 cal. yr bp and thus GA-2 could not receive marine sedimentary materials. As a result, the surface of GA-2 was affected by surface runoff and it is very likely that it was eroded and that the radiocarbon dating results were affected by modern terrestrial materials (Chu et al. Reference Chu, Sun, Huang, Huang and Zhou2016).
Climate change
The organic matter in sediment is represented by LOI550°C. Temperature is the primary controller on the formation and burial of organic carbon aside from factors such as nutritive salt. Therefore, changes in organic matter content can reflect regional temperature variations of the sea and, indirectly, the atmosphere (Heiri et al. Reference Heiri, Lotter and Lemcke2001, Liu et al. Reference Liu, Zhao, Sun, Luo, Yin, Xie, Wang, Liu, Wu, Ding and Fu2006, Barnard et al. Reference Barnard, Wellner and Anderson2014, Minzoni et al. Reference Minzoni, Anderson, Fernandez and Wellner2015).
The MS is defined as the degree of magnetization in materials and MS of sediment can reflect its relative content of magnetic minerals (Bloemendal Reference Bloemendal1983). Grande Valley was a relatively narrow and shallow Antarctic fjord between 6600 and 2000 cal. yr bp, and the sediments mostly originated from terrestrial materials of the surrounding mountains. However, the sedimentary organic matter in GA-2 mainly came from marine organisms (Chu et al. Reference Chu, Sun, Huang, Huang and Zhou2016). Thus the terrestrial material input was the key factor influencing MS in the sediments, and stronger MS signals indicated increasing input of terrestrial materials. The negative correlation between LOI550°C and MS showed that the MS was associated with the siliceous clastic part of the sediment. This correlation did not exist in the upper part of the core; the probable explanation is that the upper part was formed in shallower water within an unstable sedimentary environment and thus the fine particle materials could not be deposited at the GA-2 sampling site. The variations in key proxies and our climate interpretations are summarized in Fig. 6.
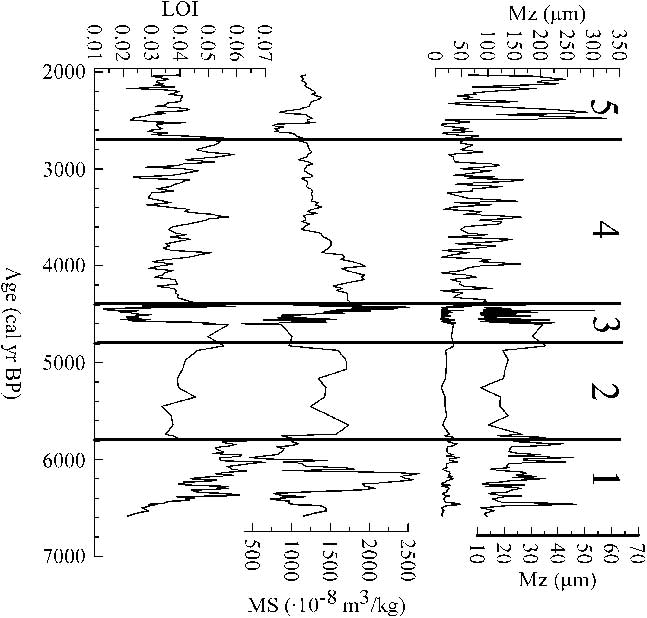
Fig. 6 Age profiles of loss on ignition (LOI), grain size (Mz) and magnetic susceptibility (MS). GA-2 can be separated into five sections: 6600–5800, 5800–4800, 4800–4400, 4400–2700 and 2700–2000 cal. yr bp.
Unit 1 (6600–5800 cal. yr bp) was formed within a warm marine setting. As discussed above, this period had stable depositional conditions. The relatively high LOI550°C indicates a warm climate with high primary production. The Mz was very low but its trend was consistent with that of LOI550°C (Fig. 6). During this warm period, strengthened currents brought more large-sized fine sand to the GA-2 sampling site, resulting in an increase of Mz (Fig. 6). The MS was mainly controlled by terrestrial input and the higher MS between 6600 and 5800 cal. yr bp also indicates higher input from surround highlands. These findings indicate a warm period during 6600–5800 cal. yr bp in Grande Valley.
Only thousands of metres away, Maxwell Bay displayed a similar climate pattern. Maxwell Bay was in a warm period and the RSL was declining (Simms et al. Reference Simms, Milliken, Anderson and Wellner2011b). Milliken et al. (Reference Milliken, Anderson, Wellner, Bohaty and Manley2009) proposed that Maxwell Bay experienced a climatic optimum during 8200–5900 cal. yr bp. Brachfeld et al. (Reference Brachfeld, Banerjee, Guyodo and Acton2002) detected the climatic optimum of Palmer Deep at c. 6000 cal. yr bp. Hjort et al. (Reference Hjort, Ingólfsson, Möller and Lirio1997) reported an ice retreat and rising temperature on James Ross Island at 6600–5400 cal. yr bp. A number of studies have shown a remarkable warm period at 6600–5800 cal. yr bp on the Antarctic Peninsula (Shevenell et al. Reference Shevenell, Domack and Kernan1996, Jones et al. Reference Jones, Hodgson and Chepstow-Lusty2000, Bentley et al. Reference Bentley, Hodgson, Smith, Cofaigh, Domack, Larter, Roberts, Brachfeld, Leventer, Hjort, Hillenbrand and Evans2009, Majewski et al. Reference Majewski, Wellner, Szczuciński and Anderson2012, Minzoni et al. Reference Minzoni, Anderson, Fernandez and Wellner2015).
Unit 2 (5800–4800 cal. yr bp) shows a cool period with more extensive sea ice. In this period, the LOI550°C and MS of GA-2 decreased along with a reduced deposition rate of 0.4 mm a-1 (Chu et al. Reference Chu, Sun, Huang, Huang and Zhou2016), indicating decreasing primary production and a cooling climate. Enhanced sea ice coverage prevented terrestrial input from Grande Valley leading to reduced MS.
Correspondingly, Maxwell Bay exhibited a cooling trend during 5900–4000 cal. yr bp (Bentley et al. Reference Bentley, Hodgson, Smith, Cofaigh, Domack, Larter, Roberts, Brachfeld, Leventer, Hjort, Hillenbrand and Evans2009, Milliken et al. Reference Milliken, Anderson, Wellner, Bohaty and Manley2009, Majewski et al. Reference Majewski, Wellner, Szczuciński and Anderson2012). Palmer Deep was in a relatively cold period during 6000–5000 cal. yr bp when sea ice increased (Brachfeld et al. Reference Brachfeld, Banerjee, Guyodo and Acton2002). Glacier advance took place at Firth of Tay, a fjord between Joinville and Dundee islands, north-east Antarctic Peninsula, during 6000–4500 cal. yr bp (Michalchuk et al. Reference Michalchuk, Anderson, Wellner, Manley, Majewski and Bohaty2009). A cooling period was also reported at Bransfield basin, Lallemand Fjord, James Ross Island and Ardley Island during 5800–4800 cal. yr bp (Björck et al. Reference Björck, Olsson, Ellis-Evans, Håkansson, Humlum and deLirio1996, Brachfeld et al. Reference Brachfeld, Banerjee, Guyodo and Acton2002). The difference of 200–400 years for the cooling time period in different studies could be attributed to the uncertainty of dating and regional differentiation in the Antarctic Peninsula.
Unit 3 (4800–4400 cal. yr bp) shows a period of transition from cool to warm. Rising LOI550°C c. 4800 cal. yr bp indicates enhanced terrestrial input and primary production, and a warmer climate. These changes were seemingly too weak to cause a significant change in deposition conditions; the Mz slightly increased but still remained low. MS was similar to that of unit 2.
During this period, the LOI550°C first increased and subsequently decreased, and the MS first decreased and subsequently increased. The deposition rate was high at ~17.1 mm a-1. Clay minerals in sediments were<3.9 μm and mainly derived from terrigenous weathering (Thiry Reference Thiry2000); thus the increased composition of material<3.9 μm in GA-2 indicates enhanced clay minerals from increased terrigenous input (6–4 m, Fig. 5). No obvious glacier advance events, which can result in high deposition rates, have been reported in nearby sediment profiles in the South Shetland Islands during this period (Schmidt et al. Reference Schmidt, Mäusbacher and Müller1990, Björck et al. Reference Björck, Olsson, Ellis-Evans, Håkansson, Humlum and deLirio1996, Jones et al. Reference Jones, Hodgson and Chepstow-Lusty2000).
In summary, Grande Valley was experiencing cooling with extending sea ice between 5800 and 4800 cal. yr bp. After 4800 cal. yr bp, the climate became warmer, glaciers began to melt and a mass of terrestrial sand and gravel clasts were washed into the valley leading to the extremely high deposition rate. With stronger dynamic conditions, more fine particles could reach the GA-2 sampling site, and this explains the observed low Mz. The low LOI550°C from 4600–4400 cal. yr bp was not attributed to reduced primary production under a cold climate; it is more likely that it was due to the boosted input of terrestrial materials with lower organic carbon from surrounding land during a climate transition from cold to warm. Such climate transitions could lead to more meltwater and enhanced soil erosion, it provides a mechanism for the reported intense soil erosion by Björck et al. (Reference Björck, Håkansson, Olsson, Barnekow and Janssens1993) at 4500 cal. yr bp on King George Island, and it is consistent with the studies by Schmidt et al. (Reference Schmidt, Mäusbacher and Müller1990), Björck et al. (Reference Björck, Olsson, Ellis-Evans, Håkansson, Humlum and deLirio1996) and Jones et al. (Reference Jones, Hodgson and Chepstow-Lusty2000).
Unit 4 (4400–2700 cal. yr bp) represents a mid-Holocene climatic optimum. The LOI550°C of GA-2 substantially increased during this period, indicating higher organic matter content and primary production, and the great cyclic fluctuations were mainly ascribed to the fluctuations of climate in this period (Shevenell et al. Reference Shevenell, Domack and Kernan1996, Rosqvist & Schuber Reference Rosqvist and Schuber2003). The strengthened currents and unstable sedimentary conditions made it possible for some coarse particles to deposit at GA-2, leading to high Mz. At the GA-2 sampling site, the water depth became shallower and MS showed a trend of slight decrease because fine clay minerals were transported to deeper regions of the valley (Fig. 6). Thus, Fildes Peninsula was experiencing a Holocene climatic optimum at 4400–2700 cal. yr bp.
Studies on surrounding regions have reported similar climate warming. Björck et al. (Reference Björck, Håkansson, Zale, Karlén and Jönsson1991) reported ice retreat on Livingston Island starting at 4000–3200 cal. yr bp and a Holocene climatic optimum during 3200–2700 cal. yr bp. Yoon et al. (Reference Yoon, Park, Kim and Kim2000) dated the climatic optimum of Maxwell Bay between 4000 and 2700 cal. yr bp. Shevenell et al. (Reference Shevenell, Domack and Kernan1996) concluded that Lallemand Fjord was warm and humid during 4200–2700 cal. yr bp, similar to Fildes Peninsula. Sun et al. (Reference Sun, Liu, Yin, Xie and Zhao2005) used a sedimentary profile collected in a coastal notch and reported a climatic optimum between 4000 and 3000 cal. yr bp on Fildes Peninsula. Furthermore, Michalchuk et al. (Reference Michalchuk, Anderson, Wellner, Manley, Majewski and Bohaty2009) presented an evident ice retreat between 4500 and 3500 cal. yr bp at Firth of Tay.
Unit 5 (2700–2000 cal. yr bp) represents the onset of the Neoglacial. The LOI550°C markedly decreased, and Mz first increased and subsequently decreased (Fig. 6), suggesting a cold climate during this period. The RSL was 12.5 m a.m.s.l. at 2700 cal. yr bp and the sampling site was experiencing a transition from a subtidal to a beach sedimentary environment, which might explain the two cycles of grain size change. These fluctuations were mainly due to the changes in currents, tides and climate. The start time of 2700 cal. yr bp is consistent with the onset of the Neoglacial in the Antarctic Peninsula Region (Björck et al. Reference Björck, Håkansson, Zale, Karlén and Jönsson1991, Shevenell et al. Reference Shevenell, Domack and Kernan1996, Brachfeld et al. Reference Brachfeld, Banerjee, Guyodo and Acton2002, Barnard et al. Reference Barnard, Wellner and Anderson2014, Minzoni et al. Reference Minzoni, Anderson, Fernandez and Wellner2015).
Overall, Fildes Peninsula experienced warm–cool–warm–cold conditions between 6600 and 2000 cal. yr bp. The organic carbon content of sediment is reflected in two highly correlated proxies: LOI550°C and total organic carbon (TOC) (Ball Reference Ball1964, Heiri et al. Reference Heiri, Lotter and Lemcke2001); thereby LOI550°C and TOC can reflect regional temperature variation trends. We compared LOI550°C in GA-2 with TOC in the marine sedimentary core GC-1 from Lallemand Fjord (Shevenell et al. Reference Shevenell, Domack and Kernan1996), LOI550°C in a lake core from South Georgia, Southern Ocean (Rosqvist & Schuber Reference Rosqvist and Schuber2003), TOC in a marine core from Firth of Tay (Michalchuk et al. Reference Michalchuk, Anderson, Wellner, Manley, Majewski and Bohaty2009) and TOC in a marine core from Maxwell Bay (Majewski et al. Reference Majewski, Wellner, Szczuciński and Anderson2012). They had highly similar profiles of peaks and troughs between 6600 and 2000 cal. yr bp, and they were also consistent with temperatures in Antarctic ice cores (Ciais et al. Reference Ciais, Jollzel, Petit, Lipenkov and White1994). For example, peaks of LOI550°C and TOC occurred c. 3500, 4400 and 5300 cal. yr bp, while troughs were near 2700 and 4500 cal. yr bp. The differences in amplitudes and dated age of 100–300 years are probably due to uncertainties in the dating and the differences in sedimentary and surrounding environment, namely, regional differentiation (Fig. 7). Organic matter content was high during 6600–5800 cal. yr bp and 4400–2700 cal. yr bp (warm periods) and low between 5800 and 4800 cal. yr bp (a cooling period). The onset of the Neoglacial was at c. 2700 cal. yr bp with a distinct reduction of LOI550°C and TOC.
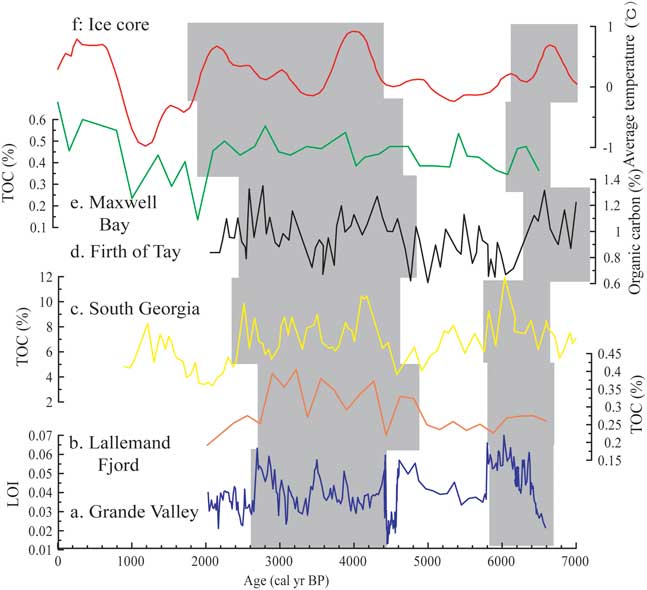
Fig. 7 Comparison of total organic carbon (TOC) and average temperature proxies in different regions a. this study, b. Lallemand Fjord (Shevenell et al. Reference Shevenell, Domack and Kernan1996), c. South Georgia, Southern Ocean (Rosqvist & Schuber Reference Rosqvist and Schuber2003), d. Firth of Tay, north-east Antarctic Peninsula (Michalchuk et al. Reference Michalchuk, Anderson, Wellner, Manley, Majewski and Bohaty2009), e. Maxwell Bay (Majewski et al. Reference Majewski, Wellner, Szczuciński and Anderson2012). f. Temperature in Antarctic ice cores (Ciais et al. Reference Ciais, Jollzel, Petit, Lipenkov and White1994). LOI=loss on ignition.
Sedimentary environment and climate changes in Fildes Peninsula
Sun et al. (Reference Sun, Liu, Yin, Zhu, Xie and Wang2004) reconstructed historical seal populations near the site of GA-2 through a lake sediment core (HF4) influenced by seal excrement at ~8 m a.m.s.l. (Fig. 1). The upper sections of the excrement deposits in HF4 started to form c. 1500 cal. yr bp and the bottom sections, below the excrement deposits, were marine deposits prior to 1500 cal. yr bp (Sun et al. Reference Sun, Liu, Yin, Zhu, Xie and Wang2004). These results confirmed that the site of HF4 was below sea level and ground soil deposits could not occur prior to 1500 cal. yr bp, a result that is consistent with GA-2.
From the reconstructed historical seal activities by Sun et al. (Reference Sun, Liu, Yin, Zhu, Xie and Wang2004) and sedimentary records from Maxwell Bay (Bentley et al. Reference Bentley, Hodgson, Smith, Cofaigh, Domack, Larter, Roberts, Brachfeld, Leventer, Hjort, Hillenbrand and Evans2009, Milliken et al. Reference Milliken, Anderson, Wellner, Bohaty and Manley2009, Simms et al. Reference Simms, Milliken, Anderson and Wellner2011b, Majewski et al. Reference Majewski, Wellner, Szczuciński and Anderson2012) and this study, we can summarize sedimentary environment and climate changes during the Holocene in Grande Valley, Fildes Peninsula. During 10 000–5800 cal. yr bp, Fildes Peninsula was warm and humid, grounded glaciers retreated and ice-free regions were formed. At 6600 cal. yr bp, the sea level was 16–18 m a.m.s.l. and most of Fildes Peninsula was submerged. The island was rising with decreasing RSL and isolated lakes, such as Long Lake, Xi Lake and Kitezh Lake, were formed (Fig. 8a). Between 5800 and 4400 cal. yr bp, a minor period of cooling with increased ice coverage occurred while Fildes Peninsula was still rising with decreasing RSL (Fig. 8b). Between 4400 and 2700 cal. yr bp, the island was in a mid-Holocene climatic optimum and grounded ice retreated back into the present boundary. Lakes and bays of low altitude started to form in ice-free areas (Fig. 8c). The onset of the Neoglacial occurred at 2700 cal.yrbp in Fildes Peninsula, when the GA-2 sampling site was above sea level (Fig. 8d). Between 2000 and 1500 cal.yrbp, the RSL decreased to 8 m. At the same time, the HF4 sampling site was also above sea level and seals began to land in Grande Valley (Fig. 8e). In modern days, the coastal areas of Grande Valley are home to a diverse array of vegetation and animals, including Weddell and elephant seals, sea lions, and Adélie, chinstrap and gentoo penguins (Fig. 8f).
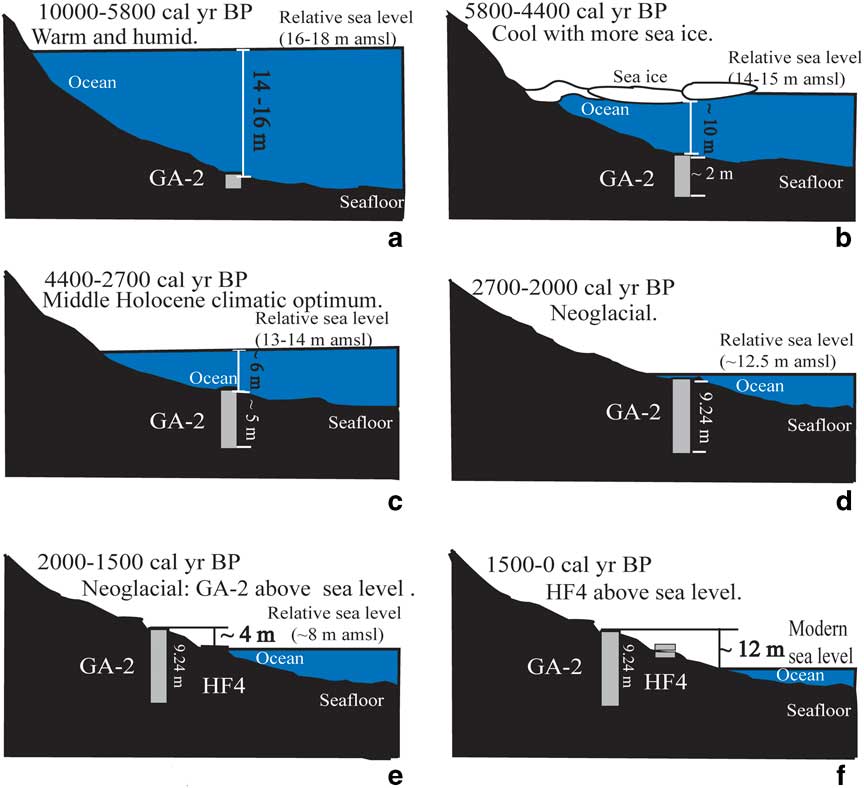
Fig. 8 Schematic diagram of the sedimentary environments and climate change during the Holocene in Grande Valley, Fildes Peninsula. The diagram was constructed by combining previous research (Sun et al. Reference Sun, Liu, Yin, Zhu, Xie and Wang2004, Reference Sun, Liu, Yin, Xie and Zhao2005, Bentley et al. Reference Bentley, Hodgson, Smith, Cofaigh, Domack, Larter, Roberts, Brachfeld, Leventer, Hjort, Hillenbrand and Evans2009, Milliken et al. Reference Milliken, Anderson, Wellner, Bohaty and Manley2009, Simms et al. Reference Simms, Milliken, Anderson and Wellner2011b, Majewski et al. Reference Majewski, Wellner, Szczuciński and Anderson2012) and this study.
Conclusions
In summary, the marine core GA-2 was used successfully to reconstruct three depositional environments and an alternating climate change pattern (warm–cool–warm–cold) during the period 6600–2000 cal. yr bp in Grande Valley, Fildes Peninsula, King George Island, Antarctic. The valley experienced a warm marine environment during 6600–5800 cal. yr bp, a minor cooling between 5800–4800 cal. yr bp, a transition from cool to warm during 4800–4400, a mid-Holocene climatic optimum between 4400 and 2700 cal. yr bp and the onset of the Neoglacial at 2700 cal. yr bp. This study reconstructed the environmental evolution of Grande Valley during the Holocene, provided a historical marine climate record for the western coast of Fildes Peninsula, and has laid the foundations for study of the climate and environment changes therein. The sea level records obtained from the marine sediment core GA-2 and the seal guano deposit core HF4 allow for detailed reconstruction of Holocene sea level variations.
Acknowledgements
This study was funded by the Chinese Polar Environment Comprehensive Investigation & Assessment Programmes (CHINARE2016-02-01-03, CHINARE2016-04-04-09 and CHINARE2016-04-01-07), Chinese Polar Scientific Strategic Research Programme (20120101). Samples in this study were provided by the BIRDS-Sediment system. We thank the Chinese Arctic and Antarctic Administration and Polar Research Institute of China for logistical support in the field. Dr Baoyin Yuan provided help in the field for sample collection. We thank the editors and reviewers for their helpful comments.
Author contribution
LS and ZC conceived and designed the study. ZC performed the experiments. LS, ZC, TH and XZ performed data analysis. ZC wrote the paper. YW reviewed and edited the manuscript. All authors read and approved the manuscript.


