


Introduction
The SOD-type framework in sodalite-group minerals and related compounds can be described as consisting of three kinds of stacked layers (A, B and C) of Al- and Si-centred tetrahedra, in the sequence (ABC)∞ (Bonaccorsi and Merlino, Reference Bonaccorsi, Merlino, Ferraris and Merlino2005; see also Database of Zeolite Structures, http://www.iza-structure.org/databases/). The layers contain six-membered rings of Si- and Al-centred tetrahedra which are ordered in most aluminosilicate sodalite-group minerals. The distinguishing structural feature of sodalite-type compounds is a system of intersecting channels consisting of sodalite cages. The species-defining extra-framework components in sodalite-group minerals include different cations (Na+, [N(CH3)4]+, Ca2+, Mn2+, Fe2+ and Zn2+), anions (Cl–, F–, OH–, HS–, S2–, SO42– and radical anion S3•–) and neutral molecules (H2O) (Chukanov et al., Reference Chukanov, Aksenov and Rastsvetaeva2021a) (‘•’ denotes unpaired electron). Other extra-framework species (K+, S2•–, SO4•2–, S3, S4, S6, CO2 and COS) occur in subordinate amounts and can be identified based on a multianalytical approach involving different spectroscopic methods (Chukanov et al., Reference Chukanov, Vigasina, Zubkova, Pekov, Schäfer, Kasatkin, Yapaskurt and Pushcharovsky2020a,Reference Chukanov, Sapozhnikov, Shendrik, Vigasina and Steudel2020b; Sapozhnikov et al., Reference Sapozhnikov, Tauson, Lipko, Shendrik, Levitskii, Suvorova, Chukanov and Vigasina2021).
Sodalite-group minerals are widespread in different kinds of alkaline igneous and metasomatic rocks and sometimes play a rock-forming role. Chemical diversity of natural SOD-type compounds is mainly due to geochemical factors (Chukanov et al., Reference Chukanov, Aksenov and Rastsvetaeva2021a).
The new mineral sapozhnikovite, Na8(Al6Si6O24)(HS)2, described in this paper is the first member of the sodalite group containing the HS– anion as a species-defining component. The mineral is named in honour of the outstanding Russian mineralogist and crystallographer, Senior Researcher of the Vinogradov Institute of Geochemistry, Siberian Branch of Russian Academy of Sciences (Irkutsk), Dr. Anatoly Nikolaevich Sapozhnikov (b. 1946). Dr. Sapozhnikov is the author of numerous scientific publications, a major part of which is related to structural chemistry of cancrinite- and sodalite-group minerals. Dr. Sapozhnikov is a senior author or co-author of a number of papers documenting the discoveries of a dozen of new mineral species including four minerals belonging to the cancrinite and sodalite groups (bystrite, tounkite, vladimirivanovite and sulfhydrylbystrite).
The new mineral and its name (symbol Spz) have been approved by the International Mineralogical Association's Commission on New Minerals, Nomenclature and Classification (IMA2021-030, Chukanov, Reference Chukanov, Zubkova, Pekov, Shendrik, Varlamov, Vigasina, Belakovskiy, Britvin, Yapaskurt and Pushcharovsky2021b). The holotype specimen is deposited in the collection of the Fersman Mineralogical Museum of the Russian Academy of Sciences, Moscow, Russia with the registration number 5665/1.
Experimental methods and data processing
In order to obtain infrared (IR) absorption spectra of sapozhnikovite and other sodalite-group minerals (used for comparison), powdered samples were mixed with anhydrous KBr, pelletised, and analysed using an ALPHA FTIR spectrometer (Bruker Optics) at a resolution of 4 cm–1. Sixteen scans were collected for each spectrum. The IR spectrum of a pellet of pure KBr was used as a reference.
Raman spectra of randomly oriented grains of sapozhnikovite and sodalite-group minerals used for comparison were obtained using an EnSpectr R532 spectrometer based on an OLYMPUS CX 41 microscope coupled with a diode laser (λ = 532 nm) at room temperature. The spectra were recorded in the range from 100 to 4000 cm–1 with a diffraction grating (1800 gr mm–1) and spectral resolution of ~6 cm–1. The output power of the laser beam was in the range from 5 to 13 mW. The diameter of the focal spot on the sample was 5–10 μm. The back-scattered Raman signal was collected with a 40× objective; signal acquisition time for a single scan of the spectral range was 1 s, and the signal was averaged over 50 scans. Crystalline silicon was used as a standard.
Electron spin resonance (ESR) spectra were recorded using a RE-1306 X-band spectrometer (KBST, Smolensk, Russia) with a frequency of 9.358 GHz. Small randomly oriented crystals of sapozhnikovite were placed in a quartz test tube. The measurements were carried out at room temperature.
Diffuse-light near infrared (NIR), visible (Vis), and near ultraviolet (UV) absorption spectra of sapozhnikovite were measured at room temperature with a PerkinElmer Lambda 950 spectrophotometer (Perkin-Elmer, Shelton, CT, USA) in an integrating sphere. For measurements, the samples were placed in a quartz test tube, which is transparent in the range of 285–2000 nm (35,000–5000 cm–1). The light beam was completely concentrated on the sample. The photoluminescence spectra were measured with excitation by laser radiation with a wavelength of 405 nm (24,690 cm–1). The luminescence signal was recorded using a Hamamatsu H6780-04 photomodule (185–850 nm) operating in the photon counting regime equipped by a SDL-1 double grating monochromator (LOMO, St. Petersburg, Russia) with a diffraction grating of 600 lines per mm, at a spectral slit width of 0.05 nm. The measurements at 77 K were carried out in a flooded nitrogen cryostat; the sample was attached to a cryofinger and the temperature was recorded using a type-K thermocouple. The excitation spectrum is normalised utilising the calibration curve obtained by means of a highly fluorescent rhodamine family dye Rhodamine-6G. The photoluminescence spectrum of sapozhnikovite was obtained at 77 K.
Electron microprobe analyses were obtained in WDS mode (20 kV and 10 nA; the electron beam was rastered to a 5 μm × 5 μm area to minimise damage to the mineral) and gave detectable contents of Na, Al, Si, O, Cl and S.
Gas chromatography of products of ignition in an oxygen stream at 1200°C was used to determine H, N and C.
Powder X-ray diffraction (XRD) data were collected using a Rigaku R-AXIS Rapid II diffractometer (image plate), CoKα, 40 kV, 15 mA, rotating anode with the microfocus optics, Debye-Scherrer geometry, d = 127.4 mm and exposure 15 min. The raw powder XRD data were collected using a program suite designed by Britvin et al. (Reference Britvin, Dolivo-Dobrovolsky and Krzhizhanovskaya2017). Calculated intensities were obtained using the STOE WinXPOW v. 2.08 program suite based on the atomic coordinates and unit-cell parameters.
Single-crystal XRD studies were carried out using an Xcalibur S diffractometer equipped with a CCD detector (MoKα radiation). The crystal structure study of sapozhnikovite was carried out on a crystal 0.23 mm × 0.31 mm × 0.39 mm in size using an Xcalibur S single-crystal diffractometer equipped with a CCD detector. A full sphere of three-dimensional data was collected. Data reduction was performed using CrysAlisPro version 1.171.39.46 (Rigaku Oxford Diffraction, 2018). The data were corrected for Lorentz factor and polarisation effect. The crystal structure was refined using the SHELX software package (Sheldrick, Reference Sheldrick2015) to R = 0.0162 for 334 unique reflections with I > 2σ(I) in the frame of the space group P $\bar{4}$ 3n. Crystal data, data collection information and structure refinement details for sapozhnikovite are given in Table 1.
Table 1. Crystal data, data collection information and structure refinement details for sapozhnikovite.
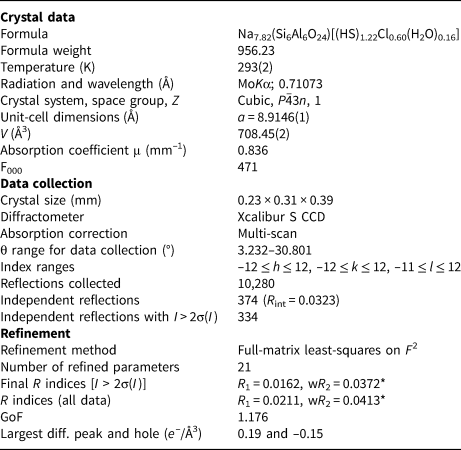
* During the refinement, the occupancy of the site containing S, Cl and O atoms of water molecule was refined as S vs. O. The content of Cl was assumed based on chemical composition data and the refined number of electrons.
Results
Occurrence, general appearance and physical properties
Sapozhnikovite occurs in a specific hydrothermally altered urtite-like rock at the northern slope of the Karnasurt Mountain located in the northern part of the Lovozero alkaline massif, Kola Peninsula, Russia. The associated minerals are nepheline, aegirine, potassic feldspar, albite, kyanoxalite, natrolite, fluorapatite, fluorcaphite, lomonosovite (partially or completely altered to murmanite) and loparite-(Ce). Sapozhnikovite is a rock-forming mineral in this rock, together with nepheline (typically > 60 vol.%), aegirine, alkali feldspars and kyanoxalite. The content of sapozhnikovite in the rock is up to 10–15 vol.%. Similar rocks from this region contain sodalite-group minerals with variable S:Cl ratios and belong to the sapozhnikovite–sodalite solid-solution series.
Sapozhnikovite occurs as isolated colourless to pale greyish anhedral equant grains up to 1 mm, rarely up to 5 mm across (Figs 1 to 3). The streak is white and the lustre is vitreous.
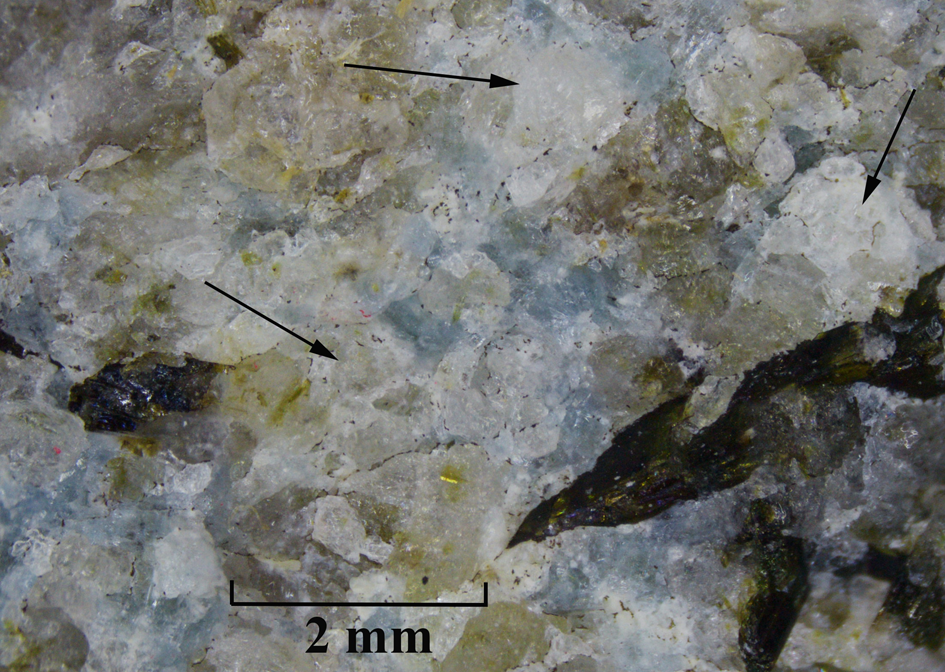
Fig. 1. Sapozhnikovite grains (indicated with arrows) in association with nepheline (pale greenish-grey), kyanoxalite (pale blue) and aegirine (black). Holotype specimen 5665/1.
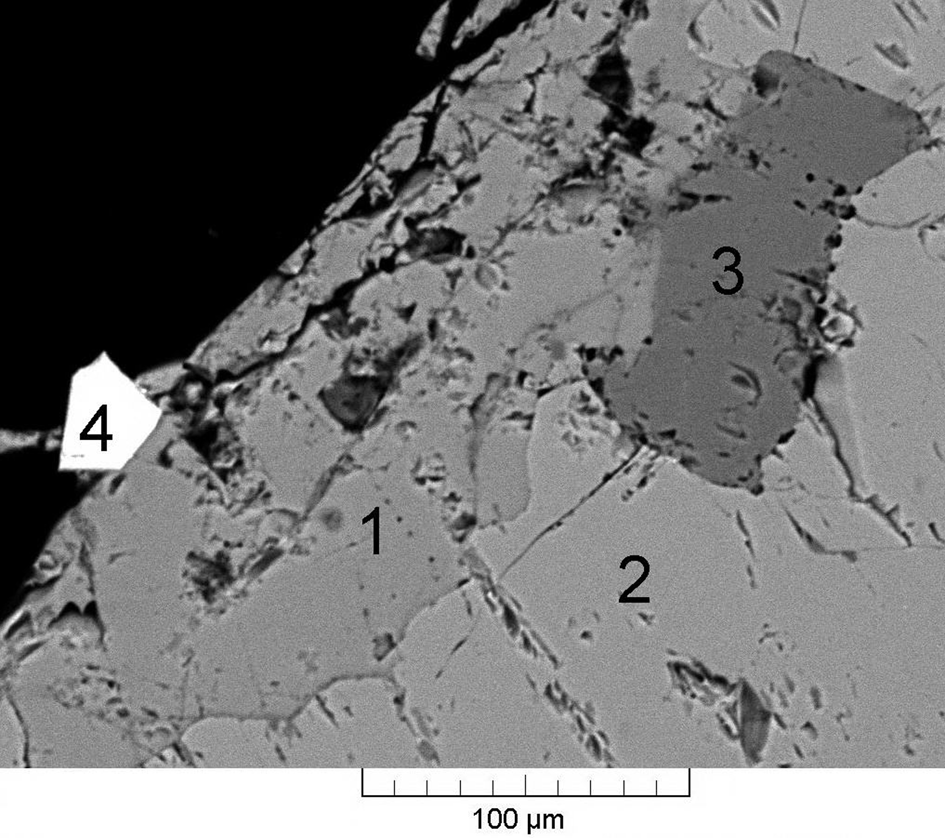
Fig. 2. Sapozhnikovite (1) in association with nepheline (2), kyanoxalite (3) and aegirine (4). Back-scatter electron (BSE) image of a polished section. Holotype specimen 5665/1.
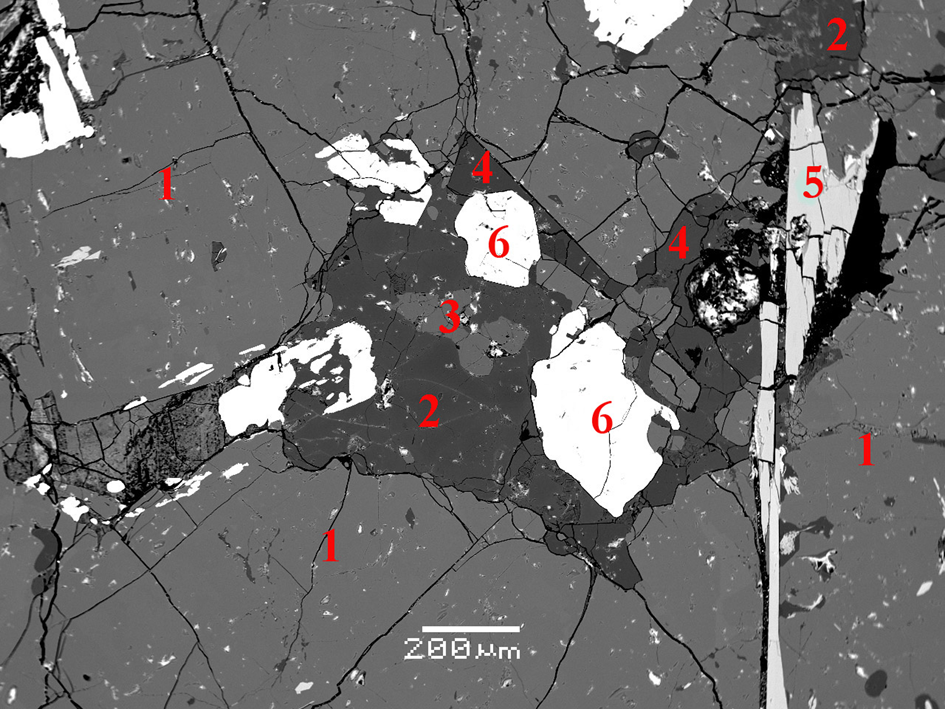
Fig. 3. Mineral association including (1) nepheline, (2) kyanoxalite, (3) sapozhnikovite, (4) natrolite, (5) murmanite and (6) aegirine. BSE image of a polished section. Holotype specimen 5665/1.
Intensive orange photoluminescence under longwave UV radiation (λ = 330 nm) and weak yellow-orange photoluminescence under shortwave UV radiation (λ = 245 nm) are observed. The photoluminescence is attributed to the presence of trace amounts of the S2•– radical anion (see below for details).
Sapozhnikovite is brittle, with a Mohs hardness of 5½. Cleavage is imperfect on (110). The fracture is uneven. Density measured by flotation in heavy liquids (bromoform + heptane) is equal to 2.25(1) g⋅cm–3. Density calculated using the empirical formula and unit-cell volume refined from single-crystal XRD data is 2.255 g⋅cm–3.
The new mineral is optically isotropic, with n = 1.499(2) (λ = 589 nm). Under the microscope, sapozhnikovite is colourless.
Infrared spectroscopy
The assignment of absorption bands in the IR spectrum of sapozhnikovite (Fig. 4) is as follows. The band at 3520 cm–1 corresponds to O–H stretching vibrations of H2O molecules in sodalite cages forming medium-strength hydrogen bonds (Chukanov, Reference Chukanov2014; Chukanov and Chervonnyi, Reference Chukanov and Chervonnyi2016; Nakamoto, Reference Nakamoto2008, Reference Nakamoto2009). The band at 2554 cm–1 corresponds to stretching vibrations of the HS– anion (Sheppard, Reference Sheppard1949; Bragin et al., Reference Bragin, Diem, Guthals and Chang1977). The band at 1637 cm–1 is due to bending vibrations of H2O molecules in sodalite cages (Chukanov Reference Chukanov2014; Chukanov and Chervonnyi Reference Chukanov and Chervonnyi2016; Nakamoto Reference Nakamoto2008, Reference Nakamoto2009).
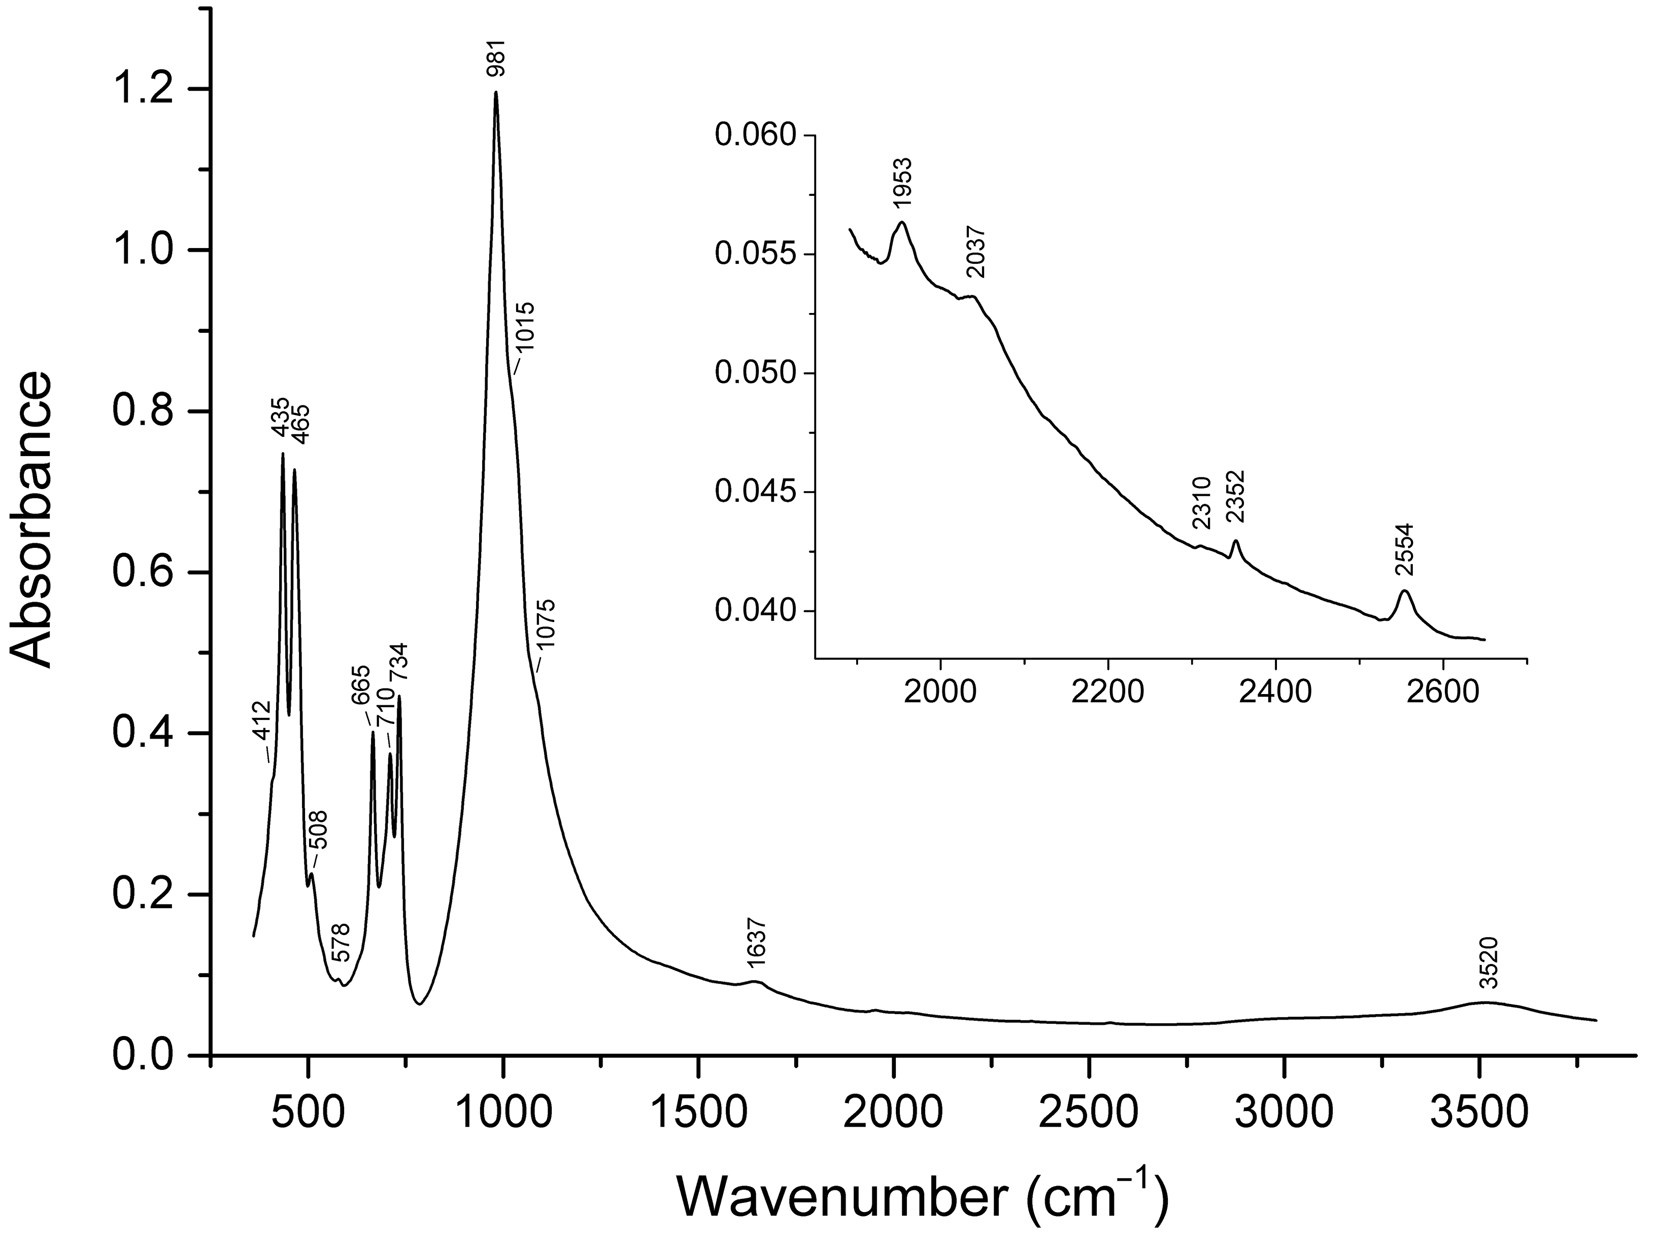
Fig. 4. Powder infrared absorption spectrum of sapozhnikovite.
The bands in the range 980–1080 cm–1 correspond to stretching vibrations of the aluminosilicate framework, i.e. vibrations in which a major part of energy corresponds to changes of the covalent T–O bond lengths (T = Si and Al) (Chukanov and Chervonnyi, Reference Chukanov and Chervonnyi2016). The bands at 660–740 cm–1 correspond with mixed vibrations of the aluminosilicate framework involving changes of both T–O bond lengths and O–T–O angles. Below 500 cm–1 bands are due to lattice modes involving soft T–O–T bending internal coordinates and libration vibrations of H2O molecules.
The intensity of S–H stretching vibrations, including the stretching band of the HS– anion, are very low (Sheppard, Reference Sheppard1949; Bragin et al., Reference Bragin, Diem, Guthals and Chang1977; see Supplementary figure 1S). For this reason, Raman spectroscopy was used to confirm the presence of significant amounts of HS– in sapozhnikovite (see below).
The weak bands at 2352 and 2037 cm–1 correspond to trace amounts of the extra-framework CO2 and COS neutral molecules, respectively (below 0.02 wt.% of each, as estimated from the band intensities: see Chukanov et al., Reference Chukanov, Vigasina, Zubkova, Pekov, Schäfer, Kasatkin, Yapaskurt and Pushcharovsky2020a,Reference Chukanov, Sapozhnikov, Shendrik, Vigasina and Steudel2020b for the band assignment and the method of estimation). The weak bands at 1953 and 578 cm–1 are assigned to overtones of stretching vibrations of the framework and vibrations involving Na+ cations, respectively (see Hettmann et al., Reference Hettmann, Wenzel, Marks and Markl2012).
Bands of sulfate groups in the IR spectra of sodalite-group minerals are observed as an absorption maximum in the range of 1134–1142 cm–1 [asymmetric stretching vibrations of SO42–, the F 2(ν3) mode] and in the range of 610–630 cm–1 [bending vibrations of SO42–, the F 2(ν4) mode] (Nakamoto Reference Nakamoto2008, Reference Nakamoto2009) (Supplementary figure 2S). These bands are absent in the IR spectra of both sapozhnikovite and S-free sodalite (Supplementary figure 2S).
Characteristic bands of CO32– anions (in the range of 1350–1550 cm–1) are not observed in the IR spectrum of sapozhnikovite.
Raman spectroscopy
The assignment of absorption bands in the Raman spectrum of sapozhnikovite (curve a in Fig. 5) is as follows. The strong band at 2553 cm–1 corresponds to stretching vibrations of the HS– anion (Bragin et al., Reference Bragin, Diem, Guthals and Chang1977). Bands in the range of 970–1070 cm–1 are assigned to stretching vibrations of the aluminosilicate framework, i.e. vibrations in which a major part of energy corresponds to changes of the covalent T–O bond lengths (Hettmann et al., Reference Hettmann, Wenzel, Marks and Markl2012; see Supplementary figure 3S). The 732 cm–1 band is due to mixed vibrations of the aluminosilicate framework involving changes of both T–O bond lengths and O–T–O angles. The band at 611 cm–1 is, presumably, an overtone of the band at 294 cm–1 corresponding to vibrations involving Na+ cations. Positive anharmonic shift is in agreement with this assignment.
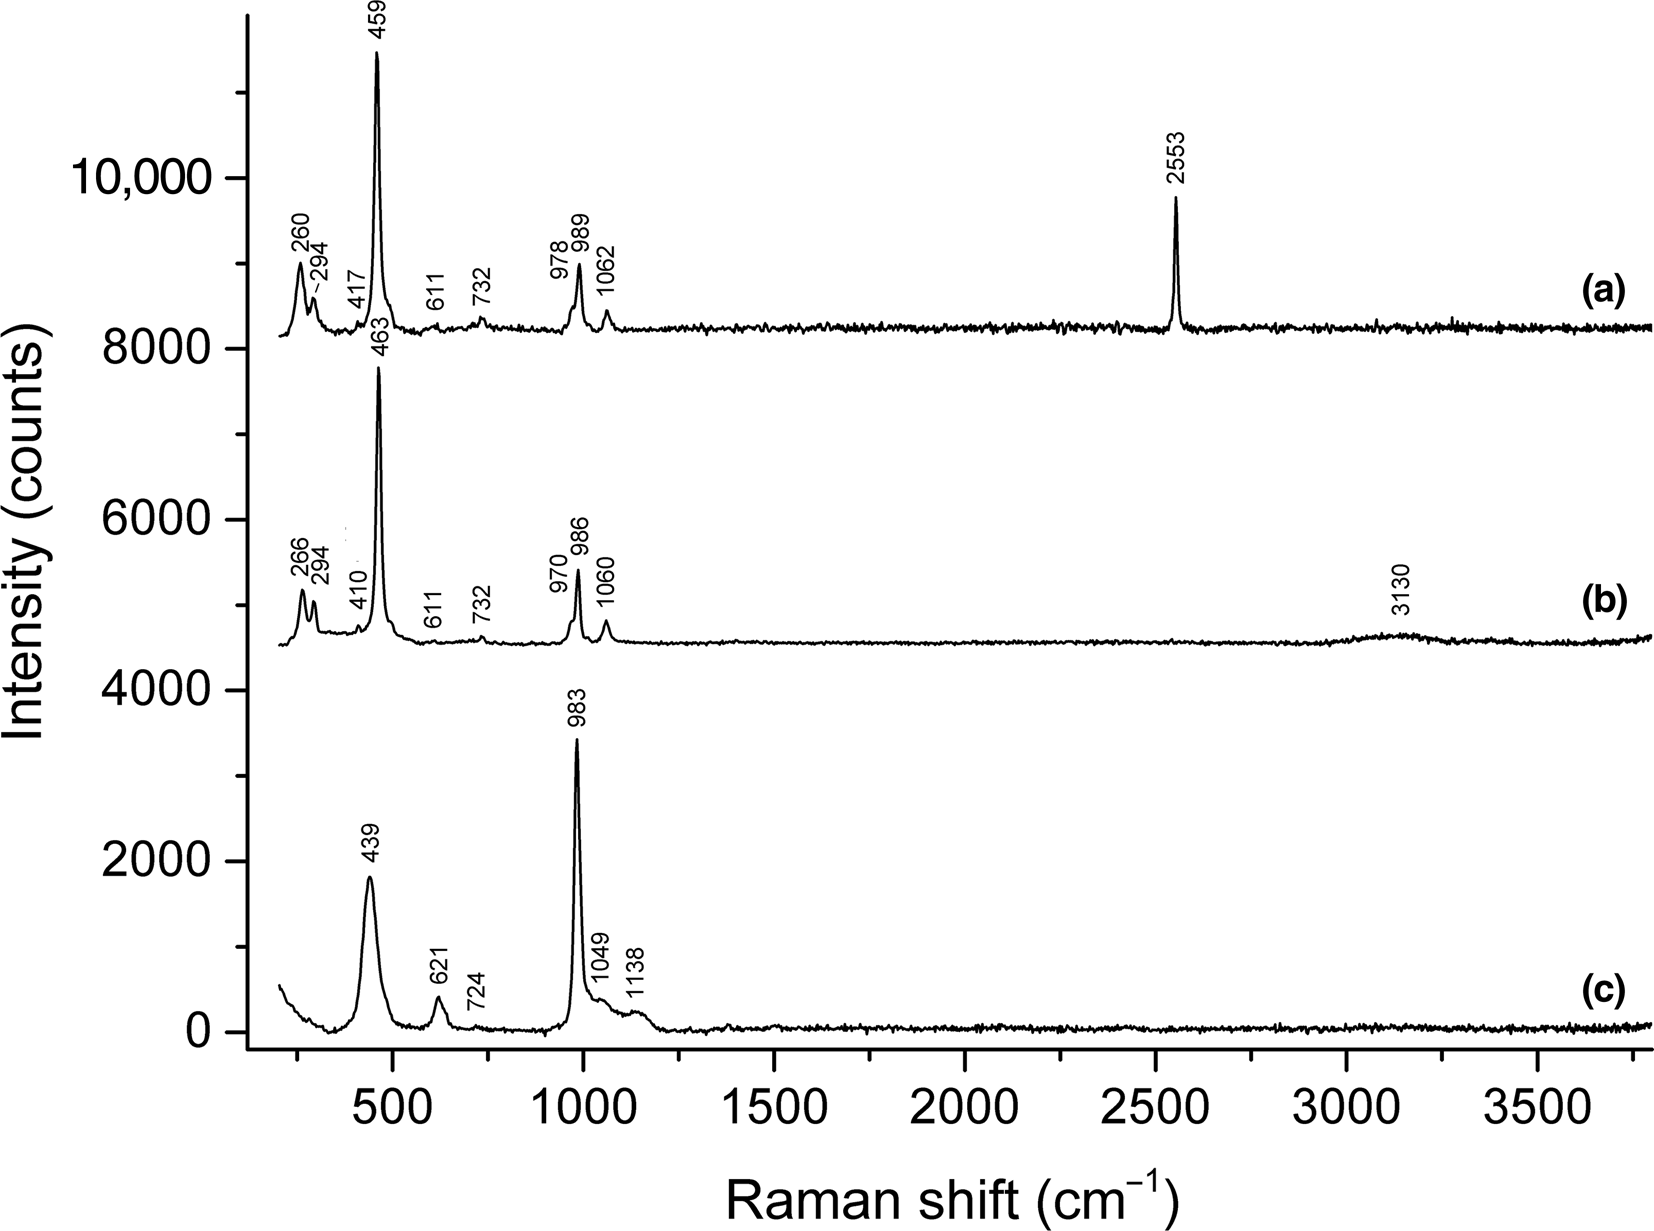
Fig. 5. Raman spectra of: (a) sapozhnikovite; (b) S-free sodalite from the Vishnevogorskiy syenite–miaskite complex; and (c) nosean from the Laach Lake volcano. The spectra are offset for comparison.
The band at 459 cm–1 corresponds to stretching vibrations of the [ClNa4] cluster (Hettmann et al., Reference Hettmann, Wenzel, Marks and Markl2012; see Supplementary figure 3S) and 417 cm–1, presumably, is due to lattice modes involving soft T–O–T bending internal coordinates. Bands at 260 and 294 cm–1 are due to bending vibrations of the [ClNa4] cluster (Hettmann et al., Reference Hettmann, Wenzel, Marks and Markl2012; see Supplementary figure 3S).
The Raman spectrum of S-free sodalite (curve b in Fig. 5) is close to that of HS-sodalite in the range of 200–1200 cm–1 but does not contain the band of stretching vibrations of the HS– anion.
The Raman spectra of sulfate-bearing sodalite-group minerals (including that of nosean: see curve c in Fig. 5) contain bands in the ranges of 1135–1140, 618–625 and 436–442 cm–1 corresponding to the F 2(ν3), F 2(ν4), and E(ν2) modes of SO42–, respectively. These bands are absent in the Raman spectra of sapozhnikovite and S-free sodalite.
In the Raman spectrum of lazurite (Supplementary figure 4S), another sodalite-group mineral containing sulfide sulfur, all observed bands correspond to the S3•– radical anion which is a blue chromophore (Chukanov et al., Reference Chukanov, Sapozhnikov, Shendrik, Vigasina and Steudel2020b). These bands are also absent in the Raman spectrum of sapozhnikovite.
Bands of CO32– are not observed in the Raman spectrum of sapozhnikovite.
Electron spin resonance spectroscopy
In the ESR spectrum of sapozhnikovite, a broad intensive signal with g = 1.99 and a poorly resolved structure is observed (Fig. 6). In addition, very weak signals with g = 2.008 and g = 2.001 are detected (Fig. 6, inset). Assignment of these signals is detailed in the Discussion section below.
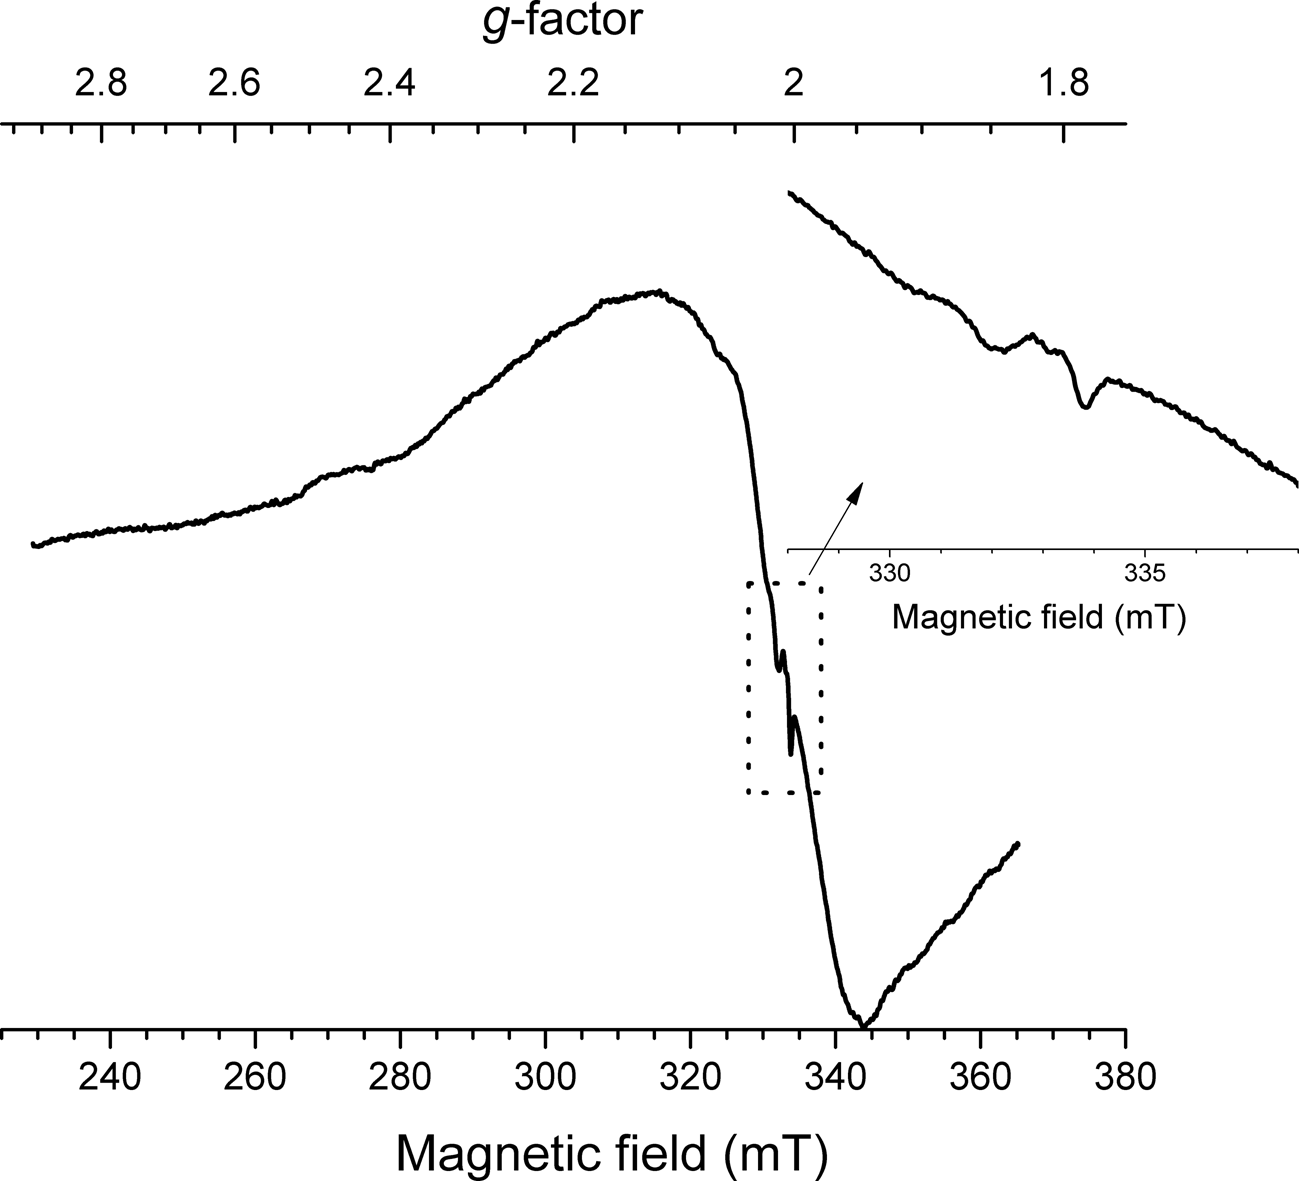
Fig. 6. Room-temperature first derivative ESR spectrum of sapozhnikovite.
In order to estimate any possible content of S2•– in sapozhnikovite (suggested by the signals at g = 2.008 and g = 2.001) the intensity of the ESR signal was compared with the ESR spectrum of haüyne containing 0.06 wt.% of sulfide sulfur obtained under the same conditions (see Chukanov et al., Reference Chukanov, Sapozhnikov, Shendrik, Vigasina and Steudel2020b, Sample LSh). According to optical spectroscopy, ESR and Raman spectroscopy data, only a part of the sulfide sulfur in Sample LSh belongs to S2•–. The intensity of the S2•– signal in the ESR spectrum of sapozhnikovite is about 10 times weaker than the analogous signal of Sample LSh. Both signals are characterised by nearly the same relaxation time. According to these data, the content of S2•– in sapozhnikovite does not exceed 0.006 wt.%. Such low contents of S2•– cannot be detected by means of X-ray structural analysis.
Optical (NIR-Vis-UV) absorption spectroscopy
The diffuse optical absorption spectrum of sapozhnikovite in the near infrared (NIR), visible (Vis), and near ultraviolet (UV) ranges is given in Fig. 7. The bands at ~5200 and ~7000 cm–1 correspond to the stretching and bending combination mode and overtone of O–H stretching mode of the extra-framework H2O molecules, respectively. In addition, absorption bands at ~12,400, ~13,400 and ~17,300 cm–1 and a broad shoulder in the range of 23,000–28,000 cm–1 are observed.
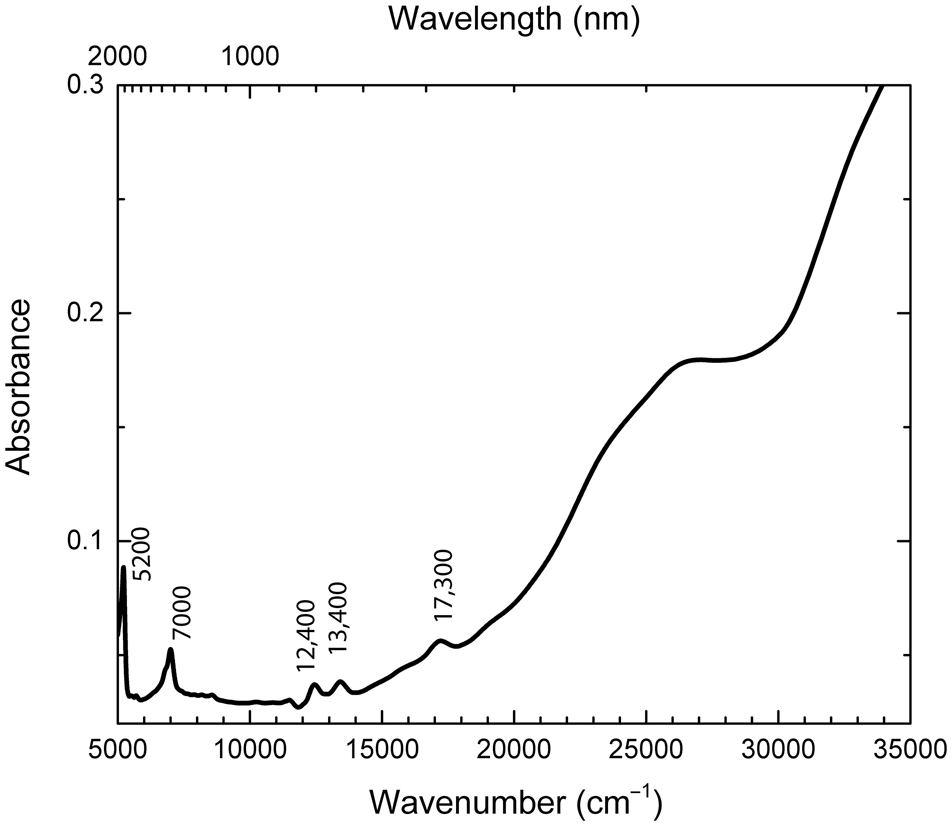
Fig. 7. NIR-Vis-UV absorption spectrum of sapozhnikovite.
Photoluminescence spectroscopy
The photoluminescence spectrum of sapozhnikovite with a maximum at 16,000 cm–1 (Fig. 8) was obtained at 77 K. At this temperature, the vibrational structure of the spectrum is well-resolved with distance between satellites at ~536 cm–1.
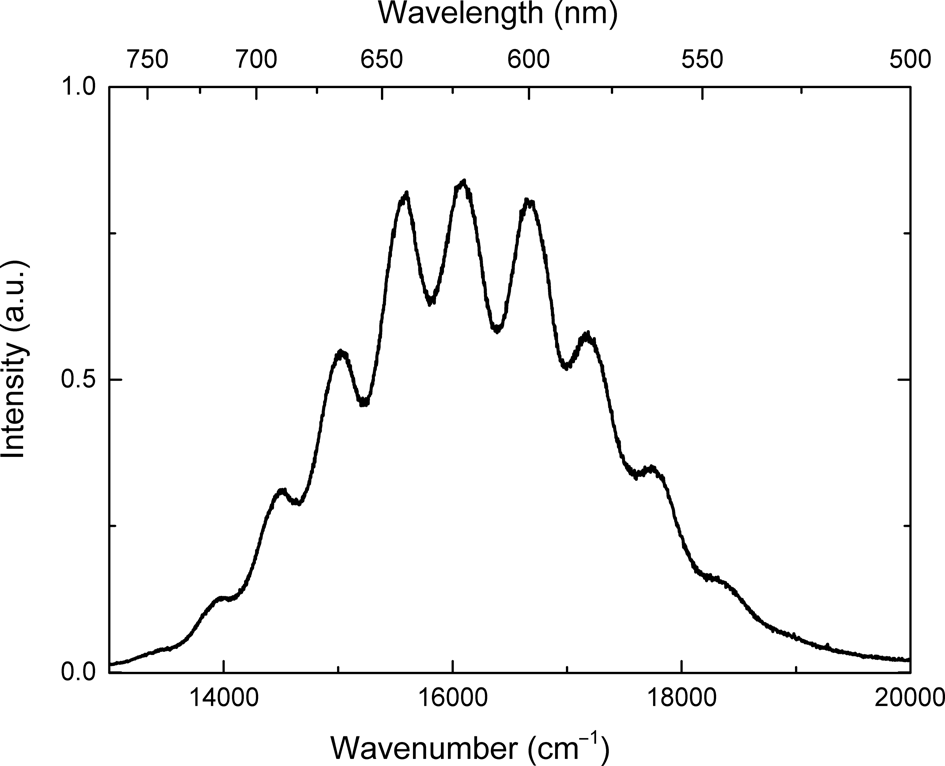
Fig. 8. Photoluminescence spectrum of sapozhnikovite excited by 405 nm (24,690 cm–1) radiation at 77 K.
The excitation spectrum related to observed photoluminescence is given in Fig. 9. A broad band in the range of 23,000–28,000 cm–1 and narrow bands with the maxima at ~30,200, ~35,000 and ~36,700 cm–1 are detected.
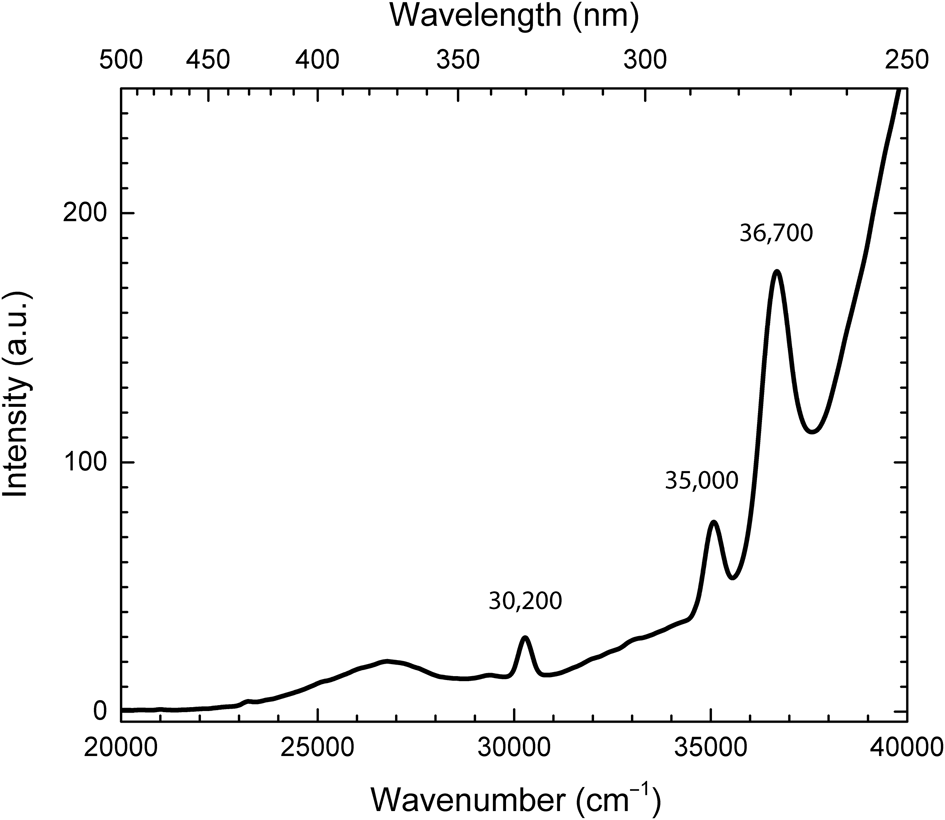
Fig. 9. Excitation spectrum of photoluminescence monitored at 625 nm (16,000 cm–1) at 77 K.
Chemical data
Five spot electron microprobe analyses were obtained for Na, Al, Si, S and Cl and a single gas chromatography analysis was obtained for H, C and N. Grains of sapozhnikovite are quite homogenous chemically (Fig. 10).
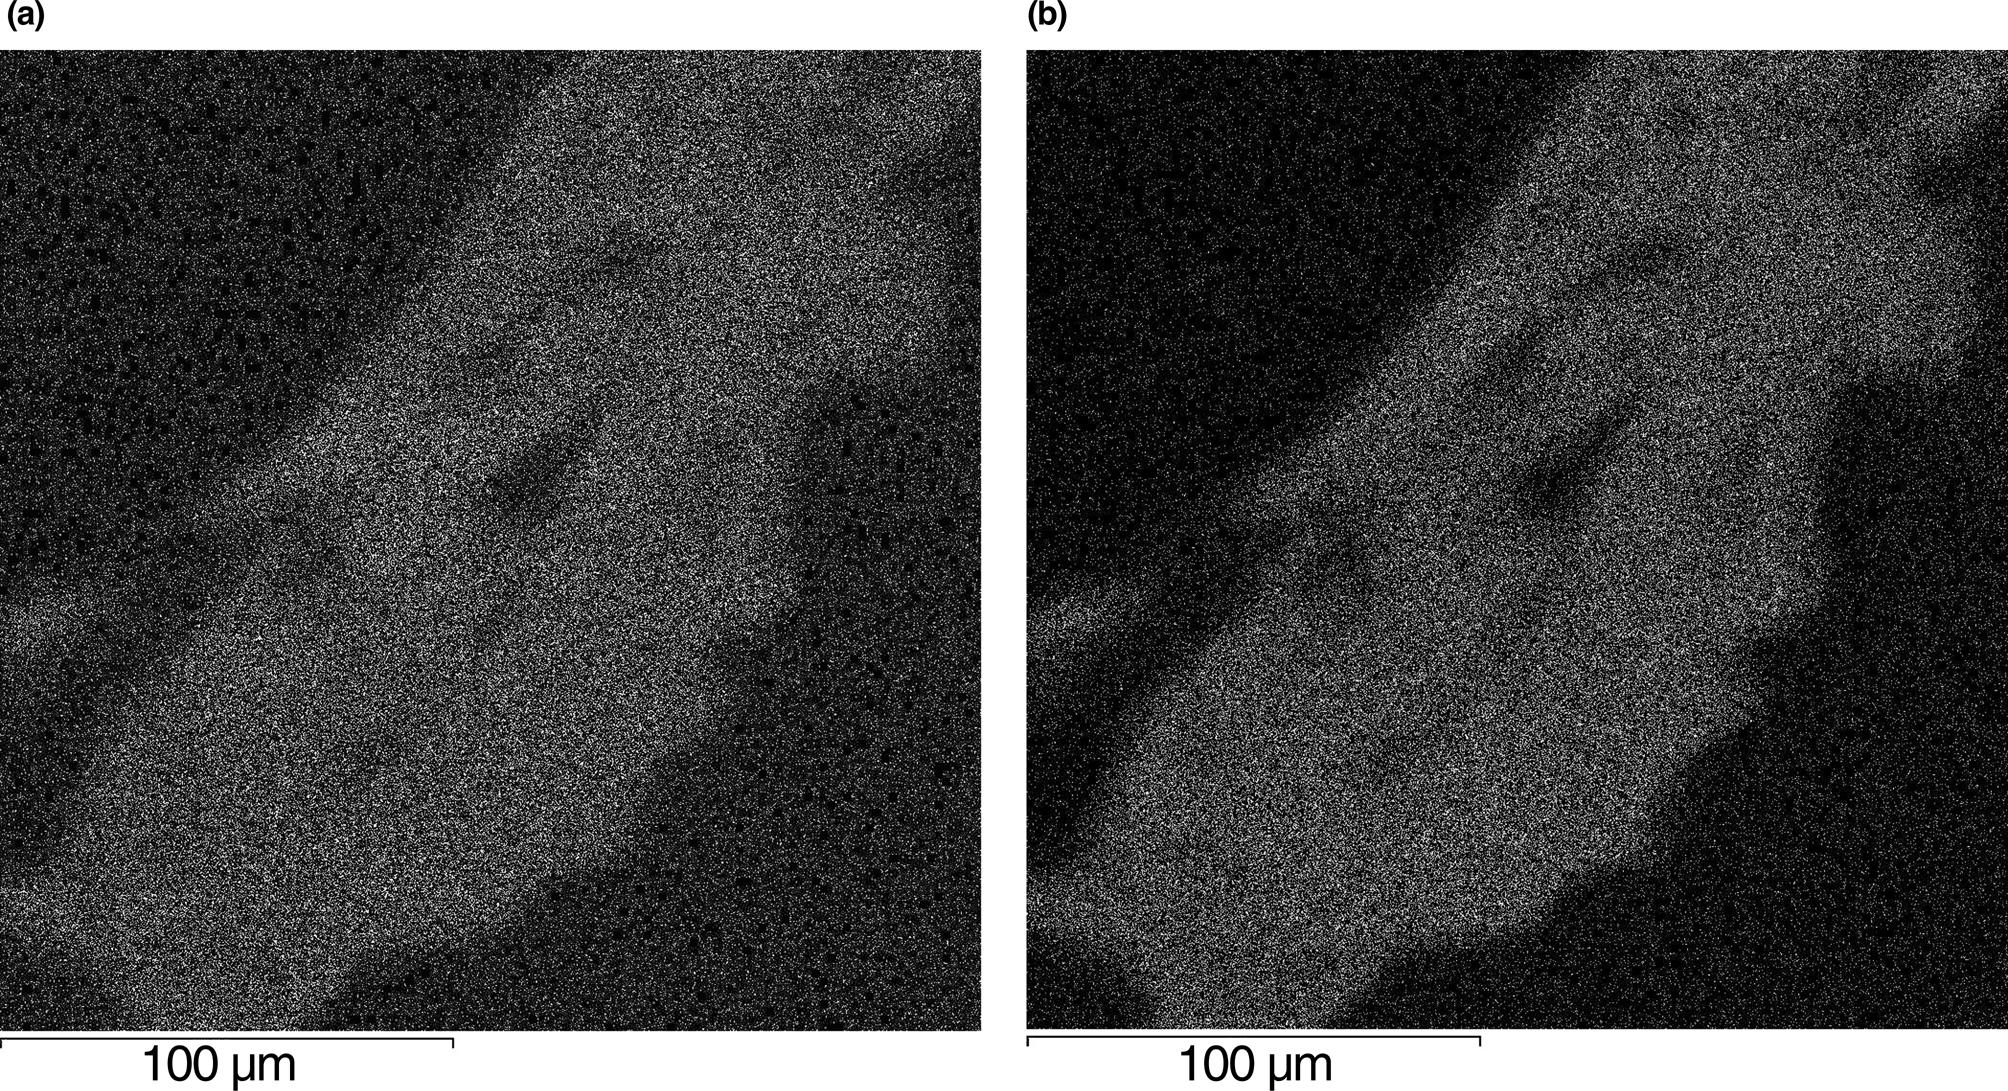
Fig. 10. Images of a sapozhnikovite grain in characteristic X-ray radiation of (a) sulfur and (b) chlorine. Polished section.
Analytical data are given in Table 2. The contents of other elements with atomic numbers higher than that of beryllium are below detection limits, in accordance with IR and Raman spectroscopy and gas chromatography data.
Table 2. Chemical composition of sapozhnikovite.
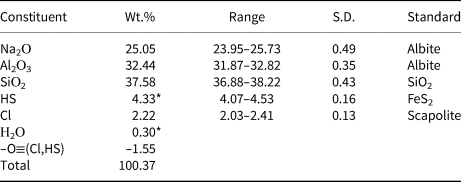
* Hydrogen determined as 1.36 wt.% H2O was apportioned between HS– and H2O based on the sulfur content determined by electron microprobe. S.D. – standard deviation.
Direct determination of oxygen by electron microprobe (under conditions indicated above and using anorthite as a standard) resulted in 40.1 wt.% O. The content of oxygen calculated from the empirical formula is 39.8 wt.%. Taking into account the presence of trace amounts of extra-framework CO2 and COS molecules (below 0.02 wt.% of each, according to the IR spectroscopy data: see above), one can conclude that the calculated and measured contents of oxygen in sapozhnikovite are in a very good agreement. This confirms the absence of oxygen-bearing extra-framework anions (SO42–, SO32–, CO32–, etc.) in sapozhnikovite.
The empirical formula based on 24 framework O atoms is Na7.73Al6.08Si5.97O24(HS)1.25Cl0.60⋅0.16H2O. The simplified formula is Na8(Al6Si6O24)[(HS),Cl,(H2O)]2. The ideal formula of sapozhnikovite is Na8(Al6Si6O24)(HS)2.
X-ray diffraction and crystal structure
Powder X-ray diffraction data of sapozhnikovite are listed in Table 3. The unit-cell parameters refined from the powder data are: a = 8.919(1) Å and V = 709.4(2) Å3.
Table 3. Powder X-ray diffraction data (d in Å) of sapozhnikovite.
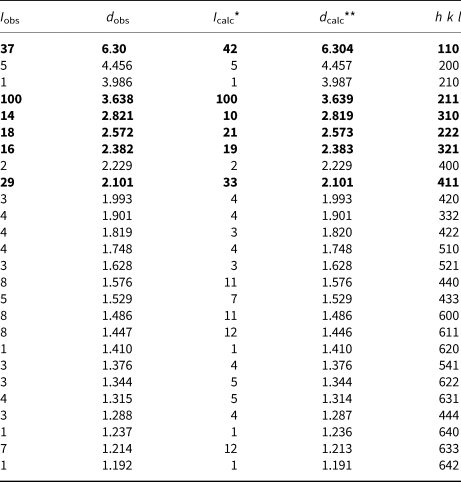
The strongest peaks are given in bold
* For the calculated pattern, only reflections with intensities ≥1 are given
** For the unit-cell parameters calculated from single-crystal data
The crystal structure of sapozhnikovite (Fig. 11) was refined to R 1 = 0.0162 for 334 unique reflections with I > 2σ(I) in the frame of the space group P $\bar{4}$ 3n. Twinning by merohedry Class I (Nespolo and Ferraris, Reference Nespolo and Ferraris2000) with an inversion centre as a twinning operator was found in the crystal studied. The atom coordinates, displacement parameters and site occupancies are presented in Table 4. Selected interatomic distances are given in Table 5. The crystallographic information file has been deposited with the Principal Editor of Mineralogical Magazine and is available as Supplementary material (see below).
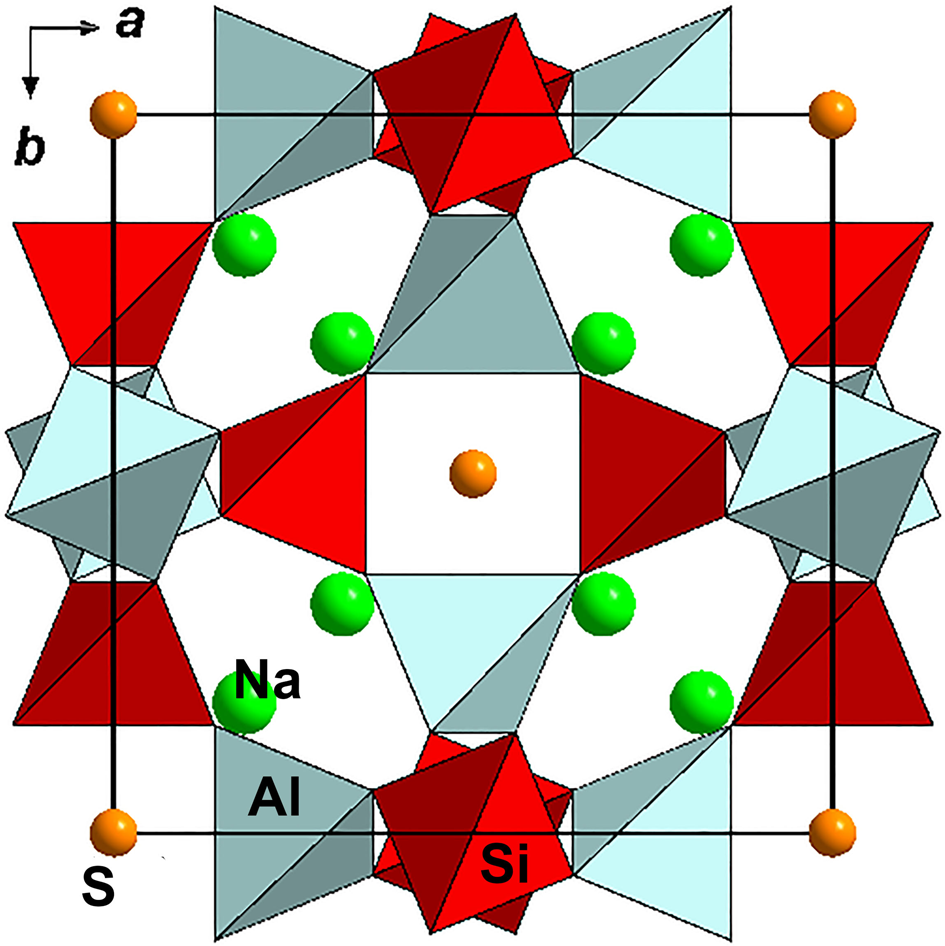
Fig. 11. The crystal structure of sapozhnikovite. Hydrogen atoms are not shown. The unit cell is outlined.
Table 4. Coordinates, equivalent displacement parameters (U eq, in Å2) of atoms and site occupancy factors (s.o.f.) in the structure of sapozhnikovite.
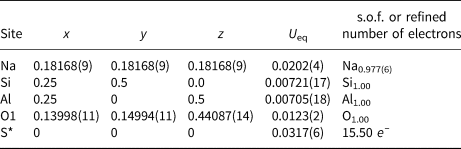
* The occupancy of the S site was refined as S vs. O. Based on chemical data, the refined site occupancy of S0.94(2)O0.06(2) with the number of electrons of 15.50 corresponds to the real occupancy of (HS)0.61Cl0.30(H2O)0.08. Excessive water (0.08 H2O molecules per formula unit: see Table 1) is attributed to the Na site.
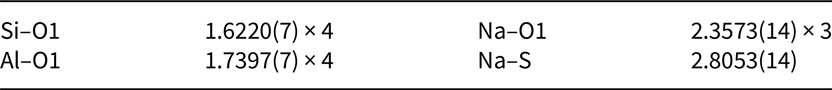
Table 5. Selected interatomic distances (Å) in the structure of sapozhnikovite.
Sapozhnikovite is isostructural to sodalite. In sodalite, extra-framework components (sodium cations and chloride anions) form a [Na4Cl]3+ cluster, which is a distorted tetrahedron. A similar [Na4(HS)]3+ cluster occurs in sapozhnikovite.
Sodalite and sapozhnikovite differ distinctly from sulfate-bearing sodalite-group minerals by lower values of the unit-cell parameter a (below 9.0 Å and above 9.0 Å, respectively) and, respectively, unit-cell volume (see Table 6) that is caused by difference in size between SO42– and oxygen-free anions.
Table 6. Comparative data for sapozhnikovite and related sodalite-group minerals with the [Al6Si6O24] framework having cubic symmetry and the SOD-type topology.
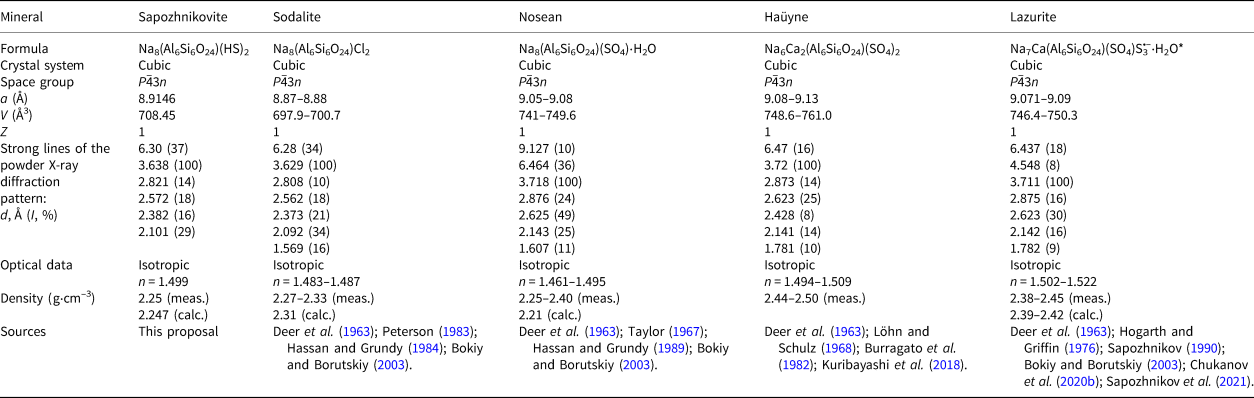
* The revised formula of lazurite was approved by the IMA CNMNC in 2021 (nomenclature proposal 20-H, Miyawaki et al., Reference Miyawaki, Hatert, Pasero and Mills2021).
Discussion
The narrow bands at 12,400, 13,400, and 17,300 cm–1 in the absorption spectrum (Fig. 7) are due to the 4I9/2 → 4F5/2; 4I9/2 → 4F7/2 and 4I9/2 → 4G5/2 transitions in Nd3+ ions (Lin et al., Reference Lin, Chu Rong Gui, Imakita and Fujii2014).
The observed photoluminescence with a maximum at 16,000 cm–1 (Fig. 8) corresponds to the S2•– radical anion (‘•’ denotes unpaired electron). The vibration frequency of S2•– in sapozhnikovite determined from the distance between vibrational satellites is equal to 536 cm–1. In luminescence spectra of admixed S2•– in alkali halides, maxima in the range of 16,900–17,200 cm–1 are observed, and vibration frequency at ~635–655 cm–1 (Kirk et al., Reference Kirk, Schulman and Rosenstock1965). In haüyne, S2•– photoluminescence has a maximum at ~15,600 cm–1 and the vibration frequency of S2•– is ~590 cm–1 (Chukanov et al., Reference Chukanov, Sapozhnikov, Shendrik, Vigasina and Steudel2020b). In sulfur-doped sodalities, S2•– photoluminescence has a maximum at ~15,800 cm–1 and vibration frequency is equal to 560 cm–1 (Sidike, Reference Sidike, Sawuti, Wang, Zhu, Kobayashi, Kusachi and Yamashita2007). In hackmanite, the strongest luminescence peak is located at 16,200 cm–1 and the vibration frequency is equal to 535 cm–1 (Radomskaya, Reference Radomskaya, Kaneva, Shendrik, Suvorova and Vladykin2021).
The broad band in the range of 23,000–28,000 cm–1 in the excitation spectrum (Fig. 9) and the shoulder in the absorption spectrum observed in the same spectral region (Fig. 7) are attributed to the πu → πg* transitions in S2•–. The narrow bands with the maxima at ~ 30,200, ~35,000, and ~36,700 cm–1 are due to the transitions from the 6S7/2 level to 6PJ, 6IJ, and 6DJ in Gd3+, respectively (Pankratova et al., Reference Pankratova, Kozlova, Buzanov, Chernenko, Shendrik, Sarakovskis and Pankratov2020). Gd3+ and Nd3+ ions may be located in sodalite cages.
The ESR signal with g = 1.99 could be attributed to Gd3+. Iton and Turkevich (Reference Iton and Turkevich1977) observed a signal with the same g-factor in ESR spectra of non-orientated and polycrystalline samples of some hydrated zeolites. On the other hand, the ESR spectrum could be due to the axial Fe3+ centres. A similar broad signal has been observed in beryl (Lin et al., Reference Lin, Chen, Huang and Pan2013). Nevertheless, both axial Fe3+ and Gd3+ ions should present at sufficiently high abundances to result in significant dipole interaction that induced line broadening. The large amounts of Fe3+ or Gd3+ ions should be detected in the optical absorption spectrum, however no bands corresponding to Fe3+ or Gd3+ were found. Only traces of Gd3+ are displayed in the photoluminescence excitation spectrum (Fig. 9). Therefore, the origin of this signal remains unclear.
The very weak signal with g = 2.008 has been linked to the S2•– radical anion by Kowalak et al. (Reference Kowalak, Jankowska, Zeidler and Wiećkowski2007). Analogous signals of S2•– have also been observed in the ESR spectra of other sodalite-group minerals (Chukanov et al., Reference Chukanov, Sapozhnikov, Shendrik, Vigasina and Steudel2020b) and ultramarine analogues prepared from zeolites (Kowalak et al., Reference Kowalak, Jankowska, Zeidler and Wiećkowski2007). However, S2•– spectra can be undetectably broadened by radical dynamics and should be very environmentally dependent due to the varying interaction between split π* states of S2•– in different local environments (Rejmak, Reference Rejmak2018). In alkali halides S2•– radicals have been well-studied and g components demonstrate strong anisotropy and variability (Vannotti and Morton, Reference Vannotti and Morton1967; Callens et al., Reference Callens, Maes, Matthys and Boesman1989). In ultramarine, the components of the g-tensor of S2•– [g 1 = 2.69(6), g 2 = 2.03(4) and g 3 = 1.86(4)] are quite different from the g-factor of a free electron (Raulin et al., Reference Raulin, Gobeltz, Vezin, Touat, Ledé and Moissette2011). Therefore, this signal is tentatively assigned to the (SO3)•– radical anion, which, in the ESR spectra of anhydrite and gypsum, shows nearly isotropic signals with g = 2.003–2.004 (Ryabov et al., Reference Ryabov, Bershov, Speranskiy and Ganeev1983; Kasuya et al., Reference Kasuya, Brumby and Chappell1991). The 33S hyperfine structures are difficult to detect for sapozhnikovite due to the very low abundance of the 33S isotope and low intensity of the ESR signal.
Another weak signal with g = 2.001 could be assigned either to an anionic vacancy (Vassilikou-Dova and Lehmann, Reference Vassilikou-Dova and Lehmann1990) or to the S•–/H2S•– centres (Hausmann, Reference Hausmann1966; Symons, Reference Symons1999). The latter assignment seems more probable taking into account the fact that the intensity of this signal was enhanced by light irradiation from a low-pressure mercury lamp with a wavelength of 185 nm. The 2HS– → S•– + H2S•– transformation under the exposure of vacuum UV radiation has been reported by Fischer and Gründig (Reference Fischer and Gründig1965). A similar transformation could occur in sapozhnikovite when exposed to background radiation.
According to the luminescence data, sapozhnikovite contains trace amounts of the S2•– radical anion, however, the ESR signal of S2•– in sapozhnikovite was not detected, which indicates a very low amount of S2•– in the sample studied. Comparisons of the intensity of the signal with haüyne showed that the content of S2•– in sapozhnikovite does not exceed 0.006 wt.%. Such a low content of S2•– cannot be detected by means of X-ray structural analysis, but the fact that S2•– is likely to be present in sapozhnikovite is important to understand the nature of the observed orange–red luminescence under exposure of UV radiation. We assume that a minor amount of S2•– may occur at the S site.
Hypothetically, anionic and neutral extra-framework components occurring in minerals belonging to the sodalite and cancrinite groups, could be used as important geochemical markers as indicators of oxygen, fluorine and sulfur dioxide fugacities (Tauson et al., Reference Tauson, Sapozhnikov, Shinkareva and Lustenberg2011, Reference Tauson, Goettlicher, Sapozhnikov, Mangold, Shinkareva and Lustenberg2012; Chukanov et al., Reference Chukanov, Vigasina, Zubkova, Pekov, Schäfer, Kasatkin, Yapaskurt and Pushcharovsky2020a,Reference Chukanov, Sapozhnikov, Shendrik, Vigasina and Steudel2020b).
Sapozhnikovite is probably a late-stage magmatic mineral. The oxalate-bearing cancrinite-group mineral kyanoxalite Na7(Al5–6Si6–7O24)(C2O4)0.5–1.0⋅5H2O occurring in close association with sapozhnikovite is an important marker of reductive crystallisation conditions (Chukanov et al., Reference Chukanov, Pekov, Olysych, Massa, Yakubovich, Zadov, Rastsvetaeva and Vigasina2010), which resulted in the formation of sapozhnikovite rather than nosean, Na8(Al6Si6O24)(SO4)⋅H2O – a significant component of some peralkaline rocks of the Lovozero massif. Kyanoxalite is the youngest feldspathoid in this rock; it occurs, together with natrolite, in interstices between crystals of nepheline, sapozhnikovite and aegirine, and replaces peripheral zones of sapozhnikovite grains (Fig. 3).
It is noteworthy that the formation of significant segregations of bituminous matter in peralkaline pegmatites is predated, as a rule, by mass crystallisation of aegirine NaFe3+Si2O6 up to the appearance of almost pure aegirine zones in pegmatitic bodies. It is assumed (Ermolaeva et al., Reference Ermolaeva, Chukanov, Pekov and Kogarko2009) that crystallisation of aegirine could be accompanied by the following redox reactions: Na2O + 2FeO + 4SiO2 + CO2 → 2NaFeSi2O6 + CO; Na2O + 2FeO + 4SiO2 + 0.5CO2 → 2NaFeSi2O6 + 0.5C where C is carbon with the oxidation degree of 0. Similar reactions could lead to the formation of reduced forms of sulfur including the HS– anion.
Acknowledgements
The authors are grateful to Peter Leverett, Yuanming Pan, Charles A. Geiger and anonymous referees for the useful discussion. This work was carried-out in accordance with the state task of Russian Federation, state registration number ААAА-А19-119092390076-7. The authors thank the X-ray Diffraction Centre of Saint-Petersburg State University for instrumental and computational resources. The UV/Vis/NIR and photoluminescence spectroscopy was carried out using facilities of the Center for Isotopic-Geochemical Investigations at the Vinogradov Institute of Geochemistry SB RAS. Roman Shendrik has received funding from the Grant of the INRTU Council (15-RAS-2020). IR and Raman spectroscopy investigations were supported by the Russian Science Foundation, grant No. 19-17-00050.
Supplementary material
To view supplementary material for this article, please visit https://doi.org/10.1180/mgm.2021.94


