Introduction
During fertilization, there is an increase in intracellular Ca2+ in the oocyte that is triggered by sperm. This increase is necessary and sufficient stimulus for egg activation and early development, but the exact mechanism of the sperm-induced Ca2+ increase is not well known and may vary in different animal species (Stricker, Reference Stricker1999; Runft et al., Reference Runft, Jaffe and Mehlmann2002; Miyazaki, Reference Miyazaki2006; Whitaker, Reference Whitaker2006; Dale et al., Reference Dale, Wilding, Coppola and Tosti2010; Kashir et al., Reference Kashir, Deguchi, Jones, Coward and Stricker2013). In the fertilized oocyte of deuterostomes, the Ca2+ increase initiates at the spermatozoon-interaction site and propagates to the whole oocyte as a single Ca2+ wave. In mammals and ascidians, periodic Ca2+ increases (Ca2+ oscillations) occur in the oocyte (Kyozuka et al., Reference Kyozuka, Deguchi, Mohri and Miyazaki1998; Dale et al., Reference Dale, Marino and Wilding1999; Deguchi et al., Reference Deguchi, Shirakawa, Oda, Mohri and Miyazaki2000; Miyazaki, Reference Miyazaki2006; Swann & Yu, Reference Swann and Yu2008). The Ca2+ oscillations control the meiotic cell cycle after fertilization in ascidian oocytes (Russo et al., Reference Russo, Kyozuka, Antonazzo, Tosti and Dale1996). These Ca2+ increases are generally provided by inositol 1,4,5-trisphosphate (IP3)-induced Ca2+ release (IICR) though the IP3-receptors on the endoplasmic reticulum (ER) (Terasaki & Sardet, Reference Terasaki and Sardet1991). IP3 is produced as a result of hydrolysis of phosphatidylinositol 4,5-bisphosphate by phospholipase C (PLC), which exists in several different isoforms being regulated in different pathways (Rhee, Reference Rhee2001). In addition, a synchronous Ca2+ increase in the whole egg surface area due to Ca2+ influx (cortical flash) at the moment of fertilization is found in echinoderm and lophotrochozoans, which is regulated by voltage-gated Ca2+ channels (Stricker, Reference Stricker1999; Churchill et al., Reference Churchill, O’Neill, Masgrau, Patel, Thomas, Genazzani and Galione2003; Moccia et al., Reference Moccia, Nusco, Lim, Kyozuka and Santella2006, Deguchi, Reference Deguchi2007). Non-Ca2+-dependent ion currents also work as the activation current during fertilization in ascidian oocytes (Cuomo et al., Reference Cuomo, Silvestre, De Santis and Tosti2006; Tosti et al, Reference Tosti, Gallo and Silvestre2011). Sea urchin eggs possess another pathway for Ca2+ release from the ER, which is due to cyclic ADP-ribose-sensitive Ca2+ releasing through the ryanodine receptor (Stricker, Reference Stricker1999; Miyazaki, Reference Miyazaki2006). The signaling pathway leading to the Ca2+ increase in fertilized eggs varies considerably in different animal species. There are two fundamental hypotheses as to how sperm activate the egg and induce Ca2+ release (Stricker, Reference Stricker1997; Swann & Parrington, Reference Swann and Parrington1999; Runft et al., Reference Runft, Jaffe and Mehlmann2002). The first model requires sperm–egg fusion, and the sperm to trigger Ca2+ release by conducting a soluble content directory into the egg cytoplasm. This idea is supported by the fact that intracytoplasmic sperm injection (ICSI) or injection of sperm extract (SE) induces a Ca2+ increase that may develop into Ca2+ oscillations, an event similar to that in the normally fertilized eggs of mammals, ascidians, and nemertean worm (Stricker, Reference Stricker1997; Kyozuka et al., Reference Kyozuka, Deguchi, Mohri and Miyazaki1998; Sato et al., Reference Sato, Yoshimoto, Mohri and Miyazaki1999; Runft & Jaffe, Reference Runft and Jaffe2000; Yoon & Fissore, Reference Yoon and Fissore2007). In mammals, a key sperm factor was identified as a novel sperm-specific PLC, PLCζ (Saunders et al., Reference Saunders, Larman, Parrington, Cox, Royse, Blayney, Swann and Lai2002; Yoon & Fissore, Reference Yoon and Fissore2007; Swann & Yu, Reference Swann and Yu2008).
The second hypothesis on how sperm activate the egg and increase Ca2+ during fertilization is based on signal transduction through the receptors on the egg surface. The binding of sperm to its receptor on the egg surface activates G-proteins and/or protein tyrosine kinase (PTK), then the downstream effector PLCs produce IP3, which in turn evokes Ca2+ release from the intracellular stores. Whereas PLCβ is activated by G-proteins, PLCγ is activated by PTK. In Xenopus and echinoderms, where application of sperm protease causes egg activation, PTK inhibitors such as PP1 and genistein either inhibit or cause significant delay of Ca2+ increase at fertilization (Carroll & Jaffe, Reference Carroll and Jaffe1995; Mizote et al., Reference Mizote, Okamoto and Iwao1999; Shen et al., Reference Shen, Kinsey and Lee1999; Abassi et al., Reference Abassi, Carroll, Giusti, Belton and Foltz2000; Sato et al., Reference Sato, Tokmakov, Iwasaki and Fukami2000). The SH2 domain proteins, which work as a specific competitive inhibitors of PTK or PLCγ activity, inhibit Ca2+ increase and egg activation in echinoderms (Abassi et al., Reference Abassi, Carroll, Giusti, Belton and Foltz2000; Runft et al., Reference Runft, Jaffe and Mehlmann2002). The PTK inhibitors and these SH2 domain proteins, however, did not block Ca2+ increase in the fertilized eggs of mouse, in which IP3-induced Ca2+ increase is essential for Ca2+ release at fertilization (Dupont et al., Reference Dupont, McGuinness, Johnson, Berridge and Borgese1996; Mehlmann & Jaffe, Reference Mehlmann and Jaffe2005). Mammalian oocytes overexpressing the G-protein/PLCβ interactive receptor showed a Ca2+ increase upon the addition of its ligand PDGF (Mehlmann et al., Reference Mehlmann, Carpenter, Rhee and Jaffe1998). This result indicates that the mammalian oocyte, which is categorized as a fusion type oocyte for Ca2+ increase, also possess the potentiality to respond to the ligand from the outside of the oocyte. In amphibian, urodele newt oocytes can be activated by injection of sperm extract. However, the factor that induced Ca2+ increase was citrate synthase, and not PLCs, although the anuran frog oocyte was considered to employ a receptor-based signaling cascade at fertilization (Harada et al., Reference Harada, Matsumoto, Hirahara, Nakashima, Ueno, Oda, Miyazaki and Iwao2007, Reference Harada, Kawazoe, Eto, Ueno and Iwao2011). Therefore, although fertilization is such a fundamental process for conservation of species, the exact mechanism of egg activation varies widely among animal species, and it is difficult to allocate mechanisms strictly into the two types.
Two different modes of Ca2+ increase are observed in echinoderm fertilization, these are the cortical flash and the Ca2+ wave (Churchill et al., Reference Churchill, O’Neill, Masgrau, Patel, Thomas, Genazzani and Galione2003; Moccia et al., Reference Moccia, Lim, Nusco, Ercolano and Santella2003). These two events take place at a short interval apart or almost at the same time during fertilization. The oocyte of a given species may have several different mechanisms of increasing Ca2+ during fertilization. When multiple types of Ca2+ releasing mechanisms are at work during fertilization, each phase of the Ca2+ response may play a distinct physiological role and may provide a unique opportunity to study their relationships with each other.
In this study, we used the annelidan worm Pseudopotamilla occelata, which has a time lag between two different Ca2+ increases in the fertilized oocyte (Nakano et al., Reference Nakano, Kyozuka and Deguchi2008). It is a suitable animal model in which to analyze how sperm induce Ca2+ increase and initiate egg activation. In this species, it is evident that two different mechanisms of Ca2+ increase are at work during fertilization, but it is still unclear how these Ca2+ increases occur and how the fertilizing sperm trigger these Ca2+ increases in the oocyte. Here, we have examined how egg activation at fertilization initiates in this species in the light of the aforementioned hypotheses. To this end, we prepared soluble SE from this species. External application of SE to the matured oocyte mimicked the first-step Ca2+ increase at fertilization, but it could not induce the second phase of the Ca2+ increase in the whole oocyte, suggesting that these two phases of the Ca2+ increase are controlled by two different mechanisms.
Materials and methods
Biological materials and gametes
Sexually mature Pseudopotamilla occelata (P. occelata) were collected from rocky shores around the Asamushi Marine Biological Station or obtained from the fishing-tackles store in Kuji City (Iwate Prefecture) during the breeding season from May to November in 2008, 2009 and 2010. Animals were kept in running seawater at 5–15°C. Prophase-arrested oocytes (immature oocytes) from the ovary were collected by dissection and were suspended and washed several times in filtered seawater (FSW). To obtain mature oocytes suitable for fertilization, these immature oocytes were stimulated with 400 μM 8-bromo-cAMP (8-Br-cAMP; Sigma) and 10 mM Tris (pH 9.0–9.5) for 20 min at 20°C, as has been descried previously (Nakano et al., Reference Nakano, Kyozuka and Deguchi2008). Only the optimal oocytes displaying germinal vesicle breakdown 20 min after the incubation were used in the experiment. Likewise, sperm were obtained from fully matured male worms and kept without dilution at 4°C until use.
Ca2+ imaging
Immature oocytes were pressure injected with calcium green-1 dextran, (CGD; Molecular Probes; 3000 MW) at 1 mM in the injection buffer (100 mM potassium aspartate and 10 mM HEPES, pH 7.0) in low Ca2+ seawater, which was a mixture of FSW and Ca2+-free sea water (CaFSW) (1:19). The injection volume was typically 4–8% of the total oocyte volume. The dye-loaded oocytes were then induced to mature by use of 8-Br-cAMP, as described above.
For Ca2+ measurement, oocytes were put in a chamber, which was a 3-cm plastic dish with 1-cm hole at the bottom. The hole was sealed with a coverslip. A piece of double-sided Scotch® tape and another small piece of coverslip were placed on top to make a 130-μm space between the two coverslips. The oocyte to be used for measurement was placed in the space between the upper and lower coverslips, and soaked in about 400 μl of the medium.
Intracellular Ca2+ changes were measured by the fluorescence change in CGD using a cooled charge coupled device (CCD) camera (Coolsnap cf, Nippon Rooper) attached to an inverted epifluorescence microscope (IMT-2, Olympus). The image processing method was essentially the same as those described previously (Deguchi & Morisawa, Reference Deguchi and Morisawa2003; Deguchi et al., Reference Deguchi, Kondoh and Itoh2005). The fluorescence intensity after the Ca2+ response (F) was normalized to the resting value (F0) and indicated relative fluorescence was calculated (F/F0).
Sperm extract
All the procedures for sperm extraction were performed at 4°C. Undiluted 400–600 μl dry sperm were washed twice in CaFSW containing 1 mM ethylene glycol tetra-acetic acid (EGTA) and centrifuged at 1000 g for 5 min. After washing in CaFSW without EGTA, the sperm concentration was adjusted to ~8.2 × 10¹² sperm/ml using a hemacytometer and divided into 200 μl in each 1.5 ml tube. The sperm suspension was centrifuged at 4000 g for 5 min. After removing the supernatant, the packed sperm were frozen at –80°C. Frozen sperm were re-suspended in 400 μl of extraction buffer containing 100 μg/ml soybean trypsin inhibitor (Sigma), 1 mM phenylmethylsulfonyl fluoride (Sigma), and 5 mM HEPES (pH 7.0). The suspended sperm pellet was homogenized with a Teflon microhomogenizer. After centrifugation at 15,000 g for 30 min, the supernatant was transferred into a new tube and centrifuged again at 15,000 for 20 min. The supernatant was collected as soluble SE. The concentration of protein and estimated number of sperm in the SE solution were about 3.3 mg/ml and 4.1 × 10¹² sperm/ml, respectively. The SE was lyophilized and stored at –20°C. Powdered SE was diluted in the injection buffer (SE, ~330 μg proteins/ml) prior to use. The effect of addition of 10 times concentrated SE (10× SE, ~3.30 mg proteins/ml) was examined in some experiments.
Sperm extract characterization
To test the heat stability of SE, SE was boiled at 100°C for 15 min. The boiled SE was centrifuged at 15,000 g for 30 min, and the supernatant was examined as a ‘boiled SE’. To examine the protease sensitivity, the boiled SE was incubated with 0.1% protease (actinase E, Kaken Chemical Co., Japan) at 20°C for 3 or 6 h. After the treatment, SE was boiled again for 15 min to inactivate protease activity and centrifuged at 15,000 g for 30 min.
Removal of the vitelline envelop
For microinjection into the mature oocyte, the vitelline envelope was removed with a razor blade in a hypertonic solution as described previously in a mixture of 1.5 M NaCl and CaFSW (2:1) (Nakano et al., Reference Nakano, Kyozuka and Deguchi2008). The vitelline envelope-free oocytes were washed with FSW briefly and subjected to the quantitative injection in CaFSW.
Reagents
Stock solutions of a PLC inhibitor, U73122 (Biomol Research Labs., Inc) and its inactive analogue U73343 (Biomol Research Labs., Inc.), and Src family PTK inhibitor set (Calbiochem) including genistein, herbimycin A (HA), PP2 were dissolved in dimethylsulfoxide (DMSO) as stock solutions. Caged IP3 (Calbiochem), a metabolically stable analogue of guanosine diphosphate (GDPβS, Sigma) and a hydrolysis-resistant analogue of guanosine triphosphate (GTPγS Sigma) were dissolved in the injection buffer. These reagents were kept at –20 or –80°C until use. U73122, U73343, genistein and HA were diluted to 1 μM, 10 μM, 100 μM and 5 μg/ml (8.7 μM) in FSW or CaFSW prior to use. In other experiments, genistein, PP2, GDPβS and caged IP3 were co-injected with CGD into immature oocytes at 4–8% of the oocyte volume. While pipette concentrations of genistein, PP2 and caged IP3 were 2 mM, 200 μM and 100 μM, GDPβS concentration was 20 or 40 mM. To activate the caged IP3, the loaded oocytes were irradiated with ultraviolet (UV) light for 3 s.
Results
External application of SE induces Ca2+ increase in the oocyte
Mature oocytes of P. occelata have a wide perivitelline space between the plasma membrane and the vitelline envelope of the oocyte. During fertilization, the spermatozoon is attached to the vitelline envelope. Then the first-step local Ca2+ increase occurs at the cortex under the fertilizing spermatozoon before it enters the newly formed cytoplasmic protrusion (CP) in the perivitelline space. The second-step global Ca2+ increase in the whole cortex of oocyte takes place after the fertilizing spermatozoon has entered the CP (Fig. 1 A, A′) (Nakano et al., Reference Nakano, Kyozuka and Deguchi2008). To understand how the initial interaction between sperm and oocyte induces an intracellular Ca2+ increase in the oocyte, we prepared soluble SE and examined its capability for Ca2+ increase. External application of SE induced a Ca2+ increase in most of the oocytes examined (Fig. 1 B, B′). The Ca2+ increase started at 4–55 s after SE application from the region where SE was added, and the wave propagated to the antipode though the cortex (31/34; Figs 1 B, B′). The Ca2+ peak value around the SE-applied region was similar to that at the initiation site of the first-step Ca2+ increase during fertilization (Table 1). The Ca2+ increase induced by the external application of 10× SE was larger than that of 1× SE (6/6; Fig. 1 C, C′), but it did not induce the second-step Ca2+ increase (Table 1). The CP was observed in some oocytes after SE application (Table 1), but polar body protrusion and further meiotic division did not proceed.
Table 1 Characteristics of Ca2+ change and following cytoplasmic protrusion (CP) formation during fertilization or by external application of sperm extract (SE)

a Values refer to the time between SE application and the first detection of Ca2+ increase (mean ± standard deviation (s.d.)).
b Peak values in the oocytes after insemination or SE application are calculated in the initiation site of Ca2+ increase (or SE additional site), the center, and the antipode, separately. Values include only those eggs that showed a Ca2+ increase, which defined by a >1.06 peak value (mean ± s.d.).
c The formation of CP was monitored after oocytes showed Ca2+ increases.
d SE was applied externally to the oocytes at the exposed whole or local surface.

Figure 1 Sperm or sperm extract (SE) induces an intracellular Ca2+ increase. An unfertilized oocyte underwent a two-step Ca2+ increase following insemination (A). (A′) is the shaded region of (A). The Ca2+ increase was induced by external application of 1× SE (B, B′) or 10× SE (C, C′) in filtered seawater (FSW). Arrows indicate the time of insemination or SE addition. SE (10–15 μl) was added to oocytes in 400 μl FSW. F/F0 values were calculated at the initiation site of local Ca2+ increase or the SE added side, the center, or the antipode, separately, and are represented by three different lines (shown in insets of A, B). The profiles of fluorescence changes were also expressed as pseudocolor fluorescence images (B′, C′). The pseudocolor images were acquired by normalizing the resting image just before the Ca2+ increase in a pixel-to-pixel manner at the indicated time (s).
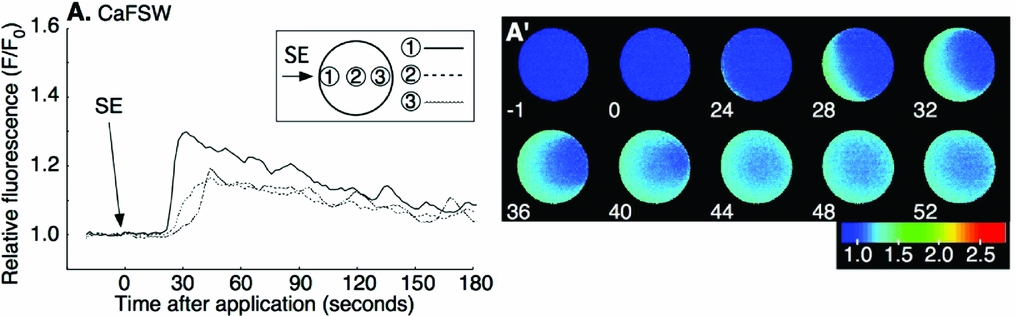
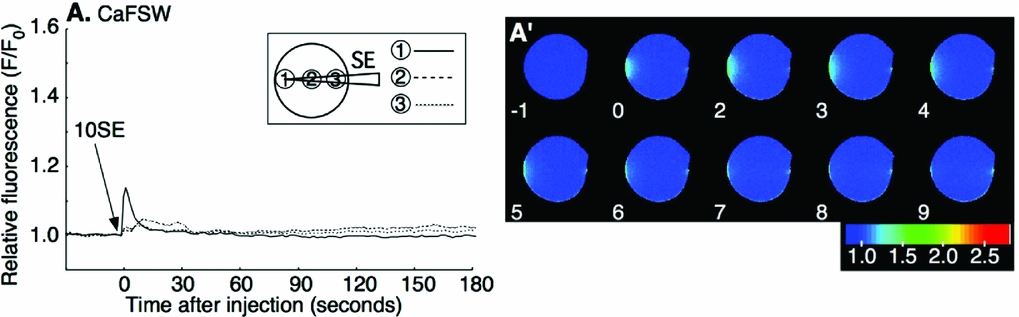
Our previous study indicated that the first-step Ca2+ increase at fertilization does not require the presence of external Ca2+. To see whether the SE-induced Ca2+ increase also needed no external Ca2+, SE was applied in Ca2+-free seawater (CaFSW). Most oocytes showed a Ca2+ increase after SE application (26/28; Fig. 2 A, A′). There was neither a significant decrease of the Ca2+ peak amplitude nor a delay in the onset of the Ca2+ increase in CaFSW compared with that in FSW (P > 0.1; Table 1). Then SE was injected into the peripheral region of denuded oocytes in CaFSW. The injected amount was restricted to 0.4–0.5% (6.3–7.8 pl) of the oocyte volume. No Ca2+ response (8/10) or a small Ca2+ transient just around the tip of the needle (2/10) was observed during microinjection, the peak amplitude of which was barely above the background level, e.g. 1.13 and 1.16 (F/F0), in contrast with the high Ca2+ increase induced by fertilizing sperm (2.6–3.2 sperm/oocyte). The eggs microinjected with 10× SE (equivalent to 25.5–31.9 sperm/oocyte) made no difference except that the small Ca2+ increase observed around the tip of needle lingered for a few seconds (8/10; Fig. 3 A, A′). The Ca2+ peak value of 10× SE injection was merely 1.19 ± 0.08 (n = 8) at the microinjected site, a value far smaller than that of the first-step Ca2+ increase at fertilization (P < 0.05, see Table 1). No Ca2+ change was observed by injecting the buffer as a control (0/7; data not shown). These results show that SE has no evident direct role inside the oocyte, and that the Ca2+ increase induced by the external application of SE is derived from the internal stores of the oocyte.

Figure 2 Ca2+ increase induced by external application of sperm extract (SE) in Ca2+-free seawater. The Ca2+ increase was induced by external application of 1× SE in Ca2+-free filtered seawater (CaFSW) (A). Arrows indicate the time of SE addition. The pseudocolor images were acquired by normalizing the resting image just before the Ca2+ increase in a pixel-to-pixel manner at the indicated time (s) (A′).

Figure 3 Microinjection of sperm extract (SE) into the oocyte in Ca2+-free seawater. Oocytes were microinjected with 10× SE (10SE) at time zero. Arrow indicates the time of microinjection. 10× SE was microinjected at the peripheral region of the oocyte and F/F0 values were calculated at the initiation site of local Ca2+ increase or the SE-injected side, the center, or the antipode, separately, and are represented by three different lines (A). The pseudocolor images were acquired by normalizing the resting image just before the Ca2+ increase in a pixel-to-pixel manner at the indicated time (s) (A′).
Local application of SE mimics the first phase of the Ca2+ response to the fertilizing sperm by inducing a non-propagating intracellular Ca2+ increase
The external application of SE induced a Ca2+ increase in the cortex. During fertilization, the first-step Ca2+ increase was localized underneath a fertilization sperm. Thus, we tested if local application of SE would bring about such an effect. To this end, the oocyte was sucked into a glass capillary (inside diameter of the tip; 100–130 μm) and only the local surface of the oocyte was exposed to SE, which was added to the FSW in the chamber. The external application of SE in the chamber induced a Ca2+ increase around the open region of the surface but the Ca2+ increase did not propagate well to the antipode of the oocyte deep in the capillary (12/12; Fig. 4 A, A′). The external application of 10× SE induced a larger local Ca2+ increase, but again the Ca2+ increase did not propagate to the whole cortex (5/5; Fig. 4 B). An oocyte sucked into narrower glass capillary showed clearly that the Ca2+ increase at the cortex was larger than that at center (Fig. 4 C, C′).

Figure 4 External application of sperm extract (SE) to the partial cortex induces an intracellular Ca2+ increase and the formation of a cytoplasmic protrusion (CP). 1× SE (SE) (A, A′); or 10× SE (10SE) (B); was applied to the oocytes placed within the glass capillary (diameter of ~100 μm) in filtered seawater (FSW). The oocyte in (A) is the same as in (A′). Arrowheads indicate the formation of the CP (A′, 120 s). The difference in relative fluorescence (F/F0) in the oocyte in the glass capillary at the peak of calcium level from the SE-applied side (L) to the opposite side (R) (C, C′). The periphery region (dotted line shown in (C) 45 s) and the center region of the oocyte (continuous line shown in (C) 45 s) were measured separately (C′). The peak calcium level in each oocyte at the SE-applied region. When the relative fluorescence (F/F0) was higher than 1.35, the CP was formed (D).
During fertilization, the CP is formed following the first-step Ca2+ increase. Here, 58% (7/12) of SE-exposed oocytes formed the CP around the SE-applied region (Fig. 4 A′ arrowhead, 120 s), and 80% (4/5) of oocytes formed the CP with the application of 10× SE. The Ca2+ peak value around the CP formed by SE application was more than 1.35 (F/F0) (Fig. 4 D), which was similar to that of the first-step Ca2+ increase during fertilization (Table 1). Thus, local application of SE induced a non-propagated Ca2+ release with the formation of the CP in the cortex, a result comparable with the first-step Ca2+ response at fertilization.
PLC inhibitor U73122 suppresses the SE-induced intracellular Ca2+ increase
The first-step Ca2+ increase during fertilization depends upon IICR, which is inhibited by PLC inhibitor, U73122 (Nakano et al., Reference Nakano, Kyozuka and Deguchi2008). To see if the SE-induced Ca2+ release is also due to IICR, we examined the effect of U73122 on SE application. The mature oocytes were preincubated for 5 min in CaFSW containing 10 μM U73122, and SE was applied in the same medium. The Ca2+ increase was blocked in 69% (11/16) of the cases (Fig. 5 A). The rest of the U73122-treated oocytes (5/16) showed a much reduced Ca2+ peak amplitude and a significant delay of Ca2+ increase (Table. 2). Addition of U73343, the inactive analogue of U73122, had no such effect, displaying virtually the same Ca2+ increase as in non-treated control eggs (15/15; Fig. 5 B). These results indicated that the SE induced the Ca2+ response through the IICR, just as the first-step Ca2+ response to the fertilizing sperm depends on it.

Figure 5 Inhibition of sperm extract (SE)-induced intracellular Ca2+ increase by U73122. Oocytes were incubated for 5 min in Ca2+-free filtered seawater (CaFSW) containing 10 μM U73122 (A); or U73343 (B); and 1× SE was added in same solution.
The SE-induced intracellular Ca2+ increase is inhibited by GDPβS
As SE induced the Ca2+ increase in the oocyte only when it was applied externally, we speculated that a cell surface receptor-mediated signaling pathway must be involved in the process. Upon ligand–receptor interaction, G-protein or PTK is thought to activate PLC to produce IP3 and Ca2+. To test if the SE-induced Ca2+ increase is due to G-protein, or a PTK related pathway, we examined the effect of a stable deactivator of G-protein (GDPβS) and the PTK inhibitors (genistein, HA, and PP2).
The microinjection into immature oocytes of 20 mM or 40 mM of GDPβS (pipette concentration) did not affect the progress of the maturation process, which was induced by cAMP (data not shown). However, the same treatment significantly inhibited the SE-induced Ca2+ increase in a dose-dependent manner. No Ca2+ increase was observed in 30% of eggs (3/10) microinjected with 20 mM GDPβS (final concentration: 0.8–1.6 mM), and at 40 mM GDPβS (final concentration: 1.6–3.2 mM), over 64% (9/14) of oocytes failed to display a Ca2+ increase after the external application of SE (Fig. 6 A, E, F). In comparison with the control eggs, the amplitude of the Ca2+ peak was also reduced in the eggs injected with 20 mM and 40 mM GDPβS-injected oocytes (Table 2).

Figure 6 Inhibition of sperm extract (SE)-induced intracellular Ca2+ increase by GDPβS but not by tyrosine kinase inhibitors. The rate of Ca2+ increase after SE application in various inhibitors (A). Oocytes were incubated for 30–60 min in filtered seawater (FSW) containing 100 μM Genistein (B); or 5 μg/ml herbimycin A (HA) (C); then 1× SE was added in the same solution. The other oocytes were co-injected with calcium green dextran and 200 μM PP2 (final concentration: 8–16 μM) (D); 20 mM GDPβS (final concentration: 0.8–1.6 mM) (E); or 40 mM GDPβS (final concentration: 1.6–3.2 mM) (F); then 1× SE was added into the same solution.
Table 2 Inhibitory effects on Ca2+ increase induced by external application of sperm extract

a Values refer to the time between SE application and the first detection of Ca2+ increase (mean ± standard deviation (s.d.)).
b Peak values in the oocytes after SE application are calculated in the SE additional site, the center, and the antipode, separately. Values include only those eggs that showed Ca2+ increase, which was defined by a >1.06 peak value (mean ± s.d.).
c Significant longer than U73343-treated oocytes (Student's t-test, P < 0.001).
d Significant less than U73343-treated oocytes (Student's t-test, P < 0.05).
e Significant less than non-injected control oocytes (Table 1) (Student's t-test, P < 0.05).
In contrast, the general inhibitors of PTK make no difference to the SE-induced Ca2+ increase in the oocytes. When mature oocytes were preincubated for 30–60 min in the presence of 100 μM genistein or 5 μg/ml HA in FSW, all the oocytes showed a normal Ca2+ increase after the application of SE (4/4, 5/5 respectively; Fig. 6 A–C). Likewise, microinjection of 200 μM PP2 (final concentration: 8–16 μM) showed the same Ca2+ increase as the non-injected control after SE addition (5/5; Fig. 6 A, D). These results indicated that the G-protein-linked receptor on the oocyte surface, but not the PTK-linked receptor, is involved in the Ca2+ increase in response to SE.
GDPβS inhibited the first-step Ca2+ increase during fertilization
Based on the above results, we examined whether the first-step Ca2+ increase during fertilization is also regulated by the G-protein-coupled receptor. We found that all the oocytes injected with 20 mM GDPβS produced only a small and short-lived first-step Ca2+ increase at fertilization (7/7; Fig 7 A, A′). The Ca2+ peak (F/F0) was 1.23 ± 0.03 at the initiation site of the Ca2+ increase (n = 7), which was significantly reduced from that of the non-injected control oocytes (P < 0.05, see Table. 1). The CP was not formed immediately after a small Ca2+ increase. These small Ca2+ increases were repeated several times at the same region, then the CP formation was accomplished (Fig. 7 A′ arrowhead, 95 s). Nonetheless, the second-step Ca2+ increase followed in an apparently usual way, suggesting that G-protein receptor signaling pathway is not involved in the second stage of the Ca2+ response at fertilization. Likewise, the Ca2+ response of the oocytes after injection of 40 mM GDPβS showed only sporadic miniature Ca2+ spots that lasted few seconds (7/10, Fig. 7 B, 7B1′, B2′ arrows, 0 and 47 s). Conversely, PTK inhibitors, such as genistein, HA, and PP2, had no effect on the first-step Ca2+ increase during fertilization (data not shown). These results clearly indicated that the first-step Ca2+ increase during fertilization was regulated by a G-protein mediated pathway.

Figure 7 Inhibition of first-step Ca2+ increase by GDPβS but not by tyrosine kinase inhibitors. Oocytes were co-injected with calcium green dextran and 20 mM GDPβS (final concentration: 0.8–1.6 mM) (A, A′); or 40 mM GDPβS (final concentration: 1.6–3.2 mM) (B, B1′); and inseminated. Arrowheads indicate moments of frequent Ca2+ rise before the first-step Ca2+ increase, which involved formation of the cytoplasmic protrusion. (B2′) 0 and 47 s are magnified images of (B1′) 0 and 47 s (yellow squares) by contrasting pseudocolor, respectively.
GDPβS does not affect the exogenous IP3 induced Ca2+ increase
To ensure that IICR acts downstream of G-protein, a mixture of 100 μM caged-IP3 (final concentration: 4–8 μM) and GDPβS were co-injected into immature oocytes before inducing maturation. The oocytes injected with caged-IP3 but without GDPβS were used as a control. The UV irradiation-induced Ca2+ increase in these oocytes (7/7; Fig. 8 A) was virtually the same as in the control eggs that had been injected only with caged-IP3 without GDPβS (11/11; Fig. 8 B). Thus, GDPβS did not inhibit the Ca2+ increase when IP3 was supplied from an exogenous source. These result suggested that GDPβS does not affect the IICR itself, but its upstream events such as IP3 production by PLC.
Figure 8 Exogenous IP3-induced intracellular Ca2+ increase after GDPβS injection. Oocytes were co-injected with 100 μM caged IP3 (final concentration: 4–8 μM) and 40 mM GDPβS (final concentration: 1.6–3.2 mM) (A); or injected with 100 μM caged IP3 as control (B); and then maturation was induced. Caged IP3-loaded mature oocytes were uncaged by 3 s UV irradiation.
GTPγS injection induces the intracellular Ca2+ increase from the cortical region
The results that GDPβS inhibited the first-step Ca2+ increase during fertilization and the SE-induced Ca2+ release in the oocyte of P. occelata indicated that a G-protein-mediated pathway is involved in the process. Using a stable activator G-protein, GTPγS, we tested whether G-protein directly induced Ca2+ release in the oocyte. As expected, microinjection of 80 mM GTPγS (final concentration: 3.2–4.0 mM in the oocyte) at the peripheral region of the oocytes started to caused a Ca2+ increase around the tip of the needle immediately after injection (8/8; Fig. 9 A, A′ 0 s), which grew further within seconds. The CP was formed around the injected region within 10 s (6/8; Fig. 9 A′ 20 s arrowhead). The Ca2+ increase did not propagate well in the cortical region, and was terminated by 3–5 min. When 80 mM GTPγS was injected at central region of oocyte, a smaller Ca2+ increase compared with the injection at the peripheral region was detected in the whole cortex 24–36 s after injection (6/6; Fig. 9 B′). The CP was not formed (0/6). In contrast, a large Ca2+ increase was observed upon GTPγS injection at the peripheral region (Fig. 9 C, D). These results further supported the idea that the fertilized oocyte of P. occelata induces the initial Ca2+ signals through a G-protein-coupled receptor and the functional PLCβ near the plasma membrane.

Figure 9 Injection of GTPγS induces an intracellular Ca2+ increase. Oocytes were injected with 80 mM (final concentration: 3.2–4.0 mM) GTPγS in at time zero. GTPγS was injected at peripheral (A, A′); or central (B, B′); regions of the oocytes. The graphs represented the peak amplitude (C) and the time span between the time of GTPγS injection and the time of initiation of the Ca2+ increase from the cortex (D).
Characteristics of SE activity
To characterize the putative active factor in SE that induces the Ca2+ increase, we examined its heat stability, protease sensitivity, and molecular weight. The SE was boiled for 15 min and centrifuged. The supernatant was obtained as a ‘boiled SE’. The external application of boiled SE induced a Ca2+ increase, which was similar to the non-boiled control SE (10/10; Fig. 10). The amount of total protein after boiling dropped down to about 4.2% (from 330 to 14 μg proteins/ml), but the Ca2+ peak value of boiled SE, which was 1.35 ± 0.03 (F/F0) (n = 10) at applied site, was larger than that of the crude SE (see Table 1).
Figure 10 Resistance properties of sperm extract (SE) activity following heat treatment. SE was boiled for 15 min and then centrifuged. The supernatant from the boiled SE was applied externally to the oocyte in filtered seawater (FSW).
To elucidate whether the SE activity is derived from protein, we tested the protease sensitivity of SE. The boiled SE was incubated with 0.1% protease at 20°C for 3 or 6 h, and then boiled for 15 min to deactivate the protease activity. The Ca2+-increasing activity of the protease-treated SE was decreased after 3 h digestion, and was lost fully by 6 h (Fig. 11).
Figure 11 Inactivation of the sperm extract (SE) activity by protease. Boiled SE was incubated with 0.1% protease or deionized water (control) for 3 or 6 h at 20°C and then re-boiled for 15 min. Protease-treated SE or deionized water-treated SE was applied externally to the oocyte and the peak level of Ca2+ increase was compared.
These results suggested that SE contained the putative active factor to induce the first-step Ca2+ increase during fertilization, which was the heat-stable small peptide.
Discussion
When the first-step Ca2+ increase occurs during fertilization in P. occelata, a fertilizing sperm head still remains on the vitelline envelop, which is ~15 μm distance from the egg surface. The CP is formed after the first-step Ca2+ increase and fertilizing spermatozoon is incorporated into it (Nakano et al., Reference Nakano, Kyozuka and Deguchi2008). In another annelid species, Sabellaria vulgaris, the oocyte has a similarly wide perivitelline space and thus forms a large CP during fertilization (Novikoff, Reference Novikoff1939). In contrast, Chaetopterus oocyte has an inconspicuous perivitelline space, and its fertilizing sperm does not need to protrude the acrosome process to the egg surface. It is incorporated in a CP (Anderson & Eckberg, Reference Anderson and Eckberg1983). Therefore, the CP or fertilization cone is required for sperm incorporation, the size of which seems to correspond to the depth of the perivitelline space.
It remains unclear how sperm–oocyte interaction leads to the formation of the CP or fertilization cone. During fertilization in P. occelata, the sperm nucleus has been detected only after the retraction of the CP in a dye transfer experiment with Hoechst 33342-loaded oocytes. The first-step Ca2+ increase was inhibited by U73122 and the dye transfer was not observed in spite of the attachment of sperm on the vitelline envelope (Nakano et al., Reference Nakano, Kyozuka and Deguchi2008). When the oocyte was treated with excess K+ to induce the second-step Ca2+ increase immediately after the first-step Ca2+ increase took place, the formation of a fully grown CP was blocked, and no sperm was observed in the activated oocyte (Nakano et al., Reference Nakano, Kyozuka and Deguchi2008). In the present study, we have demonstrated that the external application of SE can induce a local Ca2+ increase that leads to the formation of the CP (Fig. 4 A′ arrow). As SE is a soluble fraction prepared from the sperm, our results indicated that gamete membrane fusion between the fertilizing sperm and oocyte is not necessary for the induction of the first-step Ca2+ increase and the following CP formation.
Induction of the Ca2+ increase in the P. occelata oocytes by the application of SE was observed not only in FSW but also in CaFSW, but was blocked in the FSW that contained U73122. The repressive effect of the PLC inhibitor U73122 was also observed in the case of the first-step Ca2+ increase during fertilization by sperm, in which the IICR is involved. As GDPβS blocked the first-step Ca2+ increases by both SE and sperm, G-protein is involved in this pathway. We have corroborated this by microinjecting the mature oocytes with GTPγS that induced Ca2+ increase as expected. The Ca2+ increase was larger when GTPγS was injected at the peripheral region than at the center of the oocyte. The increase in Ca2+ always started from the cortex after a certain time lag even when the GTPγS was injected in the central region of the oocyte. Thus, the functional receptors coupled with G-protein and its downstream effectors for inducing the Ca2+ increase must exist in the cortex of P. occelata. Chaetopterus oocyte has PLCβ, which is very similar to PLCβ4 in mammalian oocyte and PLCβ in sea urchin oocyte (Yin & Eckberg, Reference Yin and Eckberg2009), and it is thus likely that a similar G-protein-PLCβ pathway is at work in the cortex of the P. occelata oocyte. Recent studies have shown that U73122 and GDPβS have an effect on the kinetics of actin microfilaments and modulate the Ca2+ signaling in the oocyte (Kyozuka et al., Reference Kyozuka, Chun, Puppo, Gragnaniello, Garante and Santella2008, Reference Kyozuka, Chun, Puppo, Gragnaniello, Garante and Santella2009). The regulation of Ca2+ changes with actin microfilaments are closely related to the progression of oocyte maturation and sperm entry in starfish oocytes (Puppo et al., Reference Puppo, Chun, Gragnaniello, Garante and Santella2008). Actin microfilaments are rich in microvilli and in the cortex of annelid oocytes (Shimizu, Reference Shimizu1999). Further studies are necessary to clarify the involvement of the actin microfilaments in the regulation of the local Ca2+ increase and CP formation during sperm incorporation in the P. occelata oocyte.
Generally, signal transduction through the receptor-coupled PLC is mediated by G-protein-PLCβ and/or PTK-PLCγ pathways (Berridge, Reference Berridge1993). There are many reports that the PTK-PLCγ pathway participates during the activation of the oocyte by sperm (Runft et al., Reference Runft, Jaffe and Mehlmann2002). In Chaetopterus oocytes, PTK-activated PLCγ has a main role in signal transduction by sperm, but the involvement or localization of G-protein and PLCβ was unclear (Yin & Eckberg, Reference Yin and Eckberg2009). PTK inhibitors effected blockage or delay of the Ca2+ increase during fertilization in annelid Chaetopterus (Yin & Eckberg, Reference Yin and Eckberg2009), sea urchin (Shen et al., Reference Shen, Kinsey and Lee1999), ascidian (Ueki & Yokosawa, Reference Ueki and Yokosawa1997), and Xenopus (Sato et al., Reference Sato, Iwasaki, Tamaki, Aoto, Tokmakov and Fukami1998; Sato et al., Reference Sato, Tokmakov, Iwasaki and Fukami2000). From our results, PTK inhibitors, such as PP2, genistein, or herbimycin A, did not block the Ca2+ increase. In our previous work on the sensitivity of the P. occelata oocytes to IP3, the localized Ca2+ increase induced by injection of high concentration IP3 did not develop into a propagating Ca2+ wave (Nakano et al., Reference Nakano, Kyozuka and Deguchi2008). A similar Ca2+ response was observed in the fertilized oocytes of limpet, which showed a single Ca2+ increase that fully depended on a Ca2+ influx but not on the Ca2+ release by IICR (Deguchi, Reference Deguchi2007). The bivalve Mactra also showed a Ca2+ influx during fertilization. (Deguchi & Morisawa, Reference Deguchi and Morisawa2003). The neurotransmitter serotonin triggers Ca2+ release in these and bivalve Spisula oocytes (Colas & Dube, Reference Colas and Dube1998; Deguchi & Morisawa, Reference Deguchi and Morisawa2003). Serotonin mainly induces Ca2+ release in the cell through serotonin receptors coupled with G-protein (Noda et al., Reference Noda, Higashida, Aoki and Wada2004). In Xenopus oocytes, expression of the exogenous serotonin receptor induces IP3-mediated Ca2+ increase though G-protein (Kline et al., Reference Kline, Simoncini, Mandel, Maue, Kado and Jaffe1988). In all these cases, lack of development of Ca2+ wave propagation despite the IICR may be related to the intrinsic nature of the Ca2+ release mediated by the G-protein-activated PLCβ in the oocytes.
There is no information about the localization of the sperm receptors for activation on the egg surface. Studies on the ultrastructure of annelids Chaetopterus (Anderson & Eckberg, Reference Anderson and Eckberg1983), Tylorrhynchus (Sato & Osanai, Reference Sato and Osanai1983) and Neanthes (Sato & Osanai, Reference Sato and Osanai1986) oocytes have shown that microvilli extend from the cortex to the outer surface beyond the vitelline envelope, acrosome reacted-sperm fuses with the tips of microvillus where the vesicles are seated (Sato & Osanai, Reference Sato and Osanai1983; Anderson & Eckberg, Reference Anderson and Eckberg1983; Sato & Osanai, Reference Sato and Osanai1986). These morphological studies suggested that the tips of the microvillus vesicle might be a site of sperm reception. In the unfertilized P. occelata oocyte, the perivitelline space is bridged by numerous microvilli, which diminish in the fertilized oocyte significantly within 10 min (Nakano et al., Reference Nakano, Kyozuka and Deguchi2008). The microvilli may contain the receptors for the first-step Ca2+increase during fertilization. In Neanthes oocytes, the tips of microvilli exposed on the vitelline envelope are about 2% of total surface area (Sato & Osanai, Reference Sato and Osanai1986). The present study showed that the SE-induced Ca2+ increase was similar to the first-step Ca2+ increase in the eggs fertilized by sperm. The SE was prepared by extraction from 4.1 × 10¹¹ sperm/ml, and the volume of applied SE was 10 μl, which was equivalent to 4.1 × 10⁹ sperm. However, it is reasonable to assume that the SE is received only at the tips of microvilli. Therefore, in vivo, a small amount of SE might be sufficient to induce the first-step Ca2+ increase as one sperm may act on a single microvillus tip, and the effective concentration of SE in the microdomain is sufficient.
External application of protease permits egg activation in starfish (Carroll & Jaffe, Reference Carroll and Jaffe1995) and Xenopus (Mizote et al., Reference Mizote, Okamoto and Iwao1999), and existence of protease inhibitor disturbs Xenopus fertilization. However, it is unlikely that the first-step Ca2+ increase during fertilization of P. occelata involves protease activity as the first- and second-step Ca2+ increase and SE-induced Ca2+ increase were not affected by the existence of protease inhibitors, such as soybean trypsin and phenylmethylsulfonyl fluoride (data not shown). Meiotic maturation in starfish is reinitiated by a maturation-inducing hormone, 1-methyladenine. Its putative receptor is coupled with a heterotrimeric G-protein (Kishimoto, Reference Kishimoto1998). 1-Methyladenine also induced Ca2+ release by starfish immature oocytes (Santella et al., Reference Santella, Ercolano, Lim, Nusco and Moccia2003), although any connections between Ca2+ release and G-protein are still unknown. Our findings in the present study of a putative active factor to induce the first-step Ca2+ increase during fertilization was of a heat-stable peptide. A preliminary study to estimate the molecular size using a molecular sieve membrane with several cutoff sizes indicated that the active factor was smaller than 3 kDa (data not shown). The major factor in SE may act functionally like a hormone.
During fertilization, the second-step Ca2+ increase by Ca2+ influx follows the first-step Ca2+ increase. Our previous reports have indicated that the second-step Ca2+ increase is a necessary and sufficient stimulus for the extrusion of the polar body, resulting in egg activation. In this study, SE induced the first-step Ca2+ increase and CP formation; however, SE did not induce the second-step Ca2+ increase even in the presence of external Ca2+. Accordingly, this activity differed functionally from the factor previously known as an egg activating sperm factor. It is, however, conceivable that the present factor has an essential role to play in P. occelata fertilization as it contributes to sperm entry by forming the CP. It is possible that this function is not seen in other animals as they do not have the wide perivitelline space such as that found in P. occelata and S. vulgaris. Alternatively, it may be characterized as part of the egg activation process.
Our previous study found that the second-step Ca2+ increase was caused by Ca2+ influx though voltage-gated Ca2+ channels. Subsequently, microvilli in the perivitelline space disappeared and additional CPs could not be formed for sperm incorporation. For the success of monospermic fertilization, the spermatozoon enters the egg at a preferential site or area in most animals (Dale & DeFelice, Reference Dale and DeFelice2011; Dale, Reference Dale2014). The binding of spermatozoon at the tip of microvillus on the vitelline envelope and the development of the CP beneath it must both contribute to monospermic fertilization in P. occelata. For the second-step Ca2+ increase in P. occelata oocytes, another active sperm factor is needed. The second-step Ca2+ increase occurred around the time that the fertilizing spermatozoon was engulfed by CP. These results indicated that the putative sperm factor works when the sperm contact or fusion with the CP.
These results in this study are summarized schematically in Fig. 12. When the sperm bind to the vitelline envelope, a sperm–oocyte interaction that is mediated by an external sperm factor and an oocyte receptor, which is located at the microvillus tip, leads to activation of receptor-coupled G-proteins. Thereafter, directly or indirectly activated PLCβ produces IP3 and causes IICR. The local Ca2+ increase in cortex, which is the first-step Ca2+ increase, introduces the formation of CP for sperm incorporation. The second-step Ca2+ increase, leading to the activation of the oocyte, is triggered due to contact/fusion of sperm with the CP surface membrane.
Figure 12 A model for the first-step Ca2+ increase during fertilization. External sperm factor is discharged from a spermatozoon on the vitelline envelope (VE). The sperm factor interacts with a receptor and mediates the activation of a G-protein/PLCβ pathway. Then, the IP3-dependent Ca2+ increase induces the formation of the cytoplasmic protrusion for the incorporation of the spermatozoon into the oocyte. CP, cytoplasmic protrusion; GDP, guanosine diphosphate; GTP, guanosine triphosphate; MV, microvillus; PLC, phospholipase C.
ACKNOWLEDGEMENTS
The authors would like to express our thanks to Dr Jong Tai Chun (Stazione Zoologica, Naples) for the careful reading and helpful comments on the manuscript. We are also grateful to Dr Ritsu Kuraishi (Keio University, Tokyo) for useful discussion about the microinjection techniques.
FINANCIAL SUPPORT
This work was financially supported in part by a Sasakawa Scientific Research Grant from the Japan Science Society to T.N. (no. 18–350).