


The hemi-Fontan procedure is part of the staged palliation strategy to treat functionally univentricular hearts,Reference Castaneda1 which involves redirecting the caval venous flow to the pulmonary arteries. The passive non-pulsatile flow at increased central venous pressure might result in further development of venous–venous collaterals and, importantly, the systemic-to-pulmonary arterial collaterals. This is associated with increased morbidity and needs to be addressed during follow-up.Reference Castaneda1 Cardiac magnetic resonance is considered to be a highly versatile and valuable tool to study cardiovascular morphology and to quantify pulmonary perfusion by two-dimensional phase contrast flow.Reference Beerbaum, Korperich, Barth, Esdorn, Gieseke and Meyer2 We present a four-dimensional flow technique for novel haemodynamic assessment in a patient with previous hemi-Fontan surgery and discuss the four-dimensional flow benefits over the current two-dimensional flow.
Case report
We present the case of a two-and-a-half-year-old boy (14 kilograms) with antenatal diagnosis of mitral atresia and hypoplastic left cardiac syndrome. He had two sequential palliative surgeries, Norwood stage-I, at the age of 2 weeks and hemi-Fontan procedure at the age of 6 months. The saturations of oxygen oscillated around 75–80%.
A routine cardiac magnetic resonance study to plan the next stage surgery for Fontan completion was performed under general anaesthesia on a 1.5 T Intera MR scanner (Philips Medical Systems, Best, the Netherlands). The anatomic study demonstrated two novel findings: a systemic-to-pulmonary artery collateral and a venous–venous collateral (Fig 1a and supplemental video 1). Lung perfusion was estimated using conventional two-dimensional phase contrast flow (two-dimensional flow) and the newly proposed four-dimensional phase contrast flow sequence (four-dimensional flow).
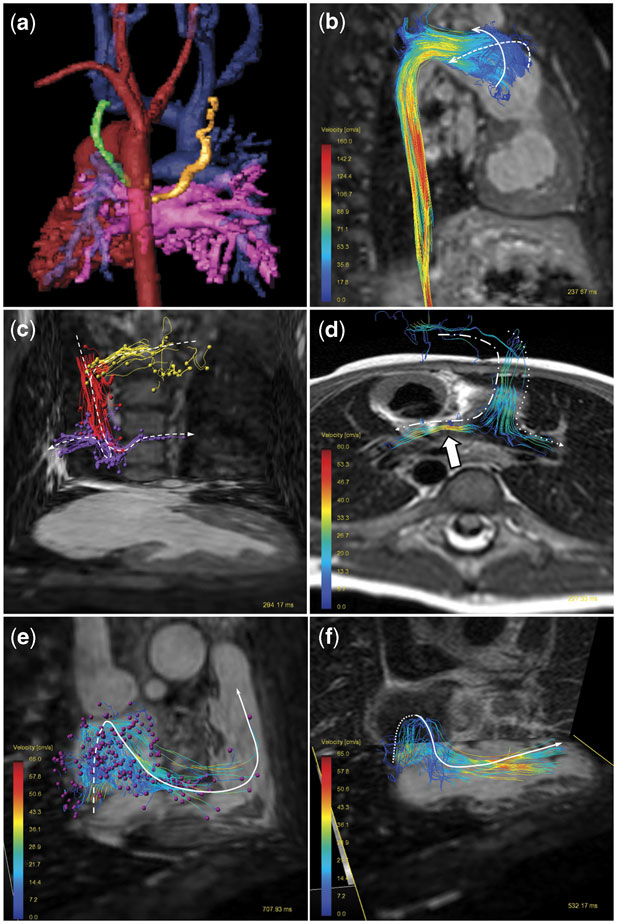
Figure 1 (a) Three-dimensional shaded contrast-enhanced reconstruction, posterior view. Common ventricle and aorta (red), pulmonary veins and left atrium (pink) and hemi-Fontan structures (blue). There is a systemic-to-pulmonary artery collateral originated from the descending aorta to the left upper pulmonary lobe (gold). The venous–venous collateral connecting the left jugular vein to the left atrium is shown in green. (b) Particle tracing visualisation in the aorta, right lateral view. There is an overstated helical flow in the neo-aortic root. (c) Particle tracing (arrowhead) in the hemi-Fontan circuit, anterior view. Particles are released in the left jugular vein (yellow), right jugular vein (red), and in the superior caval vein to pulmonary arteries connection (violet). (d) Streamlines in the hemi-Fontan connection, posterior view. Note the flow acceleration (arrow) in the narrow left pulmonary artery. (e) Particles trace (arrowhead) released in the inferior caval vein, anterior view. The particles pathway from the dilated right atrium to the ventricle outflow tract is shown. (f) Streamlines anterior view. The velocity vector field originated in the inferior caval vein impacts against the posterior atrium wall. The vortex follows a superior and anterior diversion to cross the tricuspid valve up to the common ventricle.
Two-dimensional flow
There were six separate free-breathing two-dimensional flow sequences (repetition time = 4.4 milliseconds, echo time = 2.4 milliseconds, maximal velocity encoded = 60–250 centimetres per second, temporal resolution 17 milliseconds, spatial resolution 2.5 × 2.5 × 8 millimetres) that were performed for the hemi-Fontan flow evaluation (Table 1). The two-dimensional flow was quantitatively analysed on an Extended MR Workspace® version 2.5.3.1 (Philips Medical System), Table 1.
Table 1 Two-dimensional and four-dimensional Phase contrast: quantitative flow and time analysis.
PA = pulmonary arterial; SVC = superior caval vein; RPA = right pulmonary artery; LPA = left pulmonary artery; PV = pulmonary venous; RPV = right pulmonary vein; LPV = left pulmonary vein; AO = ascending aorta; SV = systemic venous; IVC = inferior caval vein.
Two-dimensional and four-dimensional phase-contrast quantitative comparison analysis for pulmonary and systemic flow, depicted in arterial perfusion and venous return.
*Systemic-to-pulmonary artery collaterals (SPC) are calculated as the difference between the pulmonary venous return and the pulmonary arterial perfusion flow.
**Pulmonary perfusion (Qp) to systemic perfusion (Qs) ratio is calculated by dividing the pulmonary venous flow by the systemic venous return, or alternatively as the difference between the aortic flow minus the systemic-to-pulmonary collateral flow.
***Total time is calculated by the sum of the planning and the scan time. The interactive time to setup all the planes perpendicular to the vessels of interest in two-dimensional phase-contrast flow was 6:02 minutes, plus six scans of 2:40 minutes each one. The time required to plan the single four-dimensional phase-contrast sequence was 3:12 minutes, plus a single scan of 10:11 minutes.
Four-dimensional flow
The newly proposed four-dimensional flow evaluation is a free-breathing phase contrast flow sequence (repetition time = 4.8 milliseconds, echo time = 2.7 milliseconds, maximal velocity encoded in the three spatial coordinates = 250 centimetres per second, temporal resolution 24–30 milliseconds, spatial resolution 2.5 × 2.5 × 2.5 millimetres). No respiratory motion correction was deemed necessary under conditions of general anaesthesia. The data were analysed with a commercial four-dimensional flow post-processing software package GTFlow, release 1.4.6 (GyroTools, Zurich, Switzerland).
Four-dimensional flow quantification
Free offline plane reformatting permits accurate through-plane flow quantification in any vessels of interest within the scanned volume, as shown in Table 1.
Four-dimensional flow particle tracing
Particle traces are pathlines that an imaginary particle, such as erythrocytes, would follow over time.Reference Wigstrom, Ebbers and Fyrenius3 Selecting a plane of interest (Fig 1b: neo-aorta, (c) right and left jugular veins and hemi-Fontan connection, (e) inferior caval vein), imaginary particles are released in the chosen cardiac phase and followed through the cardiac cycle according to the measured velocity field distribution information. They allow a comprehensive understanding of flow pathways over the cardiac cycle (see supplemental videos 2–4).
Four-dimensional flow streamlines
Streamlines are imaginary lines that align with the local velocity field in a specific phase within the cardiac cycle.Reference Napel, Lee, Frayne and Rutt4 They provide a three-dimensional perspective of the direction of the flow velocity vector field, as shown in Fig 1d and f. Despite being a static representation in a chosen time, they provide quick visual information about flow vortices and disruption of laminar flow.Reference Hope, Meadows and Hope5
Discussion
Facing the problem of timing of surgery planning in patients with palliative staged univentricular surgery, many investigators have pointed out the importance of accurate pulmonary flow quantification.Reference Grosse-Wortmann, Al-Otay and Yoo6 Pulmonary perfusion can be adequately quantified by two-dimensional flow as previous studies have shown.Reference Whitehead, Gillespie, Harris, Fogel and Rome7 In our case, we also performed four-dimensional flow for comparison purposes. We not only found excellent agreement with the current two-dimensional flow method, according to recently published studies,Reference Nordmeyer, Riesenkampff, Crelier, Khasheei and Kuehne8 but also additional advantages as discussed below.
Time efficiency
To assess the hemi-Fontan circulation, in terms of arterial and venous systemic and pulmonary flow, two-dimensional flow requires numerous and difficult-to-plan vessels investigations, resulting in a prolonged scan-time. In our case, we performed six free-breathing two-dimensional flow, which resulted in 22 minutes (or around 13 minutes, if it would have been performed in breath-hold). We did not use two-dimensional flow scans with SENSE during the free-breathing acquisition, as its accuracy has not been systematically assessed in small children during anaesthesia. Hence, in current clinical practice, flow quantification is often limited to the systemic (aortic flow) and pulmonary flow (right and left pulmonary arteries), which does not reflect the true pulmonary perfusion as we explained before. In contrast, four-dimensional flow requires an easy-to-plan three-dimensional volume containing any vessels of interest within the mediastinum and had a total scan time of 13 minutes (Table 1).
Retrospective analysis
With two-dimensional flow, if unexpected vascular anomalies are not identified at the time of the scan, then retrospective reanalysis to interrogate flow within those vessels is not possible. Here, this was the case with the venous–venous collateral to the left atrium (Fig 1). In contrast, a four-dimensional flow scan contains all the structures of interest within the scanned volume. Any new vessel plane can be analysed easily offline, which includes retrospective reanalysis of the volume.Reference Sorensen, Beerbaum, Korperich and Pedersen9
Quantification of pulmonary flow perfusion and collateral blood flow
As shown in Table 1, the systemic-to-pulmonary artery collateral, as well as the pulmonary perfusion (Qp) to systemic perfusion (Qs) ratio (Qp:Qs), can be accurately quantified.
However, in our particular case, the two-dimensional flow quantification did not agree exactly with four-dimensional. This might be because of the inherent limitations of two-dimensional flow detailed before: the two-dimensional plane investigation in the left pulmonary veins was placed too close to the left atrium and also quantified the venous–venous collateral flow (Fig 1a). This was easily addressed in four-dimensional flow by interrogating the left pulmonary veins before the collateral connection. Differences found between two-dimensional and four-dimensional flow might be also due to different heart rates and no respiratory compensation among others.Reference Uribe, Beerbaum, Sorensen, Rasmusson, Razavi and Schaeffter10
Four-dimensional flow visualisation
In terms of flow visualisation, four-dimensional flow allows one to obtain insight into flow stream quality. This might allow a better understanding on the low-flow dynamics and the loss of energy efficiency in the hemi-Fontan circuit and may be helpful to identify in a visual manner the accelerated flow in a slender vessel (Fig 1d) or the unbalanced flow distribution to the pulmonary arteries. Potential applications might include planning the next staged palliation surgery and addressing the previous issues, for example, redirecting the inferior caval vein preferentially to the left pulmonary artery or widening the stenotic vessel. In future studies, evaluation of disturbed vortical blood flow patterns might help early identification of failing hemi-Fontan circulation.
In conclusion, this report intends to suggest a new way of looking at and analysing the flow dynamics in patients with hemi-Fontan surgery. We have shown the advantages of four-dimensional flow over the current two-dimensional flow in terms of time efficiency; possibility of reanalysing without rescanning in case of unexpected findings during post-processing; accurate quantification of pulmonary flow perfusion and collateral blood flow; and, on top of this, novel insights from particle tracing visualisation.


