

A fundamental question in International Relations (IR) research is whether ratifying or joining an international institution affects the policies of sovereign nation states. Research in this vein encompasses critical questions such as whether human rights treaties improve human rights, whether free trade agreements increase trade and whether alliances change conflict behavior. Generally, scholars ask whether member states change their policies to comply with an institution’s rules.
Assessing the relationship between ratification and compliance is difficult because the same factors that drive compliance also drive a country’s initial decision to join an institution. Often these factors are unobservable, meaning that they are either not easily measured or not known to the researcher. This problem, which is called ‘selection on unobservables’, most likely biases empirical findings regarding the effects of institutions in a positive direction, because countries that are most likely to comply ex ante are also the most likely to ratify.Footnote 1 Even if ratification has no effect on compliance, selection on unobservables can result in ‘false positives’, where estimates incorrectly suggest a positive effect of ratification on compliance. When we observe a positive relationship between ratification and compliance, we are left wondering whether this finding reflects a true relationship, or if it is only an artifact of selection on unobservables.
Researchers outside of IR face similar challenges. In comparative politics, researchers ask whether political and financial institutions, like democracy or central bank independence, affect outcomes like growth and inflation. It is possible that unobservables, for example a country’s overall stability or inflation aversion, affect both domestic institutions and outcomes. In American politics, researchers ask whether electoral rules affect turnout or whether higher court rulings affect lower court compliance. It is possible that unobservables – such as civic engagement or the strength of a legal argument – affect rules and rulings, as well as turnout and compliance. These are analogous hurdles to those faced by researchers assessing the effects of international institutions.
This article seeks to make two contributions. The first is a serious assessment of the severity of the problem of selection on unobservables. Extant research, in IR and beyond, uses a veritable smorgasbord of empirical models designed to address this problem. We ask: do these fixes work? In other words, when we employ these empirical estimation approaches, can we be confident that a positive finding demonstrates a relationship between membership and compliance, as opposed to a false positive?
We present evidence from a novel, extensive replication exercise that the answer is no. Specifically, we start with a set of existing studies that analyze dependent variables that are not closely linked theoretically to international trade, for example a country’s torture rate or whether it has a legislature. Using identical models to the authors’ original specifications, we add a variable coding the country’s membership in the World Trade Organization (WTO) to assess whether WTO membership had a statistically significant effect on those dependent variables, despite there being virtually no theoretical relationship between WTO membership and those dependent variables.
We find a disconcertingly high rate of significant results. The WTO has a statistically significant relationship approximately 34 per cent of the time, which is over three times as high as the rate implied by conventional levels of statistical inference. The results are also of substantive significance: General Agreement on Tariffs and Trade (GATT)/WTO membership has a meaningful effect on these dependent variables. We also show how the most commonly used estimation approaches do not reduce these false positive rates; in some instances they make the problem worse by creating new false positives where there were none before.
To be sure, it is impossible to know whether a particular result represents a false positive or a true relationship. To address this challenge, we make our replication exercise even more conservative. We show how our results withstand using a treaty that has an even more tenuous theoretical link with the dependent variables we consider – the Convention on Trade in Endangered Species (CITES). It is very unlikely that CITES, which institutes licensing requirements for a small number of endangered plants and animals, has any relationship with the dependent variables in our replication exercise, none of which describes environmental outcomes. Yet we again find high false positive rates. This gives convincing evidence that our findings are not merely the result of true relationships that researchers do not yet understand.
In addition to demonstrating a very high false positive rate, the replication exercises also demonstrate a subtler pattern. Unobservables can take many different forms. Some are country specific and time invariant. Others are time varying, but common across countries. Still others are country specific and time varying. Each type is theoretically plausible and supported by arguments in the existing literature. Yet each also has different implications for the conditions under which existing fixes are susceptible to generating false positives. Addressing only one type of unobservables can often make the problem of false positives worse. This phenomenon is a type of ‘law of second best’, in which addressing one type of unobservables can be worse than addressing none.
The article’s second contribution is to advocate for theoretically informed sensitivity testing. Sensitivity analysis is a powerful tool for assessing the likelihood that a positive result is a false positive. However, the leverage of a particular sensitivity test depends on the theoretical knowledge against which it is benchmarked, not just the mechanics of the approach. We demonstrate this using a sensitivity approach based on Altonji, Elder and Taber.Footnote 2 This approach asks ‘How severe would selection on unobservables need to be, relative to selection on observables, to account for the estimated effect of ratification on compliance?’
Our contribution to this approach is to show how prior theoretical knowledge is crucial when choosing which covariates to include in the sensitivity test, which in turn has significant effects on the test’s ability to screen for false positives and retain true positives. For applied research, the choice of covariates for a sensitivity test is just as important as the mechanics of a particular approach. We use examples from our replication exercise to demonstrate how the approach can succeed or fail, depending on the strength of this theoretical knowledge regarding the covariates selected for the sensitivity test. These examples also give practical advice for applied researchers on how to use the approach and assess its strength. In addition, we provide an original Stata command for the general implementation of these approaches, which we will make publicly available. Our goal is to make this type of testing more widespread and accessible, while still retaining a transparent, concrete emphasis on the theoretical knowledge underlying the results.
Lastly, we have described our arguments in terms of false positives, because we have theoretical expectations that selection on unobservables biases estimates in a positive direction in the context of international institutions and compliance. But our arguments apply generally to the bias in estimated effects that results from selection on unobservables, which may be positive or negative in other contexts. The characterization of the selection on unobservables problem, the sensitivity tests described, and the advice given here should be useful to scholars across subfields and applications.
THE PROBLEM OF FALSE POSITIVES
A large body of IR research theorizes about whether and how international institutions cause sovereign nations to change their behavior. To test these theories empirically, researchers model the relationship between an explanatory variable that describes a country’s status vis-à-vis a particular institution and a dependent variable that describes some aspect of the country’s behavior or policies. Most often, the explanatory variable measures whether a country has ratified or joined a particular treaty or organization. The dependent variable often describes whether a country has adopted policies that are consistent with that institution’s rules, often called compliance.
Examples abound in all areas of IR research. In international political economy, researchers ask whether the institutions governing international trade and finance affect government policies or economic outcomes. For example, Simmons,Footnote 3 Simmons and Hopkins,Footnote 4 and Von SteinFootnote 5 debated whether accepting the International Monetary Fund’s Article VIII commitments decreases a government’s probability of implementing current account restrictions. A large body of work asks whether bilateral investment treaties affect investment. In human rights, much research explores whether membership in the Convention Against Torture and other legal instruments of international law affects a country’s human rights policies. In conflict and security studies, many studies examine whether alliance membership affects a country’s conflict behavior. There are many examples of similar phenomena outside of IR, where unobservables make selection into a particular treatment or regime non-random, which potentially biases the resulting estimates of the effect of treatment on outcome.
The empirical tests employed by researchers generally resemble the system described in Equation 1. r
it
is a binary variable that equals 1 if country i has ratified a particular treaty in or before year t. c
it
is a binary variable that equals 1 if country i’s policies are compliant with the treaty’s rules in year t. For simplicity, we will speak of countries as having ratified or not ratified a treaty, and their policies as either being in compliance with that treaty’s rules or not.Footnote
6
The vector X
it
contains the observable characteristics of a country that potentially affect compliance and ratification.
 $$u_{{it}}^{r} $$
and
$$u_{{it}}^{r} $$
and
 $u_{{it}}^{c} $
are unobservables that affect ratification and compliance, respectively.Footnote
7
$u_{{it}}^{c} $
are unobservables that affect ratification and compliance, respectively.Footnote
7
 $$\matrix{ {r_{{it}} \,{\equals}\,f\left( {X_{{it}} B{\plus}u_{{it}}^{r} } \right)\quad \left( {Ratification\,Equation} \right)} \cr {c_{{it}} \,{\equals}\,f\left( {X_{{it}} \beta {\plus}\alpha r_{{it}} {\plus}u_{{it}}^{c} } \right)\quad (Compliance\,Equation)} \cr } $$
Researchers are generally interested in estimating α, the effect of ratification on compliance. In estimating α, researchers face a familiar problem: the unobservables that affect ratification are correlated with the unobservables that affect compliance, which biases estimates of α. In the context of treaty ratification and compliance, we usually think this correlation is positive, which biases estimates upwards. As a consequence, even when we find positive estimates of α, as are often predicted by theory, we should be suspicious about whether these are ‘true positive’ findings or if they are ‘false positives’, estimates that are artifacts resulting from correlation among unobservables.Footnote 8 While it is theoretically possible to look for sources of exogenous variation in treaty membership, for example by using an instrumental variables or natural experiment approach, such sources are highly unlikely to exist given that largely the same actors make both the ratification and compliance decisions.
POSSIBLE FALSE POSITIVES
How likely are existing estimation approaches to generate false positive estimates of α, the effect of the institution on compliance? We find that false positives are very likely to be a problem. To support this claim, we use existing estimation approaches and see whether a particular treaty has significant effects on country-level characteristics, despite there being little or no theoretical relationship between that treaty and those characteristics. The explanatory variable we use measures whether a country is a member of the GATT/WTO. The country-level characteristics (dependent variables) that we analyze are quantities that are unlikely to be influenced by the multilateral trade regime, for example instances of torture, whether a country has a legislature, or literacy rates.Footnote 9
In the parlance of medical trials, this is like a placebo test. We take a set of patients, each of whom has a different disease (high torture, low literacy). We give each of them a placebo drug (WTO membership), and then assess whether existing approaches would tell us that the placebo drug has an effect on the disease. By design, where we find statistically significant effects, we should be suspicious that they are false positives as opposed to true relationships between treatment and outcome. In a later part of this section, we analyze CITES instead of the GATT/WTO regime. We do this as an even more conservative placebo test, since the theoretical link between CITES and the dependent variables analyzed here is virtually non-existent. The studies we replicate were generally not related to treaty ratification, so if we find high false positive rates in our replications, we should be concerned that false positive rates may be even higher in studies of ratification, where the selection on unobservables problem is potentially more severe.
To be precise about language, from here forwards, ‘false positive’ refers to a statistically significant relationship between the WTO/CITES and the outcome variable, not the sign of the coefficient. While our theoretical knowledge makes us suspect that the direction of bias resulting from selection on unobservables is positive in many situations, we focus here on the likelihood of finding any statistically significant relationship between WTO/CITES and outcomes, regardless of its direction.
It is also important to note that we find many examples of substantively meaningful effects among these placebo tests. We discuss several of these examples in the sensitivity section. Other examples of substantively important findings include: GATT/WTO membership increases the probability a country has a legislature by 6 per cent, decreases the presence of governmental torture by 4.3 per cent and increases life expectancy by approximately 2 per cent, among others. CITES membership also had substantively important estimated effects, such as decreasing infant mortality rates by 8.1 per cent and decreasing the probability of political instability by 43 per cent, among others. We focus on statistical significance to compare across replications, but our estimates also indicate suspiciously strong substantive relationships between membership in GATT/WTO/CITES and theoretically distant dependent variables.
POPULATION OF STUDIES
We began by gathering the population of studies published in the American Political Science Review, American Journal of Political Science and International Organization from 2005–13 that used a country-year unit of observation.Footnote 10 For each study, we identified the dependent variable, the set of explanatory variables and the estimation procedure used to produce the published results. To standardize notation as we discuss these studies, let y it denote the dependent variable of the study and let X it denote the collection of explanatory variables. We then excluded studies that analyzed a dependent variable with a strong or potentially strong theoretical link between WTO membership and that dependent variable.Footnote 11 Our explanatory variable, WTO it , is a dummy variable that equals 1 if the country was a member of the GATT/WTO during that year, and 0 otherwise.
In all, we analyzed sixteen studies. For each study, we gathered the authors’ replication data and replicated their analyses. Since there were multiple regressions/estimations in all the studies, this yielded a total of ninety-four replications. The studies varied in how they justified their empirical approaches; some were explicit about the assumptions underlying their chosen model, and others less so. The studies also varied in the degree to which they argued that their approach was likely to be susceptible to the issue of selection on unobservables.
BASELINE REPLICATIONS
For the baseline set of replications, we used authors’ exact original specifications. The only change we made was to add the WTO it variable as an additional explanatory.
For each replication, we gathered the p-value associated with the coefficient on the WTO variable.Footnote 12 Figure 1 orders these p-values along the horizontal axis from least to greatest. The vertical axis shows the p-value for that particular replication. The horizontal line marks the 0.10 level. The vertical line marks the thirty-second replication, which is the replication with the greatest p-value that still falls below the 0.10 threshold.
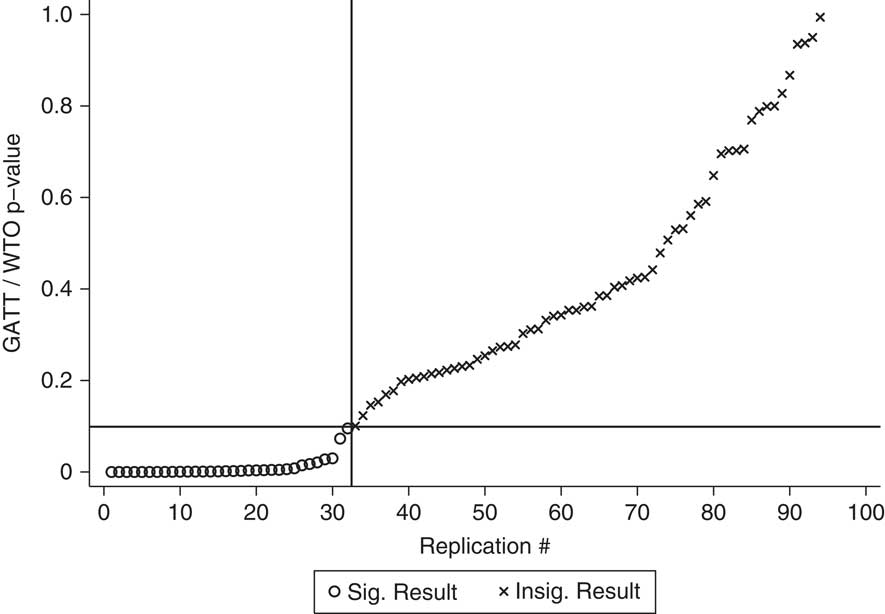
Fig. 1 P-values for effect of WTO on irrelevant DVs
The two lines divide the figure into four quadrants. X’s in the top right correspond to ‘true negatives’. These are studies in which we would not expect to find any statistically significant effect for the WTO, and indeed do not. O’s in the bottom left correspond to ‘false positives’, studies in which the WTO has a statistically significant effect on the dependent variable.
The most important feature of the figure is that the overall false positive rate is much higher than we would expect. Thirty-one replications have p-values less than 0.10, a false positive rate of approximately 34 per cent. If using the conventional 0.10 critical level, we would expect to observe, by chance, approximately nine to ten significant results. We found over three times that number. The false positive results are also far from ‘barely significant’. Thirty of the replications have p-values less than 0.05, while twenty-five have p-values less than 0.01.
The false positives are also not concentrated in just a few studies or estimation approaches. Of the sixteen studies we replicated, almost half (seven) had at least one replication in which the WTO variable was statistically significant. Of the thirty-four different dependent variables analyzed in the sixteen studies, the WTO variable was statistically significant in at least one replication for sixteen of the dependent variables. Some dependent variables were continuous, while others were limited dependent variables. Of the thirty-three continuous dependent variable replications, the WTO variable was significant in seventeen of them. Of the sixty-one limited dependent variable models, the WTO variable was significant in fifteen of them. The false positives are also not strongly correlated with the subject matter of the replication study or the number of countries or years in its sample.Footnote 13
REPLICATIONS WITH EXISTING FIXES
Extant work uses a variety of approaches to address selection on unobservables. Some are based on panel data techniques used for unobserved heterogeneity and trending, like unit or year fixed effects, time trends or splines. For example, researchers often argue in favor of using unit fixed effects to control for unobservables.Footnote 14 Others have advocated matching techniques, based on the intuition that matching facilitates the comparison of treated and control units that have similar observable characteristics.
For the second set of replications, we incorporated each of these different approaches. Some of the studies we replicated used these approaches in their published specifications, while others did not. Country fixed effects were the most commonly applied strategy for dealing with unobserved country-specific variation, used in twenty-six of the ninety-four replications. Seventy-two of ninety-four used some sort of time-based fix, like splines, year trends or year fixed effects. Twenty of the ninety-four used some combination of country fixed effects and time trends.
To assess the effect of these approaches on false positive rates, we began by stripping them of all the replication specifications. We call these the ‘reduced’ replications. They are identical to the authors’ original specifications in every way except (a) we added the WTO it variable and (b) we did not include any fixed effects, splines, etc.
We then applied each of these fixes one by one (and in combinations) to all replications and assessed how the false positive rate changes as we applied certain types of fixes. Table 1 describes the number of false positives across these specifications. Column 1 provides the baseline results described above for comparison. Column 2 describes the reduced replication results. Column 3 adds country fixed effects to every replication (if they were not already included) and removes any other fixes. Column 4 adds a country-specific linear time trend to any model that did not already include some fix for time trends or period-specific shocks. If the original model included a fix (time trend, year fixed effects or splines), we left it in as specified by the author. For this column, we also removed any country fixed effects.
Table 1 False Positive Rates for Replications, GATT/WTO Variable
The final column of Table 1 describes the false positive rates from replications using a standard matching technique.Footnote 15 Matching techniques, in which the sample is pre-processed or pruned, are often used. In applied research, a very common justification for using this technique is to address non-random selection or endogeneity.Footnote 16 We use one of the most common matching techniques, propensity score matching.Footnote 17 Briefly, propensity score matching uses a set of observables to estimate the probability of a unit receiving treatment (GATT/WTO membership). Treated and untreated observations with similar propensity scores are matched together, and then the dependent variable is compared across the matched, treated and untreated observations to obtain an estimate of the effect of GATT/WTO membership.
Here, we used each of the covariates in the study to construct a propensity score, matched on that propensity score, and then calculated the average treatment effect of the treated observations. In choosing which variables to include in the propensity score matching procedure, we followed the advice of Ho et al.: ‘All variables in X i that would have been included in a parametric model without preprocessing should be included in the matching procedure.’Footnote 18 Each treated observation is matched with one other observation. The average treatment effect on the treated is a weighted comparison of the mean of the dependent variable across treated and control units. When there are more treated units, control units that are matched with more treated units receive higher weights than those that are not matched with many treated units. If there are more control units, again each treatment unit will receive a match, but control units might be matched more than once and some might not be matched.Footnote 19
To be sure, there is much methodological debate and innovation over what variables to match on, how to match observations (propensity score, distance metrics, coarsening, etc.) and how to assess balance on observables after matching. Since our goal is not to weigh in on these debates, we would note that matching procedures are valuable techniques for achieving and assessing balance on observables. Yet even when achieving balance on observables in the matched sample, it is still possible for inferences to be biased because of imbalance on unobservables.Footnote 20 For example, in simulations presented in the Appendix, we can achieve very good balance on observables using a variety of matching procedures, and our estimated ratification effects will still be biased as a result of selection on unobservables. For this reason, we focus on a standard, commonly used approach, rather than on variation in false positive rates across matching procedures.
There are two important results from Table 1. First, the high rate of false positives is surprisingly persistent, rising from 34 to 44 per cent when we remove the authors’ fixes. However, adding country fixed effects or country trends/splines only reduces the rates to 29 and 34 per cent, respectively. The matching approach fares similarly, with a false positive rate of 31 per cent.
The second result from Table 1 fixes some problems, but also creates new ones. Using particular fixes removes many of the false positives in the baseline replications. Some replications that previously generated significant results now generate insignificant results. However, the fixes create new false positives where there were none before.
Figure 2 shows the p-values for the country fixed effects replications. For this figure, we kept the ordering of the studies the same as in Figure 1 and retained the same vertical and horizontal lines. For Figure 2, X’s still denote insignificant p-values, greater than 0.10, and O’s still denote significant p-values, less than 0.10.
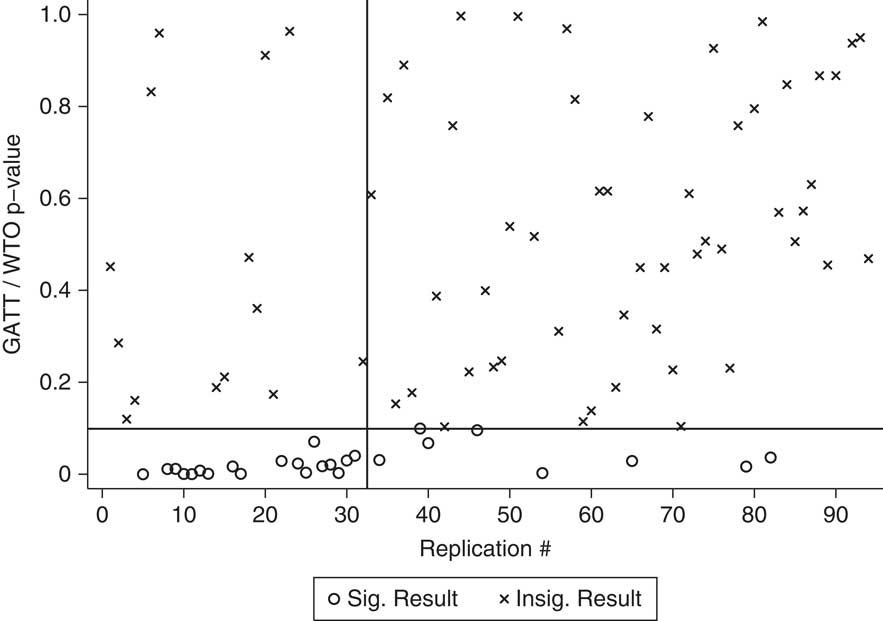
Fig. 2 P-values for effect of GATT/WTO on irrelevant DVs, fixed effects
Figure 2 shows how country fixed effects ameliorate the false positives problem in some ways and exacerbate it in others. There are fourteen X’s in the upper left quadrant of the figure, which denote the fourteen replications in which the GATT/WTO variable was significant without country fixed effects, but is no longer significant with country fixed effects. This is encouraging: these are replications for which the GATT/WTO variable becomes insignificant with a commonly applied fix. However, there are also eight O’s in the bottom-right quadrant. These are new false positives: studies for which the WTO variable was insignificant without country fixed effects, but is now significant with country fixed effects.
Figure 3 shows the same results using the matching replications. There are fourteen X’s in the top-left quadrant – studies for which the GATT/WTO variable was significant, but is insignificant when we use matching. However, there are twelve O’s in the bottom-right quadrant – new false positives that arise from the matching approach.
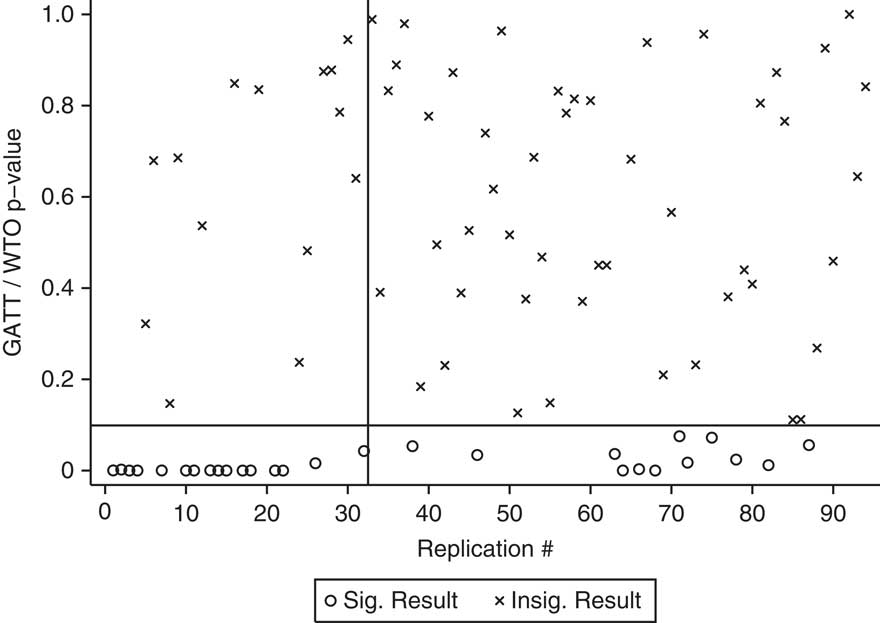
Fig. 3 P-values for effect of GATT/WTO on irrelevant DVs, matching
Nor were the false positives from the matching replications simply caused by a failure to achieve balance on observables. The degree to which the matching procedure achieved balance on observables varied across replications. However, better balance was not associated with a decreased false positive rate. The mean percent reduction in bias, averaged across each of the observables used in the replication, was very similar for replications that did and did not result in a positive result. A simple regression of the probability of a false positive on the percent reduction in bias shows virtually no association between the two.Footnote 21 And to reiterate, in the simulations contained in the Appendix, we show that high false positive rates due to selection on unobservables can result even when achieving a very high level of balance on observables in the matched sample.
COMBINING FIXES
So far we have only referred to unobservables writ large and assessed whether individual approaches decreased false positive rates. Yet there are many types of unobservables. Some are country specific and time invariant. In many contexts, we would expect this type of unobservable. Consider the difficulty in assessing whether membership in the GATT/WTO causes countries to trade more. There are many country-specific factors that affect whether/when a country joins the GATT/WTO and the amount they trade. For example, larger, more globalized and more prominent countries were among the GATT founding members. And it is entirely plausible that these countries also tend to trade more. If left unaccounted for, these factors bias us in favor of finding that GATT/WTO membership increases trade, even if it truly has no effect. Some of these factors might be easy to observe and account for. If country size is the confounding factor, then researchers could measure and control for a country’s GDP in some way. Levels of globalization or global prominence might be harder to observe.
Some unobservables may vary over time, affecting ratification and compliance. To continue the GATT/WTO and trade example from above, there are many candidates. Shipping costs decreased over time, which could encourage countries to join the GATT/WTO and to trade more. Consumers may, increasingly over time, love a variety of international goods coming from many different suppliers that could influence GATT/WTO membership and trade. Again, the presence of these types of year-specific unobservables or global trends biases estimates of the effects of the GATT/WTO on trade upwards. Shipping costs may be easy to observe and control for, while consumer tastes may not.
Some unobservables may take the form of a country-specific time trend. Countries may be on different trajectories with respect to ratification and compliance. For example, new (and new new) trade theories suggest that firms or countries can benefit from economies of scale of production, which might increase their market shares or drive out competitors. It is plausible that early ratifiers of the GATT/WTO were also the types of countries that could benefit from economies of scale, which would make the trend in their amount of trade more steeply sloped over time. These types of factors may be particularly difficult to observe and measure, since they may be based on features of the world further back in time and may rely on relative values of certain variables. More complex types of unobservables are certainly possible.
Given that there are many possible types of unobservables present, do combinations of fixes, with different fixes designed to address different types of unobservables, lower the false positive rate? Here, we show a ‘law of second-best solutions’. In economics, this term refers to situations in which fixing one (but not all) market imperfections can decrease aggregate welfare, relative to fixing none of the market imperfections. A similar phenomenon occurs here. Using a fix for one problem can exacerbate others. When researchers choose their empirical strategy to account for one type of unobservable, they can often make things worse if other types of unobservables are also present.
The first-best solution is to use an empirical approach that eliminates all of the unobservables that generate spurious sources of covariance between ratification and compliance. If this can be done, the effect of ratification on compliance is identified. However, if only some of these sources can be eliminated, the estimator’s performance can be worse than doing nothing. In fact, the second-best solution may be to do nothing. In related work, Plumper and TroegerFootnote 22 finding that unit-fixed effects strategies may be worse than pooled strategies in the presence of unobserved trending. ClarkeFootnote 23 and ClarkeFootnote 24 yield a similar finding: that including control variables has complex, possibly undesirable, effects on bias. Including an additional control variable could increase or decrease bias in the resulting estimates of interest.Footnote 25
Table 2 shows that combinations of fixes also fail to lower the false positive rate. Column 1 strips out any existing time-based fixes and includes a country-specific linear trend in each replication. Column 2 repeats this and also adds country fixed effects. Column 3 is identical to Column 1, except that it uses year fixed effects instead of country-specific linear trends. Column 4 uses country and year fixed effects.
Table 2 False Positive Rates for Replications with Multiple ‘Fixes’, GATT/WTO Variable
The false positive rate is lowest when using country-specific linear trends in isolation, as in Column 1. Yet even this is almost twice the rate afforded by conventional levels of statistical significance. Adding country and/or year fixed effects raises the false positive rates back to rates closer to Table 1.
One example of the law of second best comes from examining false positive rates in the original replications, the replications with country trends, and the replications with country trends and country fixed effects. The original false positive rate was 34 per cent, and it decreases when adding country trends. A researcher might reasonably expect that there are country-specific, time-invariant unobservables that she might want to address. However, adding country fixed effects to the country trends raises the false positive rate to 20 per cent.
CITES
One possible concern is that the GATT/WTO regime truly does have an effect on a variety of dependent variables, perhaps in ways that we have failed to imagine. While we believe this is highly unlikely, our results hold even when we use a more conservative replication approach. We also replicated all of the analysis conducted above, using the CITES treaty instead of the GATT/WTO. CITES is a convention designed to safeguard certain species from over-exploitation. It went into force in 1975, and 179 countries are parties to the convention.
The CITES treaty is very close to a ‘true placebo’ test. It has virtually no theoretical link to any of the dependent variables analyzed. Its rules only govern a minuscule percentage of global trade, and compliance with those rules is inconsistent at best. It is extremely unlikely that CITES membership has any effect on the dependent variables we analyze. The replications with CITES also have the advantage that, unlike the GATT regime, it is not simply developed Western democracies that joined the regime early on. CITES members are a diverse group, and the earliest members included countries with the most endangered species in need of protection.
Table 3 replicates the results from the first table above. The false positive rate, 27 per cent, is only slightly lower than those found above. In the reduced replications, the false positive rate was 35 per cent and rose to 36 per cent when we added country fixed effects. Time fixes and matching only lowered the false positive rate to 27 per cent and 22 per cent, respectively.
Table 3 False Positive Rates for Replications, CITES Variable
The same problem found above, where fixes remove some false positives while also creating new ones, is again present. Figures 4–6 replicate the same series of figures that we presented in the GATT/WTO replications. Figure 4 shows the p-values from the original replications, using the CITES variable. Figures 5 and 6 retain the same ordering of studies from Figure 4 and show the new p-values. Country fixed effects make the CITES variable insignificant in four of the original replications, yet make it significant in twelve replications where it was insignificant before. Matching fares slightly better, removing thirteen false positives, but creating nine new ones.
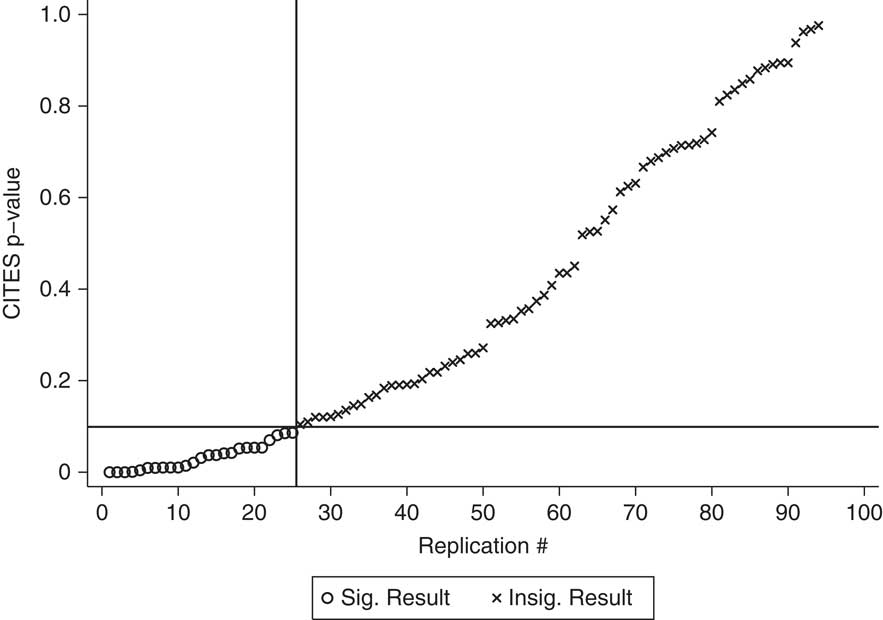
Fig. 4 P-values for effect of CITES on irrelevant DVs
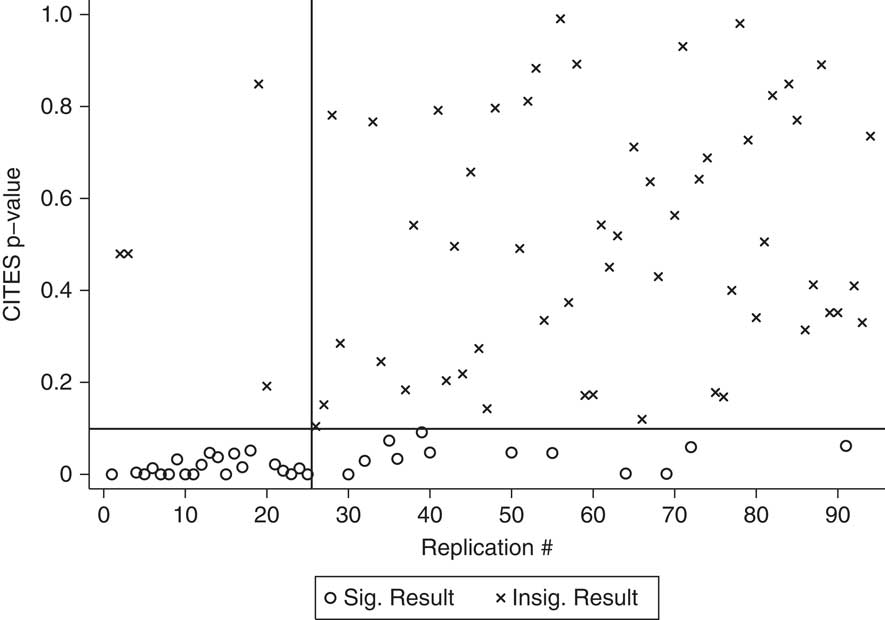
Fig. 5 P-values for effect of WTO on irrelevant DVs, fixed effects
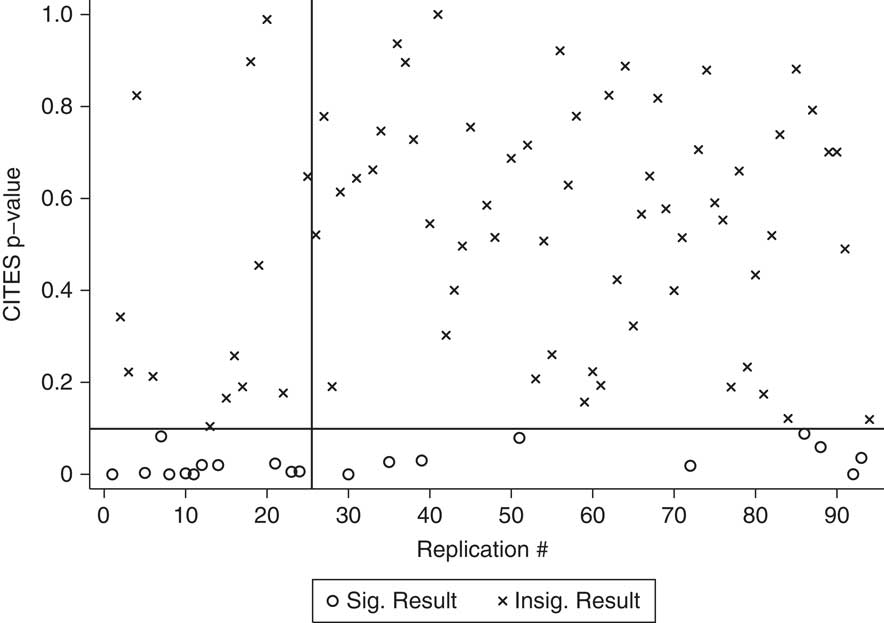
Fig. 6 P-values for effect of WTO on irrelevant DVs, matching
Combinations of fixes again fail to lower the false positive rate, as shown in Table 4, which repeats the same series of specifications as in Table 2. The false positive rate is lowest when using country and year fixed effects, but is still too high (25 per cent). Year fixed effects in isolation yield a very high false positive rate, 42 per cent. Adding country fixed effects to country trends again raises the false positive rate from 26 to 31 per cent.
Table 4 False Positive Rates for Replications with Multiple ‘Fixes’, CITES Variable
SIMULATIONS
We have focused on our replications because they provide tangible, real-world examples of the situations and decisions facing applied researchers. However, all of these results are replicable in a controlled environment using Monte Carlo simulations. The Appendix contains an extensive description of these simulation results. We describe a general data-generating process (DGP) that is theoretically grounded in our understanding of treaties and compliance, and which accommodates several possible types of unobservables. We then consider the results from four cases of replications. The cases differ from one another in two ways. First, we gradually increase the overall covariance between the ratification disturbance term and the compliance disturbance term. In other words, the overall problem of selection on unobservables gradually gets worse.
Secondly, we vary the type of correlation across disturbances. In some cases, all of the covariance between ratification and compliance disturbances is attributable to within-unit variance caused by our period effects. In other cases, this covariance is attributable to both within- and between-unit variance in the unobservables. In other words, some cases involve only one type of selection on unobservables, and others involve two sources.
We evaluated the performance of three approaches: ordinary least squares with no fixed effects (‘do nothing’), unit fixed-effects and matching. We expected – and found – two trends in the results. First, the false-positive performance of the ‘do-nothing’ estimators deteriorates across our cases as we move from low to high covariance between the ratification and compliance disturbances. Secondly, the relative performance of our fixed-effects estimators improved in our high-covariance cases in which some of the overall covariance is attributable to unit effects, but deteriorated when this is not the case.
Additionally, the false positive rates of the matching approach further support the argument made above that, even when the researcher can achieve balance on observables, this does not insulate against false positives resulting from imbalance on unobservables. In the Monte Carlo simulations we do very well in achieving balance on observables, yet we still have false positives. This further confirms that our results in the replication sections above are not artifacts of a failure to achieve balance on observables or a failure to use a particular matching algorithm.
SENSITIVITY TESTS
Unobservables affecting ratification and outcomes like compliance are likely to be complex and multifaceted. Applied empirical work risks producing biased estimates when assumptions about unobservables do not match the ‘true’ DGP. This is particularly daunting since assumptions about unobservables are inherently untestable.
Sensitivity analysis is a powerful tool for conditioning inference even when the true nature of unobservables is unknown. We advocate sensitivity analysis that uses observables as a guide for assessing the consequences of unobservables.Footnote 26 This type of sensitivity analysis asks ‘how severe would selection on unobservables need to be, relative to selection on observables, to drive our estimated effect to zero?’ The approach compares the marginal effects of theoretically relevant, measurable covariates – observables – and unobservables on the probability of ratification, that is, of receiving the treatment. If the conclusion is that selection on unobservables would need to be twice as severe as selection on observables, for example, this means that the marginal effect of unobservables on the probability of receiving the treatment would have to be twice as large as the marginal effect of observables.
In practice, this approach requires the researcher to choose the observable covariates, which will serve as the reference set for benchmarking the strength of unobservables. This set can include any number of the observable covariates used in the analysis. Observables in this context, Xʹβ, are a linear combination of covariates with weights that reflect their marginal effect on the outcome. We demonstrate how the choice of this reference set is critical.
We choose this particular approach for two reasons. First, the leverage of the approach is clearly linked to the strength of the researcher’s prior theoretical knowledge about the selection and outcome processes. Theoretical knowledge informs the choice of covariates for the reference set, which in turn conditions the ability (or inability) of the sensitivity analysis to rule out false positive results. Stronger theoretical knowledge yields stronger sensitivity analysis, and our choice of sensitivity approaches is influenced by a desire to put this relationship front and center.
Secondly, the approach is easily implementable for applied research. It requires recovered quantities from only a few basic regressions. We include the details of a general Stata package, poet, which implements the approach in wide array of settings. Sensitivity analysis is a vibrant field, and our goal is not an exhaustive characterization of all sensitivity tests or advocacy of one ‘best’ approach.Footnote 27 Rather, we hope this lowers the barriers to using sensitivity analysis in applied research, while still retaining an emphasis on the precise relationship between theory and the claims being made with the statistical quantity.
We first present the approach, highlighting the issue of choosing covariates for the reference set. We then compare the approach to other well-known approaches from ImbensFootnote 28 and Rosenbaum,Footnote 29 showing their similarities and differences. Lastly, we use two replications from the WTO/CITES replications and one new replication to show how the approach screens likely false positives and upholds likely true positives, and how reference set choices matter.
THE ALTONJI ET AL. APPROACH
This approach leverages the idea that, if unobservables have only a weak effect on ratification, then the researcher does not need to worry as much about bias resulting from selection on unobservables. If the effect is strong, then she does. To assess this, the test asks: how much stronger does selection on unobservables need to be, relative to selection on observables, in order to imply that there is no effect of ratification on compliance?
If, using this approach, the researcher finds that the strength of unobservables for explaining ratification has to be many times stronger than the effect of observables on ratification, then she can be confident in her estimated effects. If she finds that the strength of unobservables need only be a fraction of the strength of observables, she should be worried. The quantity of interest generated by this approach is a ratio: the ratio of strength of unobservables, relative to the strength of observables, which would drive the estimated effect of ratification to zero. Note that we use the pairs ‘ratification/compliance’ and ‘treatment/outcome’ interchangeably.
To calculate this ratio, we first need an expression for the bias in the estimated effect of ratification resulting from selection on unobservables. This bias can be expressed as:
 $${\rm plim}\hat{\alpha }\,{\equals}\,\alpha {\plus}{{{\rm var}\left( {r_{{it}} } \right)} \over {{\rm var}\left( {\tilde{r}_{{it}} } \right)}}\,\left[ {E\left[ {u_{{it}}^{c} \left| {r_{{it}} \,{\equals}\,1} \right.} \right]{\minus}E\left[ {u_{{it}}^{c} \left| {r_{{it}} \,{\equals}\,0} \right.} \right]} \right].$$
As before, r
it
describes whether country i has ratified the treaty in or before year t. X is a matrix containing the observables. c
it
describes whether country i complied in year t.
 $u_{{it}}^{c} $
are the disturbances from a regression of compliance on the observables.
$u_{{it}}^{c} $
are the disturbances from a regression of compliance on the observables.
 $E\left[ {u_{{it}}^{c} \left| {r_{{it}} \,{\equals}\,1} \right.} \right]{\minus}E\left[ {u_{{it}}^{c} \left| {r_{{it}} \,{\equals}\,0} \right.} \right]$
describes the degree of selection on unobservables. It is the shift in the distribution of unobservables affecting compliance when comparing ratifiers and non-ratifiers. The term
$E\left[ {u_{{it}}^{c} \left| {r_{{it}} \,{\equals}\,1} \right.} \right]{\minus}E\left[ {u_{{it}}^{c} \left| {r_{{it}} \,{\equals}\,0} \right.} \right]$
describes the degree of selection on unobservables. It is the shift in the distribution of unobservables affecting compliance when comparing ratifiers and non-ratifiers. The term
 ${{{\mathop{\rm var}} \left( {r_{{it}} } \right)} \over {{\mathop{\rm var}} \left( {\tilde{r}_{{it}} } \right)}}$
is necessary to adjust the bias expression after making treatment and the observables orthogonal. Under the null hypothesis of no ratification effect, that is, α=0, this expression implies Equation 2:
${{{\mathop{\rm var}} \left( {r_{{it}} } \right)} \over {{\mathop{\rm var}} \left( {\tilde{r}_{{it}} } \right)}}$
is necessary to adjust the bias expression after making treatment and the observables orthogonal. Under the null hypothesis of no ratification effect, that is, α=0, this expression implies Equation 2:
 $$E\left[ {u_{{it}}^{c} \left| {r_{{it}} \,{\equals}\,1} \right.} \right]{\minus}E\left[ {u_{{it}}^{c} \left| {r_{{it}} \,{\equals}\,0} \right.} \right]\,{\equals}\,\hat{\alpha }{{{\mathop{\rm var}} \left( {\tilde{r}_{{it}} } \right)} \over {{\mathop{\rm var}} \left( {r_{{it}} } \right)}}.$$
The left-hand side represents the degree of selection on unobservables necessary to explain all of the estimated ratification effect. Is it plausible that the selection problem is this severe? The innovation in Altonji et al.Footnote
30
is to use ‘the degree of selection on observables as a guide to the degree of selection on unobservables’.Footnote
31
We start by assuming that selection on unobservables is the same as selection on observables.Footnote
32
Formally, this means
 $\phi X'\beta \,{\equals}\,\phi _{{u_{{it}}^{c} }} $
in the linear projection of
$\phi X'\beta \,{\equals}\,\phi _{{u_{{it}}^{c} }} $
in the linear projection of
 $$r_{{it}}^{{\asterisk}} $$
onto Xʹβ and
$$r_{{it}}^{{\asterisk}} $$
onto Xʹβ and
 $u_{{it}}^{c} $
 $${\rm Proj}\left( {r_{{it}}^{{\asterisk}} \left| {X'\beta ,u_{{it}}^{c} } \right.} \right)\,{\equals}\,\phi _{0} {\plus}\phi _{{X'\beta }} X'\beta {\plus}\phi _{{u_{{it}}^{c} }} u_{{it}}^{c} ,$$
where
 $$r_{{it}}^{{\asterisk}} $$
is the latent variable that determines ratification,
$$r_{{it}}^{{\asterisk}} $$
is the latent variable that determines ratification,
 $$r_{{it}} \,{\equals}\,1\left( {r_{{it}}^{{\asterisk}} \,\gt\,0} \right)$$
, and β and
$$r_{{it}} \,{\equals}\,1\left( {r_{{it}}^{{\asterisk}} \,\gt\,0} \right)$$
, and β and
 $u_{{it}}^{c} $
are the vector of coefficients and disturbances, respectively, from a regression of c on X. In other words, the part of the compliance outcome that is attributable to observables, Xʹβ, has the same marginal effect on selection into the treatment as the part of the compliance outcome that is attributable to unobservables,
$u_{{it}}^{c} $
are the vector of coefficients and disturbances, respectively, from a regression of c on X. In other words, the part of the compliance outcome that is attributable to observables, Xʹβ, has the same marginal effect on selection into the treatment as the part of the compliance outcome that is attributable to unobservables,
 $u_{{it}}^{c} $
. Altonji et al.Footnote
33
show that the condition
$u_{{it}}^{c} $
. Altonji et al.Footnote
33
show that the condition
 $\phi _{{X'\beta }} \,{\equals}\,\phi _{{u_{{it}}^{c} }} $
implies
$\phi _{{X'\beta }} \,{\equals}\,\phi _{{u_{{it}}^{c} }} $
implies
 $${{E\left[ {u_{{it}}^{c} \left| {r_{{it}} \,{\equals}\,1} \right.} \right]{\minus}E\left[ {u_{{it}}^{c} \left| {r_{{it}} \,{\equals}\,0} \right.} \right]} \over {{\mathop{\rm var}} \left( {u_{{it}}^{c} } \right)}}\,{\equals}\,{{E\left[ {X'\beta \left| {r_{{it}} \,{\equals}\,1} \right.} \right]{\minus}E\left[ {X'\beta \left| {r_{{it}} \,{\equals}\,0} \right.} \right]} \over {{\mathop{\rm var}} \left( {X'\beta } \right)}},$$
which is used to calculate the sensitivity ratio.Footnote 34 Substituting Equation 3 into Equation 2 gives us the ratio of selection on unobservables to observables, which is necessary to drive the effect of ratification to zero:
 $${{\hat{\alpha }{\rm var}\left( {\tilde{r}_{{it}} } \right){\rm var}\left( {X'\beta } \right)} \over {{\rm var}\left( {r_{{it}} } \right){\rm var}\left( {u_{{it}}^{c} } \right)\,\left( {E\left[ {X'\beta \left| {r\,{\equals}\,1} \right.} \right]{\minus}E\left[ {X'\beta \left| {r\,{\equals}\,0} \right.} \right]} \right)}}.$$
In practice, calculating this ratio involves recovering quantities from simple regressions. First, the residuals
 $\tilde{r}_{{it}} $
are recovered from regressing ratifications on the observables. Secondly, regressing compliance on those residuals and the observables yields
$\tilde{r}_{{it}} $
are recovered from regressing ratifications on the observables. Secondly, regressing compliance on those residuals and the observables yields
 $\hat{\alpha }$
. Thirdly, estimating a constrained equation that constrains the effect of ratification to zero (for example, regressing compliance on the observables, but not ratification) yields
$\hat{\alpha }$
. Thirdly, estimating a constrained equation that constrains the effect of ratification to zero (for example, regressing compliance on the observables, but not ratification) yields
 $u_{{it}}^{c} $
and β.
$u_{{it}}^{c} $
and β.
COVARIATE CHOICE
Choosing which observable covariates to include in the reference set is highly consequential, yet this decision has received relatively little attention. Altonji et al.Footnote 35 assume that all observable covariates will be related to both the treatment and control, and therefore included in the reference set. Xʹβ thus includes all covariates, so there is no real choice to be made. Related sensitivity approaches, such as that proposed by Imbens,Footnote 36 primarily make multiple covariate-by-covariate comparisons rather than using a single linear combination of observables, so again there is no need to choose. Instead, the emphasis in the extant literature is on the statistics used for benchmarks.
In applied political science research, it will often be the case that making a single comparison with a linear combination of all the covariates is inappropriate, because some of the covariates are not theoretically linked to treatment. Including variables that are not theoretically linked to the treatment produces sensitivity ratios that have little power to detect false positives. This is because the sensitivity tests depend crucially on the relationship between the variance of the linear combination of observables and the conditional expectation of observables across treatment and control groups. Looking at Equation 3, including irrelevant covariates in the reference set – that is, covariates that are orthogonal to the treatment – does not affect the right-hand side numerator since these covariates are balanced across treatment and control groups. However, including them will likely increase the denominator. This artificially inflates the sensitivity ratio, because Equation 3 is inverted when substituted into Equation 2 to yield Equation 4. This raising of the ratio makes the researcher more likely to conclude that the estimated effect is robust, because it has given her less power to screen false positives. The researcher must take care to exclude theoretically irrelevant covariates from the reference set. At a minimum this typically means stripping away atheoretical trend, lag and dummy variables from the analysis.Footnote 37 Sensitivity analysis can be a useful tool for screening false positives and establishing that true positives are robust when implemented carefully, and this requires scrutinizing the set of observable covariates included in the reference set. Otherwise, it can lead researchers astray.
Using a subset of the observable covariates in the reference set also requires a change to the Altonji et al.Footnote 38 approach. One needs to condition the quantities in the standardized selection ratio for observables on the covariates excluded from the reference set. More formally, if we divide the covariates into a set that determines both the treatment (ratification) and the outcome (compliance), X j , and a set that determines the outcome (compliance) only, X k , the selection on observables ratio from Equation 3 becomes:
 $${{{\rm E}\,\left( {{{\rm X}} _{j}^{'} \hat{\beta }_{j} \left| {{{\rm X}} _{k}^{'} ,\,r_{{it}} \,{\equals}\,1} \right.} \right){\minus}E\,\left( {{{\rm X}} _{j}^{'} \hat{\beta }_{j} \left| {{{\rm X}} _{k}^{'} ,\,r_{{it}} \,{\equals}\,0} \right.} \right)} \over {{\rm var}\,\left( {{{\rm X}} _{j}^{'} \hat{\beta }_{j} \left| {{{\rm X}} _{k}^{'} } \right.} \right)}}.$$
The numerator is obtained from a regression of
 $X_{j}^{'} \hat{\beta }_{j} $
on X
k
and r
it
, while the denominator is taken from a regression of
$X_{j}^{'} \hat{\beta }_{j} $
on X
k
and r
it
, while the denominator is taken from a regression of
 ${{\rm X}} _{j}^{'} \hat{\beta }_{j} $
on X
k
only.Footnote
39
${{\rm X}} _{j}^{'} \hat{\beta }_{j} $
on X
k
only.Footnote
39
To be clear, we are not saying that researchers should exclude covariates that are orthogonal to the treatment from the outcome regression. Without these covariates, the estimated treatment effect would be inefficient. Moreover, leaving the orthogonal covariates out of the outcome regression would bias the estimated marginal effects for the remaining control variables, and this would render the sensitivity ratio uninterpretable. We are suggesting that, after estimating the treatment and covariate effects in a regression that includes the full set of controls, it is important to carefully select the covariates (and corresponding marginal effect estimates) that are used to calculate the sensitivity ratio. In other words, there are two steps in this sensitivity analysis. The first step is estimating treatment and marginal effects. The second step is calculating the sensitivity ratio. Covariate selection only applies to the second step.
RELATION TO IMBENS’ AND ROSENBAUM’S APPROACHES
A related approach compares the partialized explanatory power of observables and unobservables.Footnote 40 This approach is better known in political science, so our description is more brief.Footnote 41 In this approach, the bias from unobservables or, more typically, a single omitted variable is broken down into (1) the part that is due to the relationship between the omitted variable and the outcome and (2) the part that is due to the omitted variable and the treatment. These relationships are expressed in terms of partial-R 2 statistics, which are chosen for ease of interpretation.Footnote 42 For a given bias in an estimated treatment effect, there is a negative relationship between the two partial-R 2 statistics. When one of these sources of bias increases, the other must decrease in order to hold the overall bias constant. For purposes of comparison, ImbensFootnote 43 generates iso-curves that plot the relationship between the two partial-R 2 statistics, holding the bias constant.
These two approaches use different statistical approaches to compare observables and unobservables. Altonji et al.Footnote 44 use a single marginal effect statistic, while ImbensFootnote 45 uses two partial-R 2 statistics. But these differences are more apparent than real. We could generate isobias curves that plot the relationships between the marginal effects of an omitted variable on both the treatment and the outcome and plot observable covariates in this space – that is, use two marginal effect statistics rather than a single marginal effect statistic that takes the relationship with the outcome (the β in Xʹβ) as given. Likewise, we could take the two partial-R 2 statistics and express the information they provide as a single measure of explanatory power. We could then equate this measure for observables and unobservables and use it to produce a sensitivity ratio. For instance, partialized between-group explanatory power with respect to the outcome (where the groups are the units that receive the treatment and those that are in the control) combines information about the explanatory power of variables with respect to both the treatment and outcome. The condition that equates the partial between-group explanatory power of unobservables and observables is:
 $${{\left[ {E\left[ {u_{{it}}^{c} \left| {r_{{it}} \,{\equals}\,1} \right.} \right]{\minus}E\left[ {u_{{it}}^{c} \left| {r_{{it}} \,{\equals}\,0} \right.} \right]} \right]^{2} \,{\rm var}\left( {r_{{it}} } \right)} \over {{\rm var}\left( {u_{{it}}^{c} } \right)}}\,{\equals}\,{{\left[ {E\left[ {X'\beta \left| {r_{{it}} \,{\equals}\,1} \right.} \right]{\minus}E\left[ {X'\beta \left| {r_{{it}} \,{\equals}\,0} \right.} \right]} \right]^{2} \,{\rm var}\left( {r_{{it}} } \right)} \over {{\rm var}\left( {X'\beta } \right)}}.$$
If we use this equality to create a sensitivity ratio using explanatory power, as long as the ratios
 ${{{\rm var}\left( {\tilde{r}_{{it}} } \right)} \over {{\rm var}\left( {r_{{it}} } \right)}}$
and
${{{\rm var}\left( {\tilde{r}_{{it}} } \right)} \over {{\rm var}\left( {r_{{it}} } \right)}}$
and
 ${{{\rm var}\left( {X'\beta } \right)} \over {{\rm var}\left( {u_{{it}}^{c} } \right)}}$
do not differ much from one, the choice of statistic, marginal effect or partial between-group coefficient of determination (Eq. 5 vs. Equation 3) will not matter in a qualitative sense. Given the same set of observable covariates, if we conclude that selection on unobservables would have to be stronger (or weaker) than selection on observables using one statistic, we will come to a similar conclusion using the other statistic as well.Footnote
46
The choice of covariates is frequently more consequential than the choice of statistic, a point that is underemphasized in the literature on sensitivity testing. We demonstrate the importance of theoretically informed covariate selection below.
${{{\rm var}\left( {X'\beta } \right)} \over {{\rm var}\left( {u_{{it}}^{c} } \right)}}$
do not differ much from one, the choice of statistic, marginal effect or partial between-group coefficient of determination (Eq. 5 vs. Equation 3) will not matter in a qualitative sense. Given the same set of observable covariates, if we conclude that selection on unobservables would have to be stronger (or weaker) than selection on observables using one statistic, we will come to a similar conclusion using the other statistic as well.Footnote
46
The choice of covariates is frequently more consequential than the choice of statistic, a point that is underemphasized in the literature on sensitivity testing. We demonstrate the importance of theoretically informed covariate selection below.
Also related, RosenbaumFootnote 47 presents an approach to sensitivity analysis for matched observations that benchmarks against the experimental ideal of random assignment, under which all subjects are equally likely to receive the treatment. Using this approach, we ask: how much more likely to receive the treatment would the treated subjects have to be before we would change our conclusion about a causal effect (for example, fail to reject the null hypothesis)? The answer to this question comes in the form of an odds ratio denoted by Γ. If the critical value is Γ=2, for example, the treated units would have to be twice as likely to receive the treatment as the untreated. The likelihood that the differences between the treated and control subjects can be explained by hidden bias decreases with Γ. This form of sensitivity analysis is similar in spirit to that in Altonji et al.Footnote 48 The main differences are, first, that Rosenbaum’s approach works with matching while Altonji et al.’s sensitivity analysis is regression based. And secondly, the benchmark for Rosenbaum is random assignment while Altonji et al. use observable covariates to benchmark selection on unobservables.
In the matching context, it makes sense to continue using Rosenbaum bounds. The drawback is that the random assignment benchmark may not always be a good gauge of sensitivity. Is it unreasonable to believe that an unobservable trait makes the treated subjects twice as likely to be treated? For example, in IR research, is it unreasonable to believe that a group of states that signs a human rights treaty shares an unobservable commitment to improving or sustaining their good human rights practices, and that this commitment made them twice as likely to sign the treaty as the group of states that chose not to sign? It would be helpful to know whether any observable covariates have an effect of this size on the probability of being treated. For instance, if raising GDP per capita by a relatively small amount doubles the odds that a country will sign the human rights treaty, it seems perfectly reasonable to believe that an unobservable confound could explain away the entire treatment effect. In principle, one could use a propensity score regression for this purpose, in which case the difference between Altonji et al.’s approach to sensitivity analysis and Rosenbaum’s should be small.Footnote 49
GOVERNMENT REVENUE FALSE POSITIVE
One example from the main replication exercise, from Gerring, Thacker and Moreno,Footnote 50 found that WTO membership increases government revenue as a share of GDP by 3.69 per cent, ceteris paribus. The estimated coefficient is statistically significant (t-statistic of 6.96), and the result is robust to including country fixed effects and the matching approach. This positive relationship is likely spurious. The WTO explicitly limits tariff barriers, and government revenue data include tariffs as a source of revenue. However, governments that join the WTO tend to be less corrupt and better governed, and thus better able to collect revenue. It is possible that these hypothetical sources of selection on unobservables generated the positive result. This result is useful for demonstrating the ability of sensitivity testing to assess the estimated positive effect and for illustrating the issues related to covariate selection raised above.
To assess the likelihood of a false positive relationship, we calculate sensitivity ratios for three different linear combinations of observables (reference sets) using: (1) all the covariates from the original regression, (2) all the covariates less the trend, lag and dummy variables and (3) a theoretically informed subset of covariates. Davis and WilfFootnote 51 allow us to draw on theory to choose the third reference set of covariates. They argue that political variables (such as a country’s level of democracy) and economic variables (such as a country’s per capita GDP) affect which countries join the GATT/WTO. Fortunately, several variables in the Gerring et al. study measure similar quantities to those which Davis and Wilf identify as important determinants of ratification. From the covariates in the Gerring et al. study, we select Centripetalism, Democracy Stock, GDP per capita and Population to include in the third reference set. We also include Oil Production since, as Davis and Wilf note, oil is not governed by the trade regime, which may discourage membership among oil exporters.
The results are in Table 5, which provides the quantities required to calculate the sensitivity ratios. The columns in the upper part of the table give the quantities that vary by linear combination. The lower part of the table gives the quantities in the ratios that do not depend on the reference set. We use ^ to denote estimates recovered from particular regressions.Footnote 52 The first thing to note is that the choice of reference set matters greatly for whether the estimated effect is deemed robust. The first sensitivity ratio, based on all the covariates, is 1.41, suggesting the GATT/WTO–tax relationship is robust. However, this is based on a linear combination that includes covariates that are not linked theoretically to membership in GATT/WTO.Footnote 53 Benchmarking against irrelevant covariates has given us too little power to detect a false positive, and we worry that this ratio is too large.
Table 5 Sensitivity Table for Government Revenue False Positive

a Imbalance implied by the assumption that selection on observables is equal to selection on unobservables.
b Imbalance implied by the assumption that the null hypothesis of no treatment effect is true. The sensitivity ratio is the ratio of the latter (b) to the former (a). ***Statistically significant at the 0.01 level.
As expected, when we begin to prune away the irrelevant covariates, the sensitivity ratios become smaller. The second ratio, which excludes the trend, lag and dummy variables, produces a borderline sensitivity ratio of 0.982. The third calculation, using the theoretically relevant set of covariates, produces a sensitivity ratio of 0.72, which suggests the GATT/WTO–tax relationship is sensitive. More specifically, the null hypothesis of no ratification effect implies an omitted variable bias or, equivalently, an imbalance in unobservables of 2.336. The imbalance in the linear combination of theoretically relevant variables – Centripetalism, Democracy Stock, GDP per capita, Population and Oil Production – across the treatment and control groups is 3.258. Thus selection on unobservables (that is, the imbalance in unobservables) would only have to be 0.72 as strong as selection on the relevant observables (that is, the imbalance in the relevant observables) to account for the entire estimated treatment effect. This seems plausible. The five variables we identified have a theoretical relationship with WTO membership, but they do not explain all of the variation WTO membership. It is very possible that one or more unobservables are approximately seven-tenths as strong at explaining WTO membership as the observables we used here. In general, a value of 1 marks an important threshold for interpreting sensitivity ratios. A ratio less than 1 tells us that an imbalance in unobservables across the treatment and control groups that is smaller than the imbalance in the linear combination of theoretically relevant observables would be sufficient to produce an omitted variable bias large enough to account for the entire estimated treatment effect. A ratio greater than 1 implies that selection on unobservables would have to be stronger than selection on observables in order to entirely explain the estimated treatment effect.
TRADE TRUE POSITIVE
To assess how sensitivity analysis performs in situations in which the researcher believes that the institution has an effect, we replicated a recent study from Allee and Scalera.Footnote 54 The authors argue that some countries that join the WTO face a rigorous, demanding accession process that forces them to make greater concessions and more significant cuts to their protectionist barriers. Other countries face easier accession processes. They argue that a rigorous accession yields greater subsequent increases in trade. Their dataset uses country-year observations, covering all countries from 1950–2006. They regress the log of total trade of country i in year t (the outcome variable) on a dummy variable that indicates whether that country underwent a rigorous GATT/WTO accession (the institutional variable). In addition to period (year) dummy variables, they include five control variables: the log of the country’s population, the country’s GDP per capita, the number of states bordering the country, democracy and a measure of internal political conflict. In their main specifications, they find that a rigorous accession yields a 65 per cent increase in total trade, which is statistically significant at the 0.01 level. It is possible that unobservables, such as domestic market structure or factor endowments, affect the likelihood of a rigorous accession process and subsequent levels of trade.
Table 6 shows the results of the sensitivity analysis. Again we report sensitivity ratios for three linear combinations: (1) all of the variables, (2) all of the variables excluding the period dummies and (3) a theoretically informed subset of covariates. For the last set, we rely on Pelc,Footnote 55 who argues that market size and regime type determine the conditions under which countries join the WTO. Thus we include population, GDP and Polity score.
Table 6 Sensitivity Table for Trade True Positive

a Imbalance implied by the assumption that selection on observables is equal to selection on unobservables.
b Imbalance implied by the assumption that the null hypothesis of no treatment effect is true. The sensitivity ratio is the ratio of the latter (b) to the former (a). ***Statistically significant at the 0.01 level.
We find strong evidence that the rigorous accession treatment effect is robust. The sensitivity ratios for all three linear combinations are greater than 1. When we include all of the covariates the sensitivity ratio is 1.29. This implies that the imbalance in unobservables would have to be almost 30 per cent stronger than the imbalance in observables to account for the entire estimated treatment effect. Our concern with this particular linear combination, as previously, is that it is too large because the reference set of covariates includes variables that are irrelevant for the treatment. Therefore it is important to narrow the set. However, this time the concern is unwarranted. When we narrow the set to include only theoretically relevant variables, the imbalance in observables decreases at a faster rate than the variance. As a result, the sensitivity ratios get larger rather than smaller.Footnote 56 With the theoretically grounded set of covariates, we find that selection on unobservables would have to be nearly twice as strong as selection on observables to account for the entire estimated rigorous accession effect.
CONCLUSIONS
This article has covered a lot of ground. We conclude with the following remarks. First, recognizing the problem is inherently important. In the context of IR and international institutions, there are strong theoretical reasons to expect that unobservables affect ratification and compliance. This generates false positives, which lead us to mistakenly conclude that certain institutions cause compliance. As shown with a replication exercise using existing work and with Monte Carlo simulations, this problem is potentially severe and multifaceted. We found false positive rates generally around 34 per cent, which is much higher than would be tolerated by conventional assessments of statistical inference. The context we examined has similarities to many contexts studied in other subfields, where the possibility of false positives also exists. To the best of our knowledge, ours is the first widespread replication exercise to assess the severity of the problem of bias resulting from selection on unobservables.
Secondly, there is no universal ‘fix’. Neither matching nor fixed effects nor combinations of various approaches are likely to resolve this problem without strong prior theoretical knowledge about the underlying data-generating process. This problem is exacerbated by ‘the law of second best’, which describes how addressing only one aspect of the selection on unobservables problem can make the problem worse. Under different conditions, fixes can raise or lower false positive rates; researchers generally lack strong prior theoretical knowledge of these conditions. We demonstrated the law of second best, and confirmed our findings from the replication experiment, using carefully controlled Monte Carlo simulations.
Thirdly, theoretically informed sensitivity analysis is a powerful tool for assessing whether a particular result is a false positive. All existing approaches and fixes rely on untestable assumptions. Often, applied researchers lack valid sources of exogenous variation in their explanatory variable, which would be required for an instrumental variables approach or an alternative identification strategy. Even when faced with these problems, sensitivity analysis allows the researcher to assess how sensitive her estimates are to alternative assumptions about the severity of the selection on unobservables problem. Crucially, the leverage generated by the test depends on her theoretical knowledge of the particular context. Theoretical knowledge determines her choice of covariates to include in the implementation of the test, a choice that has serious implications for the results and interpretation of the test. Ultimately, the ability of a sensitivity approach to persuasively screen a false positive and approve a true positive result is founded on the researcher’s theoretical knowledge, against which she will benchmark her results.
Finally, our strongest emphasis is on the relationship between theoretical knowledge and empirical models. Every facet of the problem of false positives – its existence, severity, solution and assessment – requires the researcher to think carefully about the underlying data-generating process and what she theoretically believes about it. These beliefs are hopefully persuasive, based on logically consistent models of behavior, supported by ancillary data or experience, or commonly agreed upon; at each and every step, they are called upon. The search for a single ‘fix’ to the selection on unobservables problem – or a foolproof sensitivity test that does not require the researcher to carefully draw on her theoretical knowledge – is quixotic. We hope we have given applied researchers guidance and tools to leverage their theoretical knowledge in the face of the commonly encountered threat to inference, selection on unobservables.


